
2-18 matplotlib模块的使用

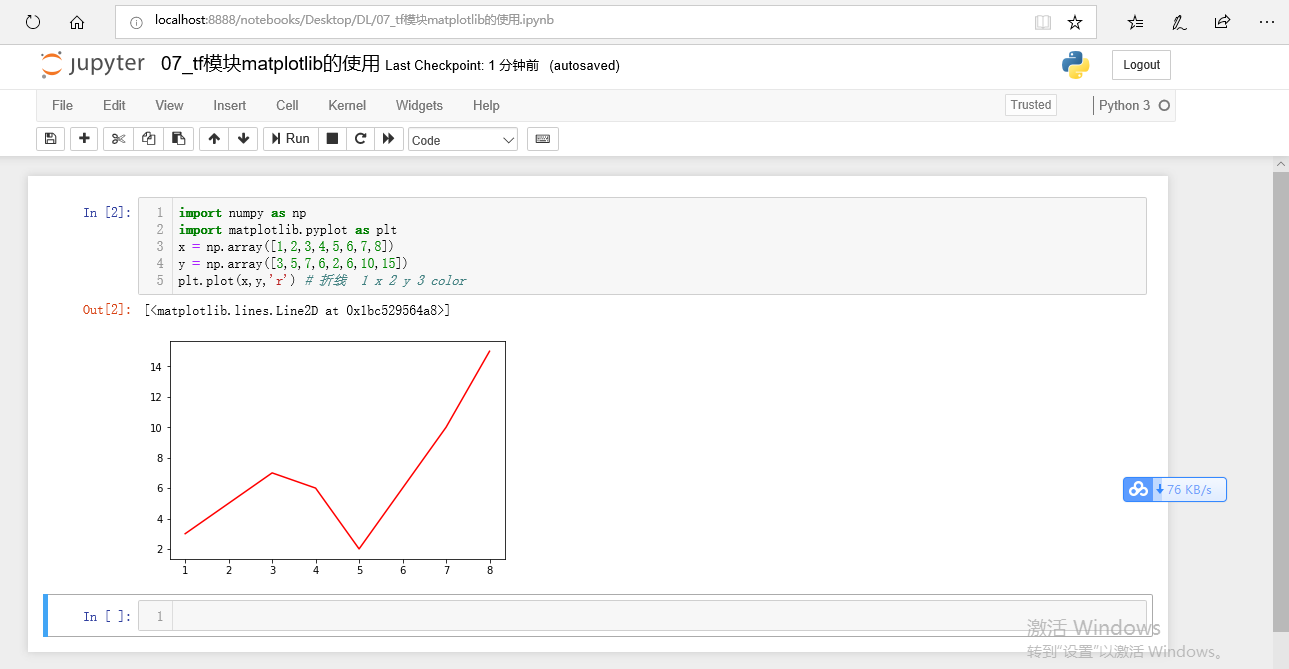
import numpy as np
import matplotlib.pyplot as plt
x = np.array([1,2,3,4,5,6,7,8])
y = np.array([3,5,7,6,2,6,10,15])
plt.plot(x,y,'r') # 折线  1 x 2 y 3 color
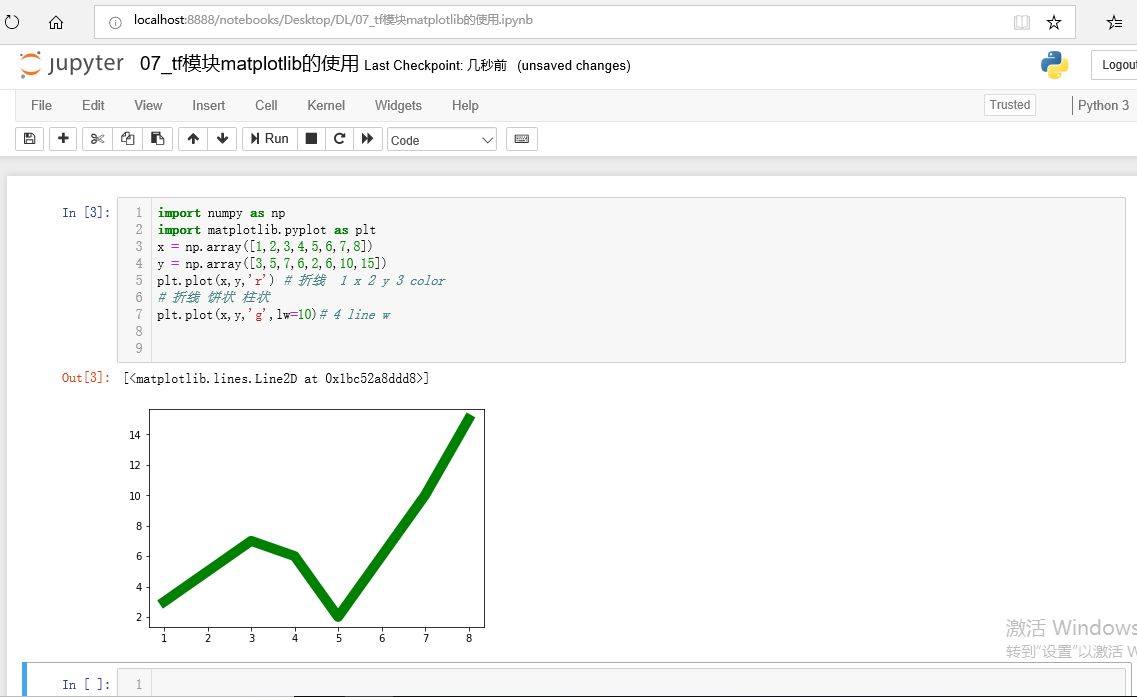
import numpy as np
import matplotlib.pyplot as plt
x = np.array([1,2,3,4,5,6,7,8])
y = np.array([3,5,7,6,2,6,10,15])
plt.plot(x,y,'r') # 折线  1 x 2 y 3 color
# 折线 饼状 柱状
plt.plot(x,y,'g',lw=10)# 4 line w
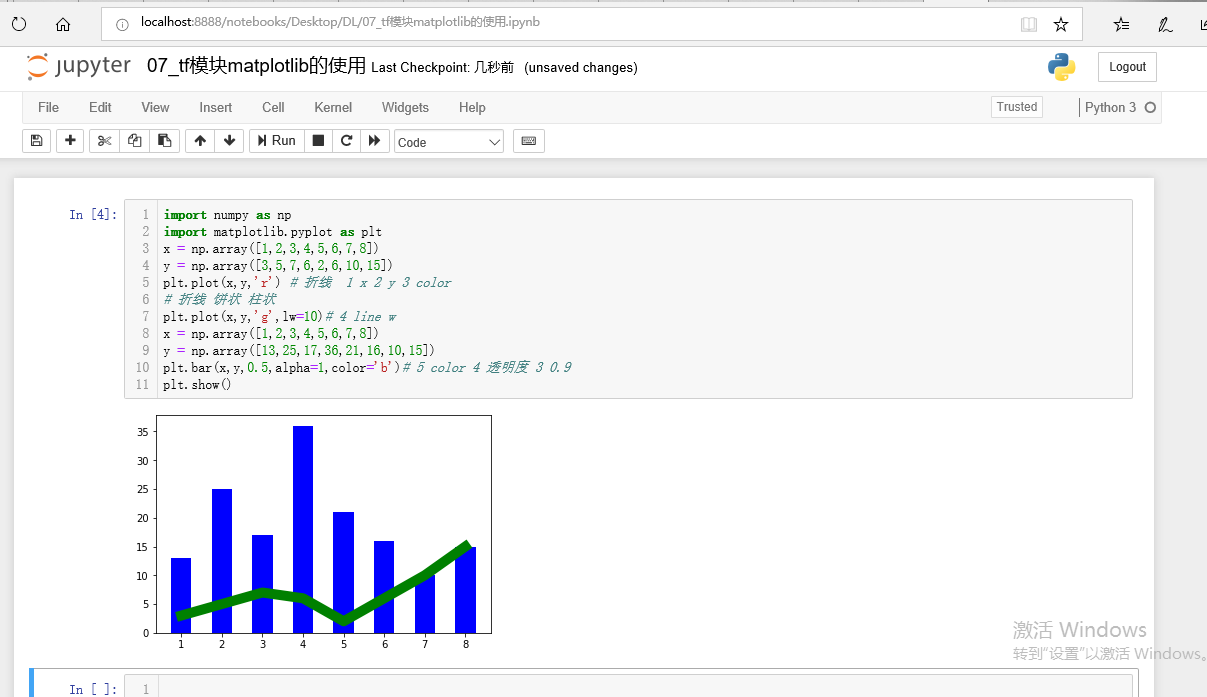
import numpy as np
import matplotlib.pyplot as plt
x = np.array([1,2,3,4,5,6,7,8])
y = np.array([3,5,7,6,2,6,10,15])
plt.plot(x,y,'r') # 折线  1 x 2 y 3 color
# 折线 饼状 柱状
plt.plot(x,y,'g',lw=10)# 4 line w
x = np.array([1,2,3,4,5,6,7,8])
y = np.array([13,25,17,36,21,16,10,15])
plt.bar(x,y,0.5,alpha=1,color='b')# 5 color 4 透明度 3 0.9
plt.show()
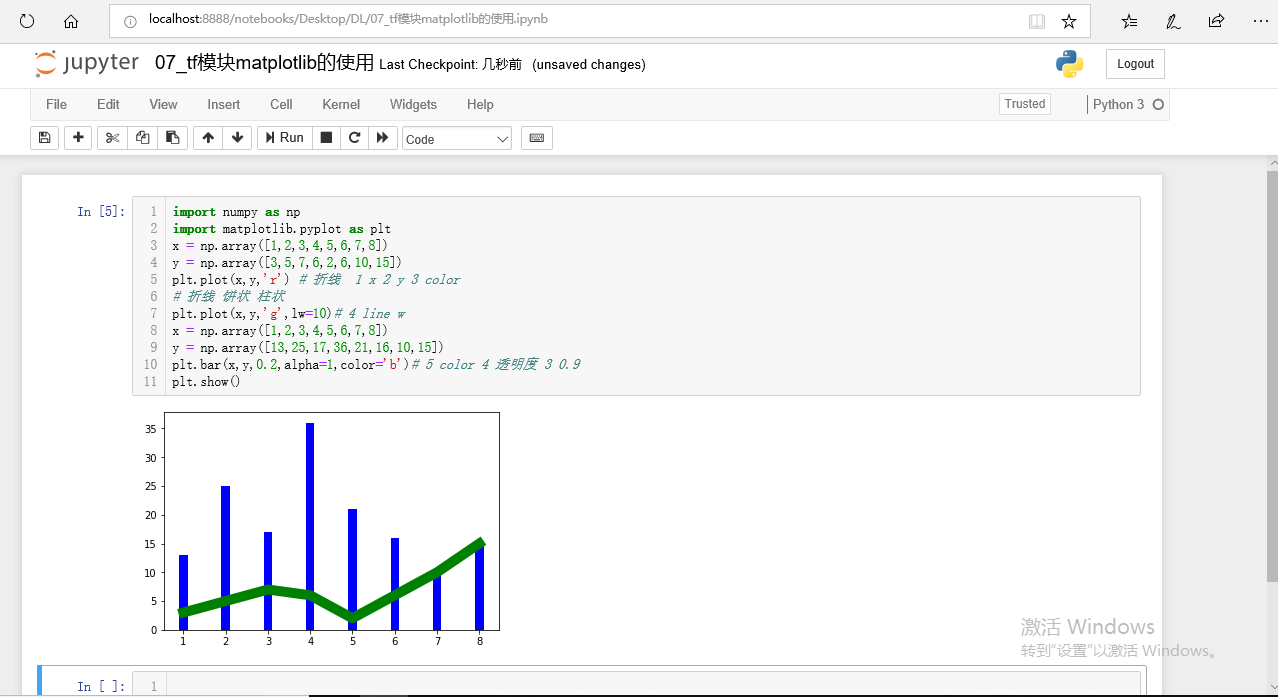
import numpy as np
import matplotlib.pyplot as plt
x = np.array([1,2,3,4,5,6,7,8])
y = np.array([3,5,7,6,2,6,10,15])
plt.plot(x,y,'r') # 折线  1 x 2 y 3 color
# 折线 饼状 柱状
plt.plot(x,y,'g',lw=10)# 4 line w
x = np.array([1,2,3,4,5,6,7,8])
y = np.array([13,25,17,36,21,16,10,15])
plt.bar(x,y,0.2,alpha=1,color='b')# 5 color 4 透明度 3 0.9
plt.show()

 浙公网安备 33010602011771号