监控系列:Prometheus
监控服务-Prometheus
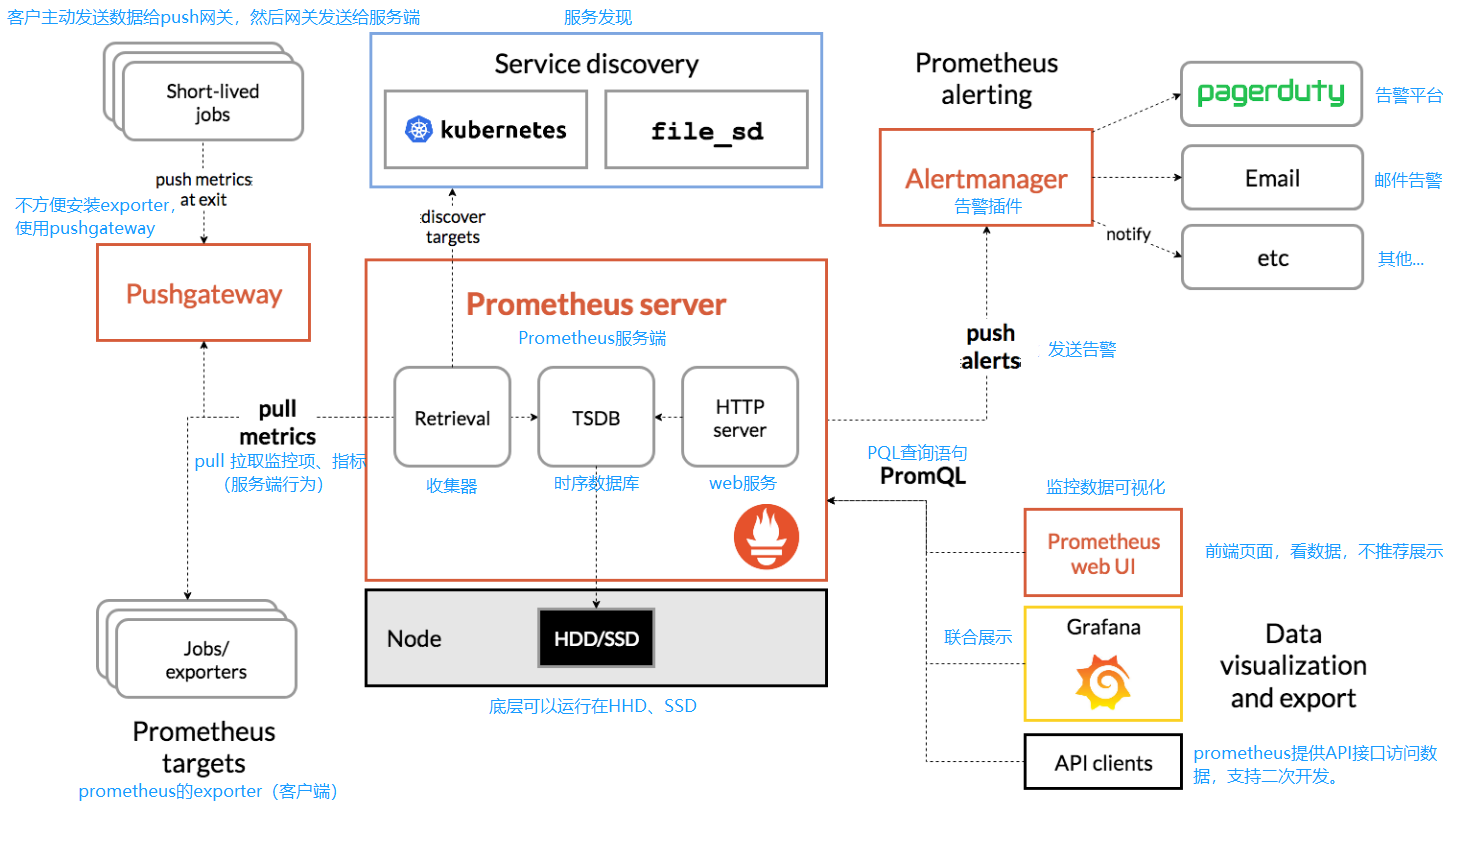
1. Prometheus监控架构
2. Prometheus、Zabbix对比
| 指标 | Prometheus | Zabbix |
|---|---|---|
| 语言 | Golang | PHP(服务端)、C、Go(agent2) |
| 部署 | 二进制,解压即可用。 | yum、编译、数据库、php依赖等等 |
| 是否容易掌握 | 门槛较高 | 容易使用 |
| 监控方式 | 通过各种exporter,http | 各种内置模板、客户端、自定义监控、各种协议。 |
| 应用场景 | 监控服务、容器、k8s | 监控系统底层,硬件、系统、网络。 |
3. Prometheus极速上手
3.1 前期准备
| 角色 | 主机名 | ip |
|---|---|---|
| prometheus服务端 | prometheus | 10.0.0.24 / 172.16.1.24 |
| grafana | grafana | 10.0.0.23 / 172.16.1.23 |
| docker01 | docker01 | 10.0.0.81 / 172.16.1.81 |
写入hosts
cat >>/etc/hosts<<EOF
172.16.1.24 prometheus prometheus.yinjay.com
172.16.1.23 grafana grafana.yinjay.com
172.16.1.81 docker01 docker01.yinjay.com
EOF
3.2 部署Prometheus
所有主机时间同步
*/2 * * * * /sbin/ntpdate ntp1.aliyun.com &>/dev/null
先将两个软件包上传到/soft/prometheus,可在清华源上下载最新版 https://mirrors.tuna.tsinghua.edu.cn/github-release/prometheus/prometheus/
[root@prometheus ~]# mkdir -p /soft/prometheus
[root@prometheus ~]# cd /soft/prometheus/
-rw-r--r-- 1 root root  9033415 Jun  3 03:46 node_exporter-1.3.1.linux-amd64.tar.gz
-rw-r--r-- 1 root root 75819309 Jun  3 03:46 prometheus-2.33.3.linux-amd64.tar.gz
使用的两个软件可以在github上下载到此历史版本
prometheus-2.33.3.linux-amd64.tar.gz https://github.com/prometheus/prometheus/releases
node_exporter-1.3.1.linux-amd64.tar.gz https://github.com/prometheus/node_exporter/releases
解压prometheus-2.33.3.linux-amd64.tar.gz到/app目录下并进行软链接
[root@prometheus ~]# mkdir -p /app
[root@prometheus ~]# tar xf /soft/prometheus/prometheus-2.33.3.linux-amd64.tar.gz -C /app/
[root@prometheus ~]# ln -s /app/prometheus-2.33.3.linux-amd64/ /app/prometheus
目录结构
[root@prometheus ~]# tree -F /app/prometheus
/app/prometheus
├── console_libraries/
│   ├── menu.lib
│   └── prom.lib
├── consoles/
│   ├── index.html.example
│   ├── node-cpu.html
│   ├── node-disk.html
│   ├── node.html
│   ├── node-overview.html
│   ├── prometheus.html
│   └── prometheus-overview.html
├── LICENSE
├── NOTICE
├── prometheus*     #prometheus服务端的命令
├── prometheus.yml  #prometheus配置文件
└── promtool*

#prometheus默认读取当前目录下面的prometheus.yml配置文件。
3.3 启动Prometheus
后台运行
[root@prometheus ~]# cd /app/prometheus/
[root@prometheus prometheus]# nohup /app/prometheus/prometheus &>>/var/log/prometheus.log &
[1] 51691
[root@prometheus prometheus]# ss -lntup | grep prometheus
tcp    LISTEN     0      128    [::]:9090               [::]:*                   users:(("prometheus",pid=51691,fd=8))
宿主机新增一条host记录
10.0.0.24 prometheus.yinjay.com
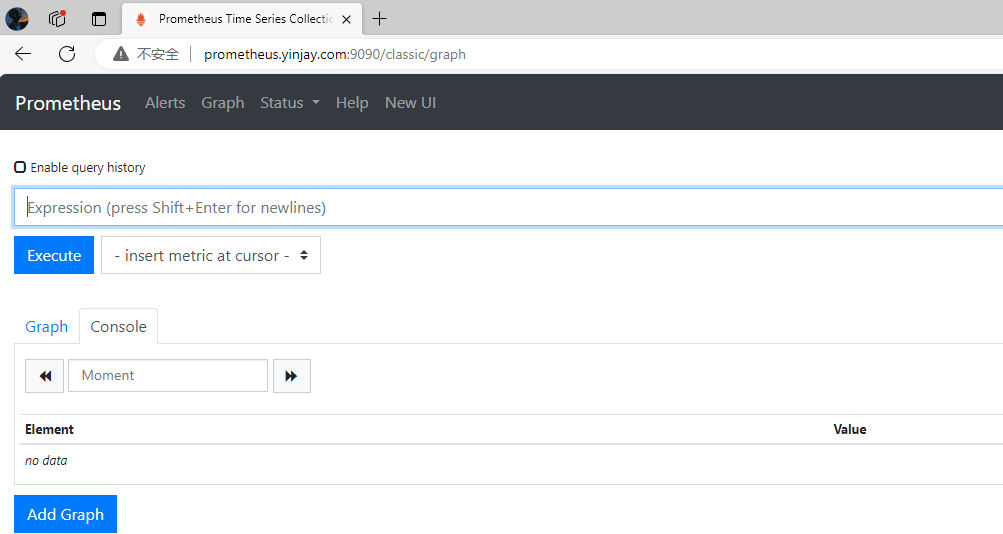
宿主机进行访问 prometheus.yinjay.com:9090
3.4 命令行选项
| Prometheus命令行核心选项 | |
|---|---|
| --config.file="prometheus.yml" | 指定配置文件,默认是当前目录下在的prometheus.yml |
| --web.listen-address="0.0.0.0:9090" | 前端web页面,端口和监听的地址。如果想增加访问认证可以用nginx。 |
| --web.max-connections=512 | 并发连接数 |
| --storage.tsdb.path="data/" | 指定tsdb数据存放目录 |
| --log.level=info | 日志级别:debug, info, warn, error四个级别。prometheus日志默认输出到屏幕(标准输出) |
| --log.format=logfmt | 日志格式。logfmt默认格式。 json格式(日志收集的时候使用) |
3.5 Systemd进行管理
关闭现有服务
[root@prometheus ~]# ss -lntup | grep prometheus
tcp    LISTEN     0      128    [::]:9090               [::]:*                   users:(("prometheus",pid=51691,fd=8))
[root@prometheus ~]# kill 51691
编写systemd文件
[root@prometheus ~]# cat /usr/lib/systemd/system/prometheus.service
[Unit]
Description=prometheus server
After=network.target

[Service]
Type=simple
ExecStart=/app/prometheus/prometheus --config.file=/app/prometheus/prometheus.yml --web.listen-address=0.0.0.0:9090 --web.max-connections=512
KillMode=process

[Install]
WantedBy=multi-user.target
加载配置并启动
[root@prometheus ~]# systemctl daemon-reload
[root@prometheus ~]# systemctl start prometheus
[root@prometheus ~]# ss -lntup | grep prometheus
tcp    LISTEN     0      128    [::]:9090               [::]:*                   users:(("prometheus",pid=54342,fd=7))
3.6 配置文件
#全局定义部分
global:
  scrape_interval: 15s  #这个间隔表示,prometheus采集数据的间隔
  evaluation_interval: 15s #执行对应的rules(规则)间隔,一般报警规则

#用于配置警告信息,alertmanager配置
alerting:
  alertmanagers:
    - static_configs:
        - targets:
          # - alertmanager:9093

rule_files:
  # - "first_rules.yml"
  # - "second_rules.yml"

#数据采集的配置(客户端)
scrape_configs:
    #任务名字.体现采集哪些机器,哪些指标
  - job_name: "Prometheus-YinJay-Server"

    static_configs:
      - targets: ["prometheus.yinjay.com:9090"]

    file_sd_configs:
#动态配置文件,动态读取文件内容,然后进行采集,实时监控。
重启服务
[root@prometheus ~]# systemctl restart prometheus
4. Prometheus的exporter
4.1 认识exporter
prometheus有众多的exporters,基本通过命令或docker运行。
- node_exporter 获取节点基础信息(系统监控)
- 服务的exporter 监控指定服务的
4.2 部署node_exporter
prometheus主机上已经有软件包,直接进行下列解压操作即可。
#解压到/app/prometheus目录下
[root@prometheus ~]# tar xf /soft/prometheus/node_exporter-1.3.1.linux-amd64.tar.gz -C /app/prometheus
grafana主机和docker01主机就从prometheus主机上进行拉取
#创建程序存放目录
mkdir -p /app/prometheus

#拉取node_exporter
scp root@172.16.1.24:/app/prometheus/node_exporter-1.3.1.linux-amd64/node_exporter /app/prometheus

#建立软链接
ln -s /app/prometheus/node_exporter /bin/
4.3 Systemd进行管理
除prometheus主机外都进行
cat /usr/lib/systemd/system/node_exporter.service
#文件内容如下:
[Unit]
Description=prometheus node_exporter
After=network.target

[Service]
Type=simple
ExecStart=/bin/node_exporter
KillMode=process

[Install]
WantedBy=multi-user.target

#加载配置
systemctl daemon-reload

#启动node_exporter
systemctl start node_exporter.service
4.4 配置Prometheus服务端
修改/app/prometheus/prometheus.yml配置文件,如下。新建一个job,然后添加targets。(图中两种写法都可以)
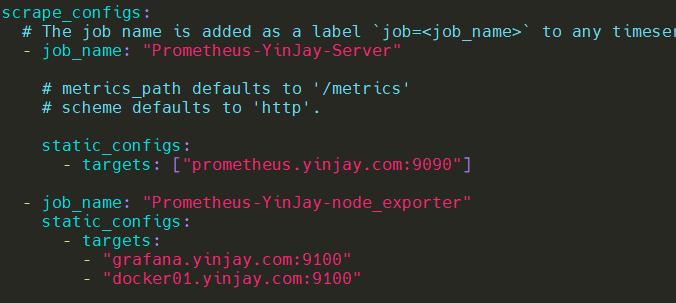
Tips:Prometheus服务端hosts文件需要有对应的解析!
重启prometheus
[root@prometheus ~]# systemctl restart prometheus
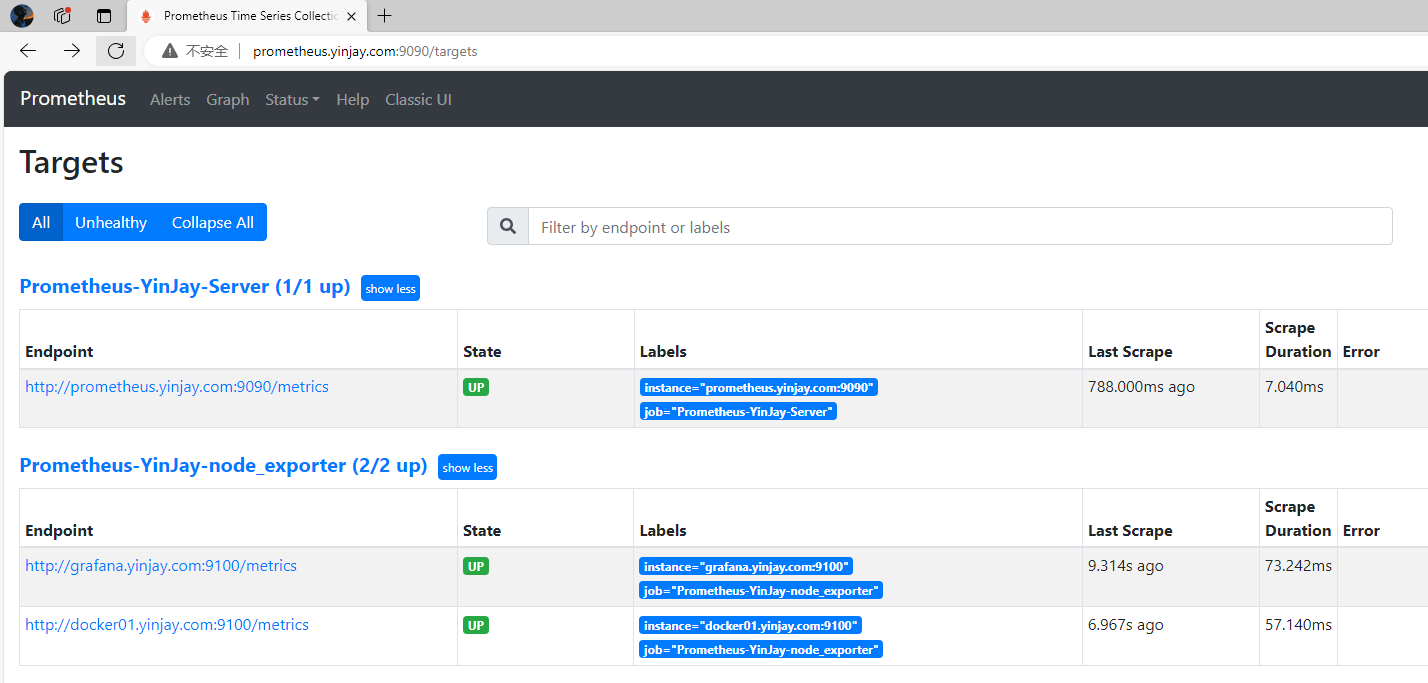
4.5 检查是否成功监控
没有问题!
4.6 Prometheus动态配置文件
获取的exporter域名+端口,写入配置文件,prometheus可以定时读取并加入到prometheus中。用于解决大量主机添加、删除的操作。
修改配置文件如下格式
- file_sd_configs:动态读取与加载配置文件
- files:指定要加载的配置文件
- refresh_interval:读取间隔
discovery_node_exporter.yml内容如下:
cat /app/prometheus/discovery_node_exporter.yml
[
  {
  "targets": [
   "docker01.yinjay.com:9100",
   "grafana.yinjay.com:9100"
   ]
  }
]
重启Prometheus,然后查看是否有成功监控即可。
[root@prometheus ~]# systemctl restart prometheus
5. Prometheus的Pushgateway
5.1 认识Pushgateway
应用场景: 自定义监控项,例如一些特殊的监控需求,通过自身写脚本获取到数据,然后推送Pushgateway上面。Prometheus再从gateway上进行拉取数据。
使用流程:部署启动Pushgateway,修改Prometheus服务端配置,测试数据是否能正常推送和拉取。
5.2 部署Pushgateway
下载pushgateway https://github.com/prometheus/pushgateway ,将软件包上传到/app/prometheus目录下,并进行解压和软链接。
[root@grafana ~]# ll /app/prometheus/
total 27276
-rwxr-xr-x 1 root root 18228926 Jun  3 21:28 node_exporter
-rw-r--r-- 1 root root  9695285 Jun  4 13:58 pushgateway-1.4.3.linux-amd64.tar.gz
[root@grafana ~]# cd /app/prometheus/
[root@grafana prometheus]# tar xf pushgateway-1.4.3.linux-amd64.tar.gz
[root@grafana prometheus]# ln -s /app/prometheus/pushgateway-1.4.3.linux-amd64/pushgateway /bin
5.3 启动Pushgateway
[root@grafana prometheus]# pushgateway &>>/var/log/pushgateway.log &
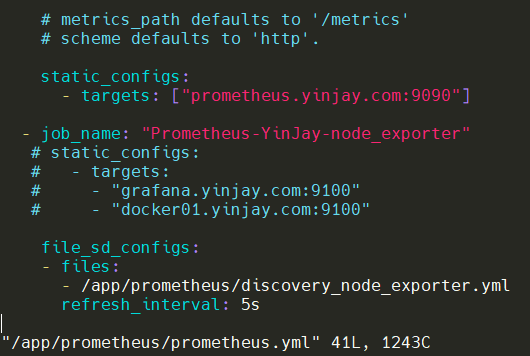
5.4 修改服务端配置文件
添加一个job,使用静态配置,也可以使用动态配置,按自己需求来。
重启服务
[root@prometheus ~]# systemctl restart prometheus
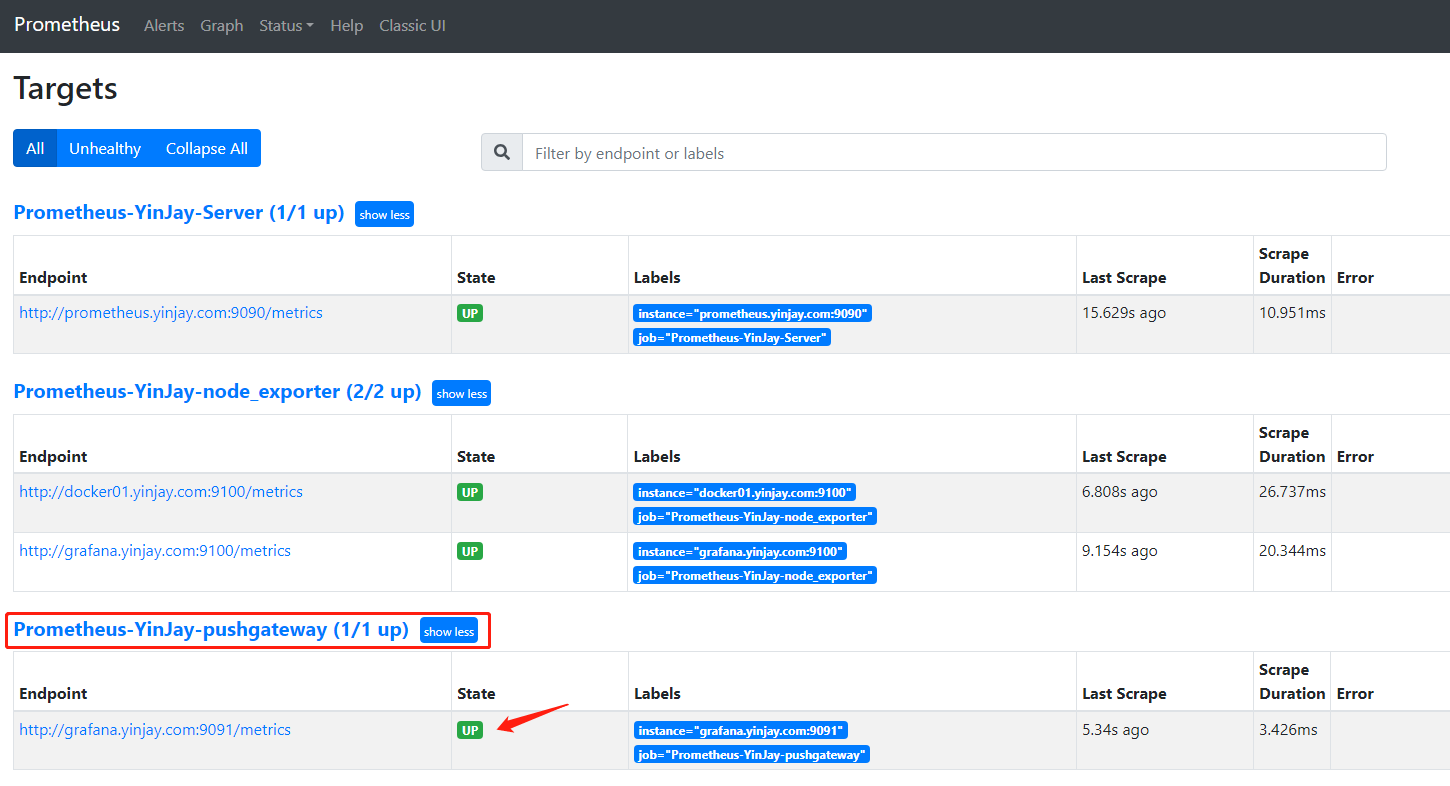
检查监控是否正常,没问题。
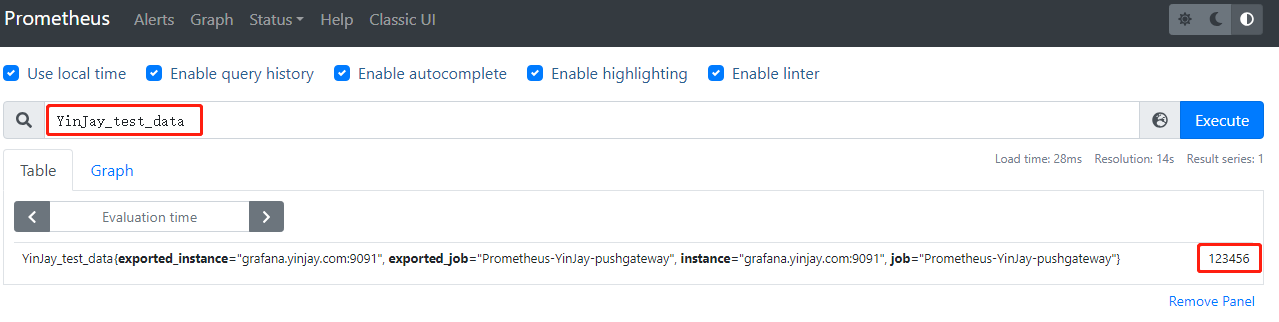
5.5 提交测试数据
模拟在docker01主机上提交数据到Pushgateway,然后再看看Prometheus是否能拉取到提交的数据。
docker01主机上提交测试数据,格式:"key value"
[root@docker01 ~]# echo "YinJay_test_data 123456" | curl --data-binary @- http://grafana.yinjay.com:9091/metrics/job/Prometheus-YinJay-pushgateway/instance/grafana.yinjay.com:9091
服务端进行查询,成功!
6. Prometheus接入Grafana
添加数据源
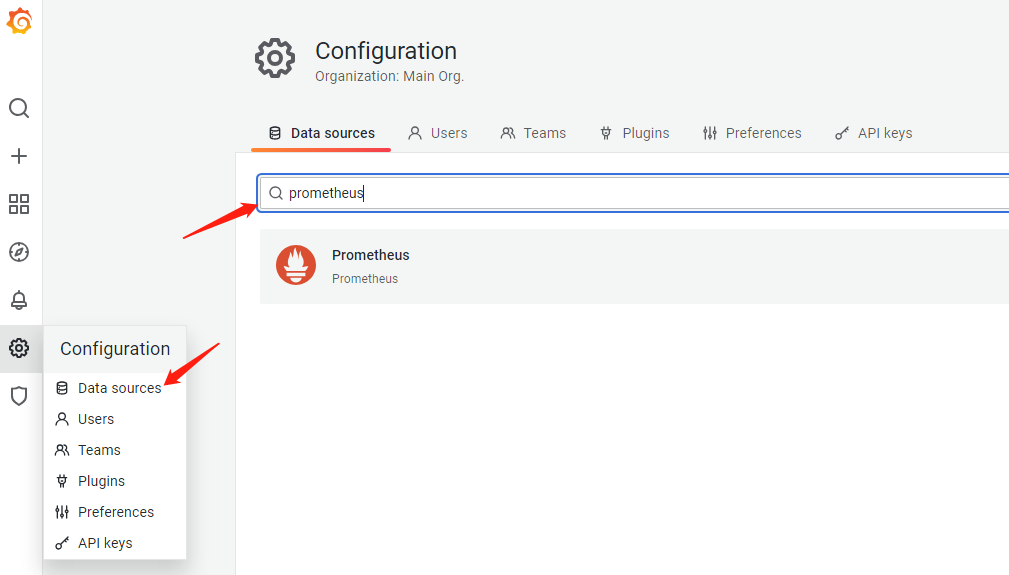
只用填写Prometheus服务端的URL
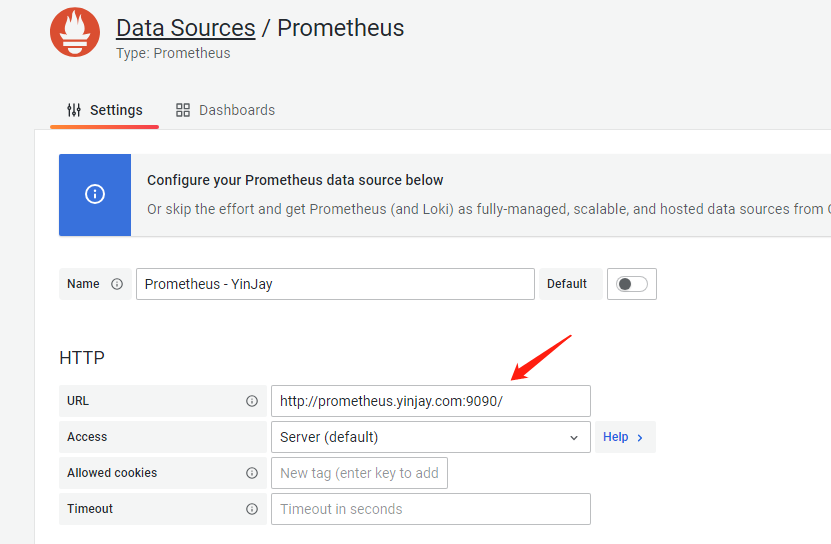
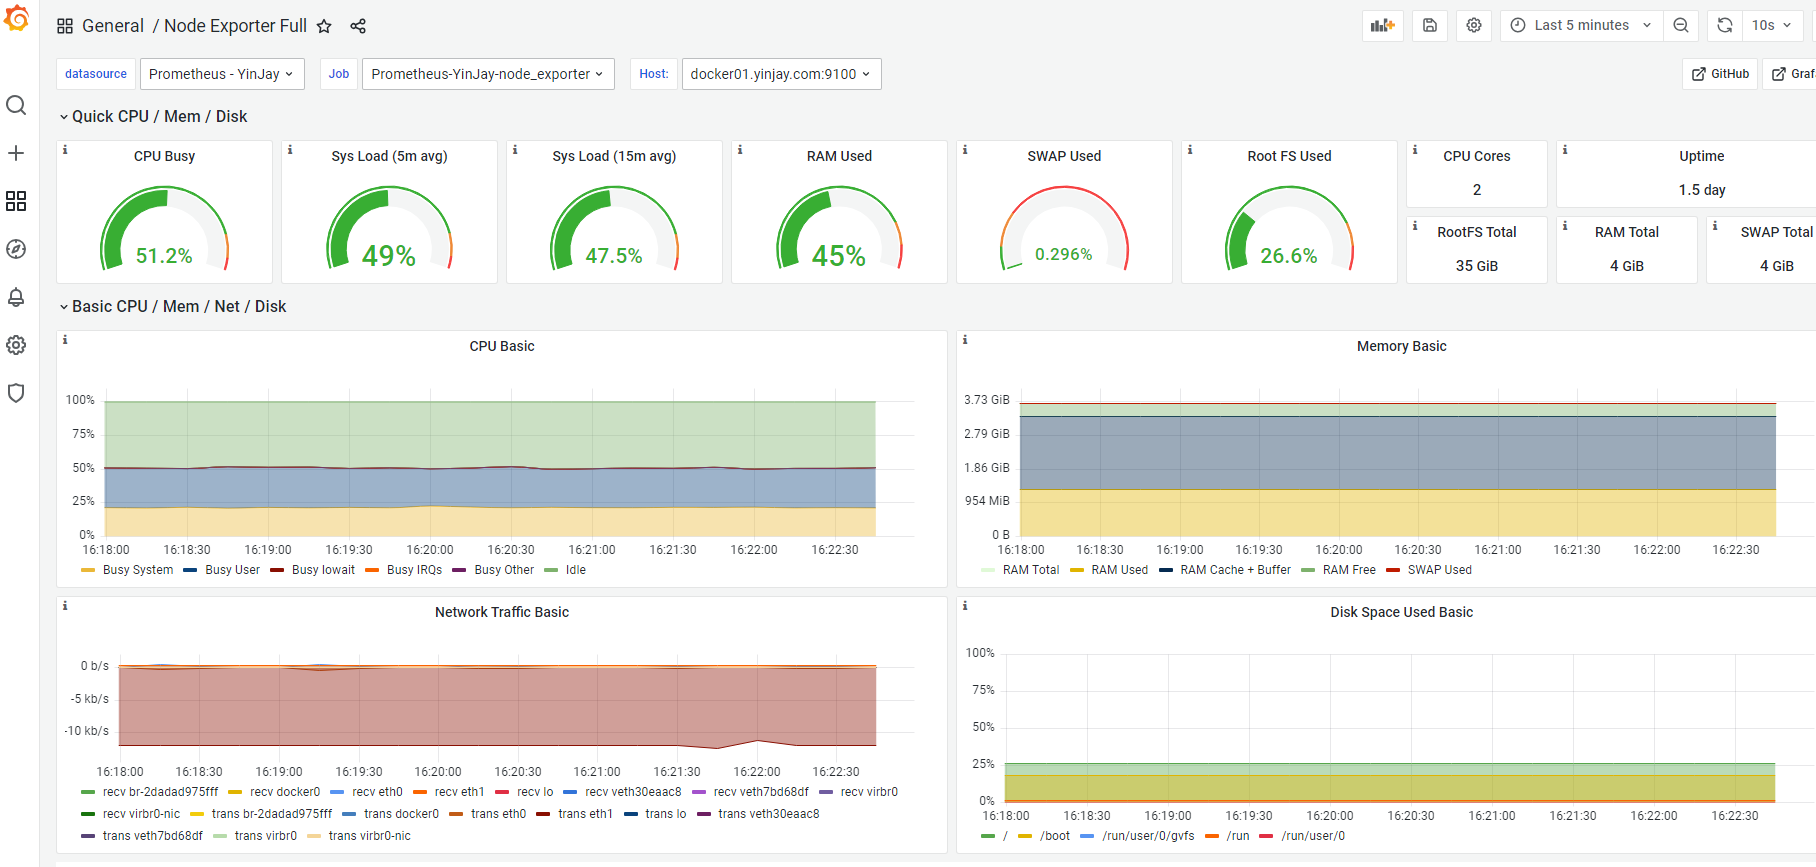
导入Dashboard,其他模板可以从这里看 https://grafana.com/grafana/dashboards/?plcmt=footer&search=prometheus

监控数据呼之欲出~
7. Prometheus的Alertmanager
7.1 认识Alertmanager
Alertmanager用于向用户发送告警信息
7.2 部署Alertmanager
下载Alertmanager https://github.com/prometheus/alertmanager ,将软件包上传到/app/prometheus目录下,并进行解压和软链接。
[root@prometheus ~]# wget -P /app/prometheus https://github.com/prometheus/alertmanager/releases/download/v0.24.0/alertmanager-0.24.0.linux-amd64.tar.gz

[root@prometheus ~]# tar xf /app/prometheus/alertmanager-0.24.0.linux-amd64.tar.gz -C /app/prometheus
[root@prometheus ~]# mv /app/prometheus/alertmanager-0.24.0.linux-amd64 /app/prometheus/alertmanager
[root@prometheus ~]# ln -s /app/prometheus/alertmanager/alertmanager /bin
7.3 启动Alertmanager
后台运行alertmanager,并检查是否正常启动。
[root@prometheus ~]# alertmanager --config.file="/app/prometheus/alertmanager/alertmanager.yml" &>>/var/log/alertmanager.log &
[1] 62950
[root@prometheus ~]# ps -ef | grep alertmanager
root      62950  56433  0 04:45 pts/1    00:00:00 alertmanager --config.file=/app/prometheus/alertmanager/alertmanager.yml
root      62959  56433  0 04:45 pts/1    00:00:00 grep --color=auto alertmanager

[root@prometheus ~]# ss -lntup | grep alertmanager
udp    UNCONN     0      0      [::]:9094               [::]:*                   users:(("alertmanager",pid=62950,fd=7))
tcp    LISTEN     0      128    [::]:9093               [::]:*                   users:(("alertmanager",pid=62950,fd=8))
tcp    LISTEN     0      128    [::]:9094               [::]:*                   users:(("alertmanager",pid=62950,fd=3))
Tips:kill该进程,下面还需要修改配置文件!
7.4 修改Alertmanager配置文件
修改/app/prometheus/alertmanager/alertmanager.yml配置文件(写到文件记得去掉注释)
global: #全局定义部分,配置发件人信息
  resolve_timeout: 5m                #dns解析的超时时间
  smtp_from: 'szgetshell@163.com'    #发件人
  smtp_smarthost: 'smtp.163.com:465' #smtp服务器
  smtp_hello: '163.com'
  smtp_auth_username: 'szgetshell@163.com' #邮箱名字
  smtp_auth_password: '授权码'
  smtp_require_tls: false

route:  #配置收件人间隔时间,收件方式
  group_by: ['alertname']
  group_wait: 30s  #group_wait 默认取值是 30s,它的作用是告诉 Alert Manager,当一个 Group 里面有 alert,且 Alert Manager 决定要发 notification 时,要等多久发送第一个 notification,也叫初始 notification。
  group_interval: 5m   #group_interval 的默认取值是 5m,Alert Manager 会每隔 5m 巡视一下 Group,看看是否需要发送 notification。
  repeat_interval: 1h  #重复告警时间(告警未解除,一个小时后会重新告警)
  receiver: 'email'    #采取邮箱告警(与下面要一致!)

receivers:
  - name: 'email'
    email_configs:
    - to: 'yinjay_chen@outlook.com'  #收件人
      send_resolved: true

inhibit_rules:
  - source_match:
      severity: 'critical'
    target_match:
      severity: 'warning'
    equal: ['alertname', 'dev', 'instance']

global:
  resolve_timeout: 5m
  smtp_from: 'szgetshell@163.com'
  smtp_smarthost: 'smtp.163.com:465'
  smtp_hello: '163.com'
  smtp_auth_username: 'szgetshell@163.com'
  smtp_auth_password: 'CEPSEDNXILDCTVTD'
  smtp_require_tls: false

route:
  group_by: ['alertname']
  group_wait: 30s
  group_interval: 5m
  repeat_interval: 1h
  receiver: 'email'

receivers:
  - name: 'email'
    email_configs:
    - to: 'yinjay_chen@outlook.com'
      send_resolved: true

inhibit_rules:
  - source_match:
      severity: 'critical'
    target_match:
      severity: 'warning'
    equal: ['alertname', 'dev', 'instance']
启动alertmanager
[root@prometheus ~]# alertmanager --config.file="/app/prometheus/alertmanager/alertmanager.yml" &>>/var/log/alertmanager.log &
[1] 67403

[root@prometheus prometheus]# ps -ef | grep alertmanager
root      67403  56433  0 09:50 pts/1    00:00:00 alertmanager --config.file=/app/prometheus/alertmanager/alertmanager.yml
root      67527  56433  0 09:54 pts/1    00:00:00 grep --color=auto alertmanager
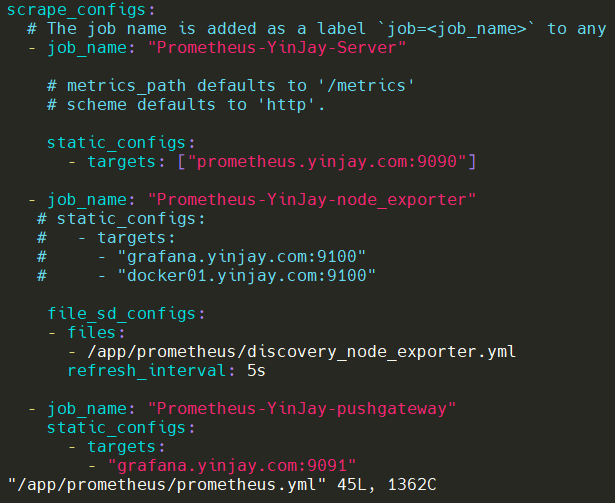
7.5 修改Prometheus配置文件
修改/app/prometheus/prometheus.yml配置文件(写到文件记得去掉注释)
[root@prometheus ~]# cat /app/prometheus/prometheus.yml
global:
  scrape_interval: 15s      #设置每15s采集数据一次
  evaluation_interval: 15s  #每15秒计算一次rule(规则)

alerting:
  alertmanagers:
    - static_configs:
        - targets:
          - "prometheus.yinjay.com:9093"

rule_files:
  - "/app/prometheus/prometheus_alert_rules.yml"

scrape_configs:
  - job_name: "Prometheus-YinJay-Server"
    static_configs:
      - targets: ["prometheus.yinjay.com:9090"]

  - job_name: "Prometheus-YinJay-node_exporter"
    file_sd_configs:
    - files:
      - /app/prometheus/discovery_node_exporter.yml
      refresh_interval: 5s

  - job_name: "Prometheus-YinJay-pushgateway"
    static_configs:
      - targets:
        - "grafana.yinjay.com:9091"
7.6 配置rule文件
修改/app/prometheus/prometheus_alert_rules.yml配置文件(写到文件记得去掉注释)
groups: #组告警
- name: check_node_exporter #组名,告警规则组名称
  rules:
  - alert: check_node_is_up #告警名称
    expr: up{job="Prometheus-YinJay-node_exporter"} == 0 #告警规则表达式
    for: 15s #持续时间。 表示持续15秒获取不到信息,则触发报警,0表示不使用持续时间。

    labels:
      severity: warning #指定告警级别

    annotations:
      summary: " {{ $labels.instance }} 节点停止运行超过15s!!!"
重启prometheus
[root@prometheus ~]# systemctl restart prometheus
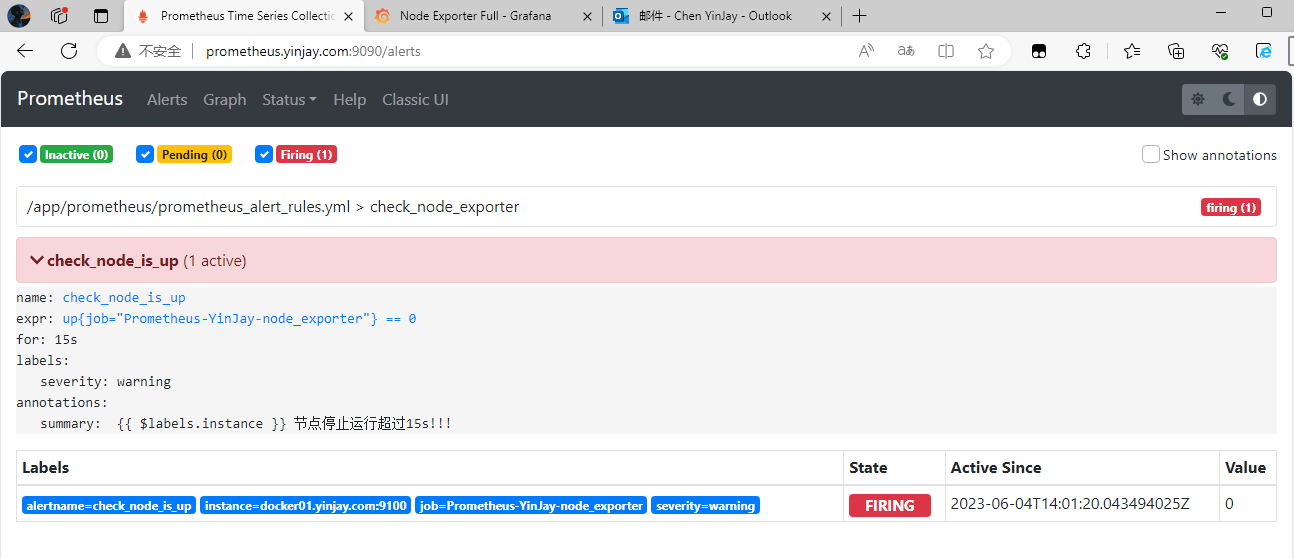
7.7 告警测试
在Prometheus上已经有了告警规则的检测
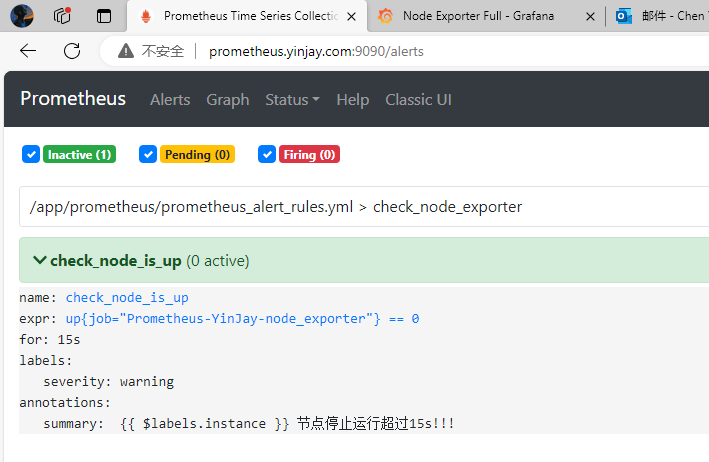
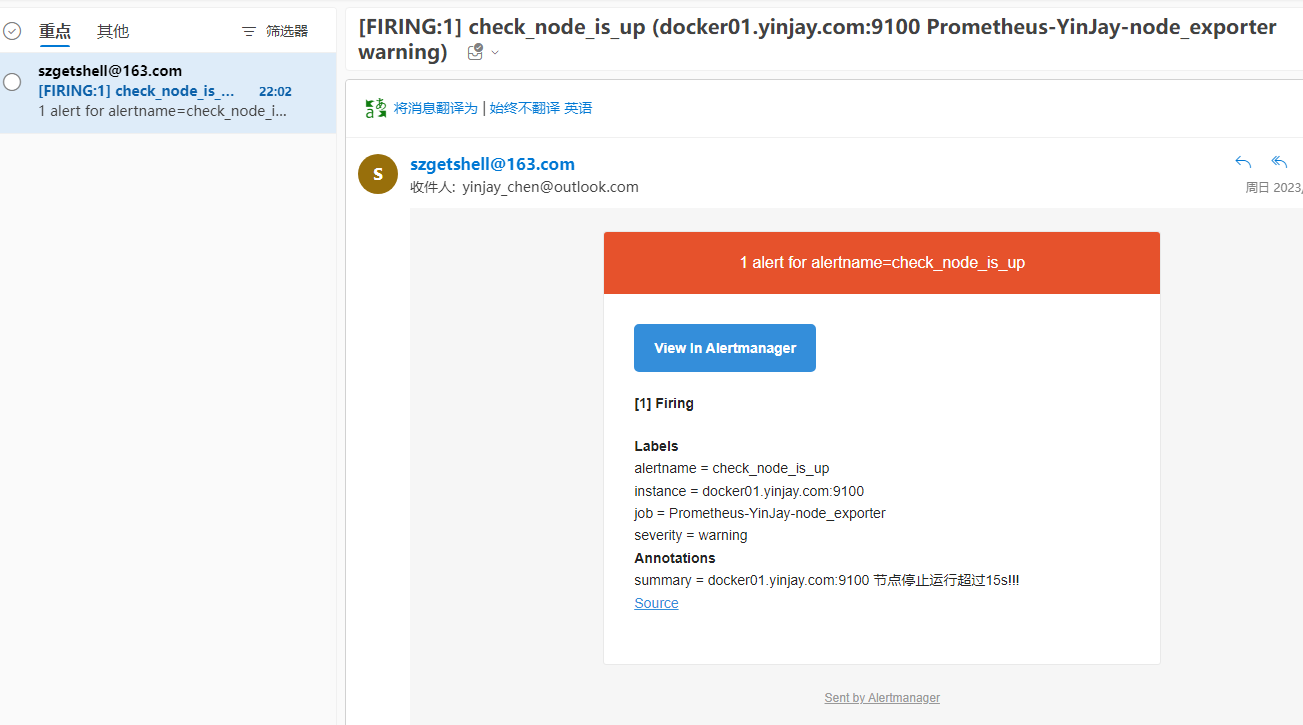
现在将Prometheus-YinJay-node_exporter这个组下的docker01主机上的exporter停止,模拟宕机,已经出现告警并发送邮件告警。

 浙公网安备 33010602011771号