
数据质量分析
本文对读取的csv文件,进行了求最大值、最小值、平均值、空值,最后绘制了箱式图。
1、读取csv文件
import numpy as np
import pandas as pd
data = pd.read_csv('catering_sale.csv')
data
| 日期 | 销量 | |
|---|---|---|
| 0 | 2015-03-01 | 51.0 |
| 1 | 2015-02-28 | 2618.2 |
| 2 | 2015-02-27 | 2608.4 |
| 3 | 2015-02-26 | 2651.9 |
| 4 | 2015-02-25 | 3442.1 |
| 5 | 2015-02-24 | 3393.1 |
| 6 | 2015-02-23 | 3136.6 |
| 7 | 2015-02-22 | 3744.1 |
| 8 | 2015-02-21 | 6607.4 |
| 9 | 2015-02-20 | 4060.3 |
| 10 | 2015-02-19 | 3614.7 |
| 11 | 2015-02-18 | 3295.5 |
| 12 | 2015-02-16 | 2332.1 |
| 13 | 2015-02-15 | 2699.3 |
| 14 | 2015-02-14 | NaN |
| 15 | 2015-02-13 | 3036.8 |
2、求最大、最小、均值
print('Max:')
data.max()

Max:
日期    2015-03-01
销量       9106.44
dtype: object

print('Min:')
data.min()

Min:
日期    2014-08-02
销量            22
dtype: object

print('平均值:')
data.mean()

平均值:
销量    2755.2147
dtype: float64
3、求缺失值
找不到直接计算空值行数的方法
利用加减法计算缺失值个数及缺失率
1. 先用count()计算出行数(列非空值的行数); count(axis=1)是计算列数的. 默认axis=0
2. shape[0]计算出总行数
data.isnull()
data['销量'].isnull()
data.info()
missing_value = data['销量'].shape[0] -  data['销量'].count()
missing_rate = missing_value/data['销量'].shape[0]
print("missing_value = %d"%missing_value)
print('missing_rate = {}'.format(missing_rate))

<class 'pandas.core.frame.DataFrame'>
RangeIndex: 201 entries, 0 to 200
Data columns (total 2 columns):
日期    201 non-null object
销量    200 non-null float64
dtypes: float64(1), object(1)
memory usage: 3.2+ KB
missing_value = 1
missing_rate = 0.004975124378109453
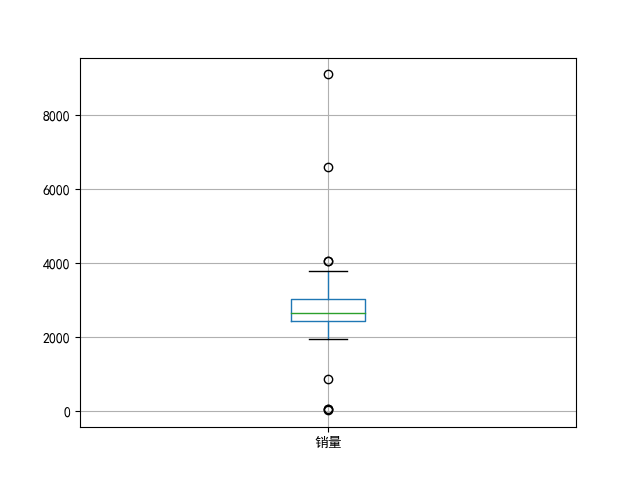
4、箱式图
%matplotlib notebook
import pandas as pd
import matplotlib.pyplot as plt
import numpy as np
df = pd.read_csv('catering_sale.csv')
# df.fillna(value=df.mean(),inplace=True)
#解决中文乱码
plt.rcParams['font.sans-serif']=[u'SimHei']
plt.rcParams['axes.unicode_minus']=False
fig,axes=plt.subplots()
# df.boxplot(column='销量',by=['日期','销量'],ax=axes)
df.boxplot(column='销量',ax=axes)
axes.set_ylable('values of tip_pct')
fig.savefig('p3.png')
以上为全部实现过程,如有问题,欢迎讨论。

 浙公网安备 33010602011771号