

Web app ------ 从Servlet读取Json数据并显示,生成历史数据曲线图
1、我的Servlet端
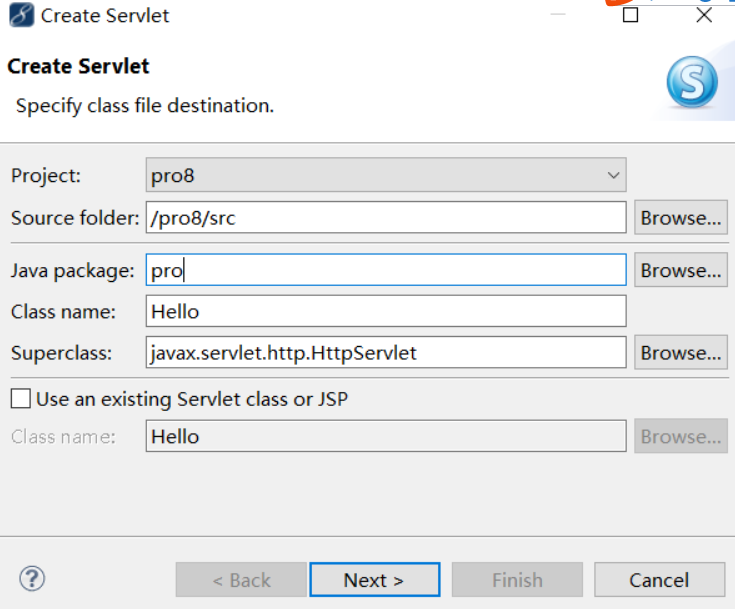
创建Servlet;
导入需要的jar包;
接收到客户端的请求;
数据类;
从数据库的读取数据并存入链表;
转成Json格式返回给客户端;
(1)创建Servlet
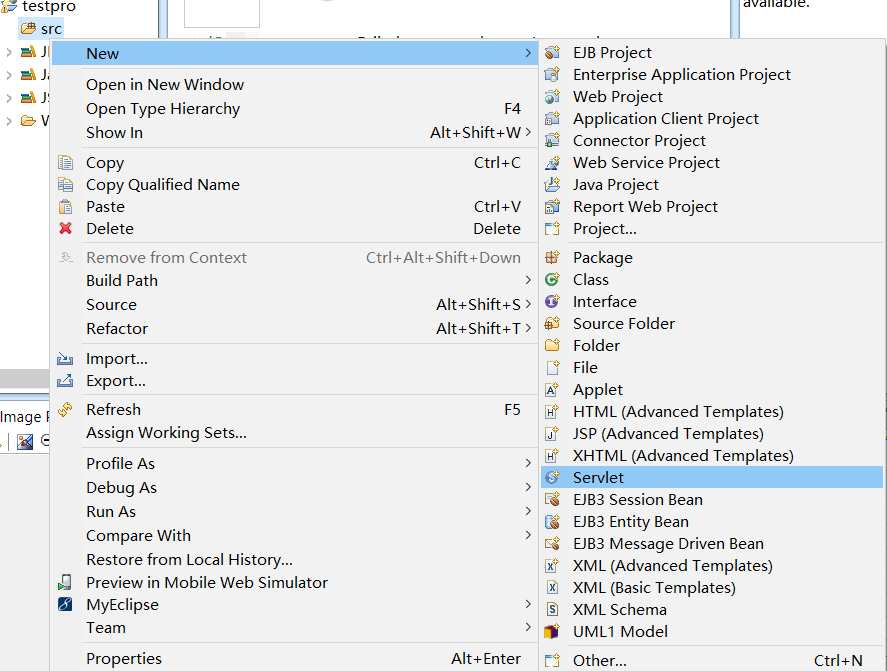
参考:https://www.cnblogs.com/alsf/p/9180976.html
(2)导入需要的jar包
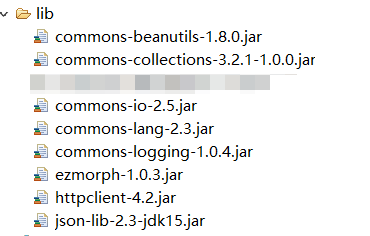
下载网址:http://www.java2s.com/Code/Jar/j/Catalogj.htm
(3)接收到客户端的请求
String sID = request.getParameter("sID");//sID
对应的客户端请求代码:$.ajax({...data:"sID="+sID,...});
(4)数据类
package pro8;
public class Temp_Data {
private String sDateTime;
private float sValue;
public Temp_Data() {}
public Temp_Data(String time, float value) {
sDateTime=time;
sValue=value;
}
public void setTime(String time) {
sDateTime=time;
}
public void setValue(float value) {
sValue=value;
}
public String getTime() {
return sDateTime;
}
public float getValue() {
return sValue;
}
}
(5)从数据库的读取数据并存入链表
参考的是菜鸟教程的代码:https://www.runoob.com/servlet/servlet-database-access.html
包括:①数据库加载驱动②数据库连接③数据库查询④返回结果并存入链表
public class Hello extends HttpServlet {
// JDBC 驱动名及数据库 URL
static final String JDBC_DRIVER = "com.mysql.jdbc.Driver";
static final String DB_URL = "jdbc:mysql://localhost:3306/project1";
// 数据库的用户名与密码,需要根据自己的设置
static final String USER = "root";
static final String PASS = "123456";
public void doPost(HttpServletRequest request, HttpServletResponse response)
throws ServletException, IOException {
Connection conn = null;
java.sql.Statement stmt = null;
/*...接收到客户端的请求...*/
try{
/*①数据库加载驱动*/
// 注册 JDBC 驱动器
Class.forName(JDBC_DRIVER);
/*②数据库连接*/
conn = DriverManager.getConnection(DB_URL,USER,PASS);
/*③数据库查询*/
stmt = conn.createStatement();
String sql;
sql = "select sDateTime,sValue from table1 where sID = '"+sID+"'"+"ORDER BY sDateTime ASC";
System.out.print(sID);
ResultSet rs = stmt.executeQuery(sql);
//这里是链表
List<Temp_Data> templist=new ArrayList<Temp_Data>();
/*④返回结果并存入链表*/
while(rs.next()){
// 通过字段检索
String time = rs.getString("sDateTime");
float value = rs.getFloat("sValue");
Temp_Data temp=new Temp_Data(time,value);
templist.add(temp);
}
//out.print(sID);
/*...转成Json格式返回给客户端...*/
//System.out.println("array--->"+jarray);
// 完成后关闭
rs.close();
stmt.close();
conn.close();
} catch(SQLException se) {
// 处理 JDBC 错误
se.printStackTrace();
} catch(Exception e) {
// 处理 Class.forName 错误
e.printStackTrace();
}finally{
// 最后是用于关闭资源的块
try{
if(stmt!=null)
stmt.close();
}catch(SQLException se2){
}
try{
if(conn!=null)
conn.close();
}catch(SQLException se){
se.printStackTrace();
}
}
}
}
(6)转成Json格式返回给客户端
JSONArray jarray=JSONArray.fromObject(templist);
out.print(jarray);
2、客户端代码
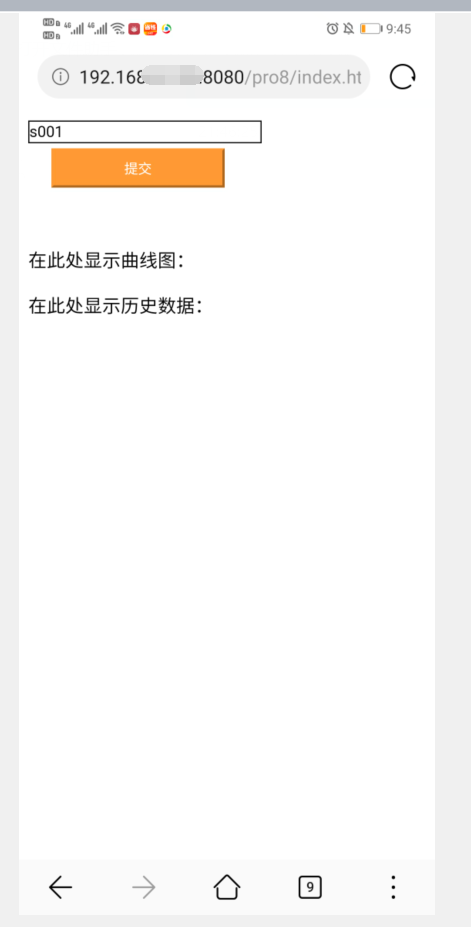
(1)界面部分
<body>
<form action="" method="post" style="height: 92px; ">
<input type="text" name="sID" id="sID" value="s001">
<br><input type="button" name="btn" id="btn" value="提交" onClick="test();" style="height: 34px; ">
</form>
<p>在此处显示曲线图:</p>
<div id="curve" >
</div>
<p>在此处显示历史数据:</p>
<div id="hisData" >
</div>
</body>
</html>
(2)简单的css样式
<style type="text/css">
#sID{
      border:1px solid #000;
      float:left;
      width: 200px;
      position: fixed;
}
#btn{
      font-size: 12px;
      color: #FFF;
      background-color: #F93;
      height: 20px;
      width: 150px;
      margin-top: 5px;
      margin-left: 20px;
      border-top-color: #F93;
      border-right-color: #F93;
  border-bottom-color: #F93;
      border-left-color: #F93;
}
p{
      font-size: 16px;
}
</style>
(3)发送请求给服务器
<!DOCTYPE HTML>
<html>
<head>
<meta content="width=device-width,user-scalable=no" name="viewport">
<meta http-equiv="Content-Type" content="text/html; charset=utf-8" />
<script type="text/javascript" src="JS/jquery-3.4.1.min.js"></script>
<script src="JS/jquery-1.11.0.min.js" type="text/javascript"></script>
<script type="text/javascript">
    function test(){
     var sID=document.getElementById("sID").value;
         $.ajax({
                type:"POST",
                url:"Hello",
                data:"sID="+sID,
                dataType: 'json',
               success:function(msg){
                },
error:function(){
alert("error");
}
            });
  }
</script>
</head>
(4)解析返回的Json数据,并将Time和Value存入x,y数组
var temp=JSON.stringify(msg);
$("#hisData").html(temp);
var arr=JSON.parse(temp);
var x = [];
var y = [];
for (var i = 0; i < arr.length; i++) {
  x[i] = arr[i]['time'];
  y[i] = parseFloat(arr[i]['value']);
  console.log(y[i]);
}
(5)绘制曲线图
参考:https://www.highcharts.com.cn/demo/highcharts/spline-plot-bands
var chart = Highcharts.chart('curve', {
chart: {
      type: 'spline'//类型为曲线
},
title: {
      text: '温度变化历史数据'
},
subtitle: {
      text: '传感器'
},
xAxis: {
      categories: x//X轴数据
},
yAxis: {
  title: {
        text: '温度 (℃)'
      },
      min: 0,
      minorGridLineWidth: 0,
      gridLineWidth: 0,
      alternateGridColor: null,
},
tooltip: {
      valueSuffix: ' ℃'
},
plotOptions: {
      spline: {
        lineWidth: 4,
        states: {
      hover: {
        lineWidth: 5
      }
},
marker: {
      enabled: false
}
}
},
series: [{
      name: '温度',
      data: y//Y轴数据
}],
navigation: {
      menuItemStyle: {
      fontSize: '10px'
}
}
});
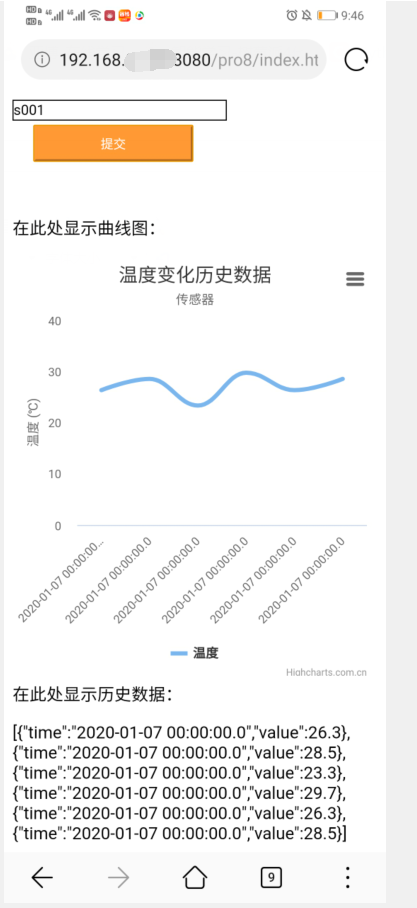
3、运行效果图
4、创建Servlet遇到的问题
(1)工作空间不能与发布目录相同,之前无意中改了工作目录,导致运行后文件丢时。
解决方法:修改工作空间
(2)出现404错误:路径错误
解决方法:检查路径,web.xml下的路径和url
(3)出现500错误:导入的包有问题

 浙公网安备 33010602011771号