Echarts 在地图上绘制流向图
首先需要获取地图JSON数据包,点此下载(Echarts官方地图数据,包含世界、中国,及国内各省数据)。
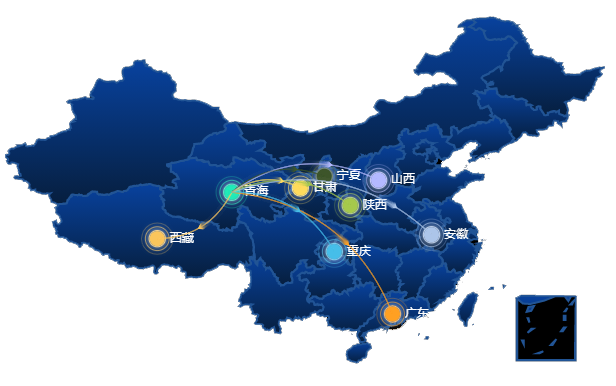
实现效果如图:
代码如下:
$.getJSON('./mapjson/china.json', function(china)
{
    echarts.registerMap('china', china);

    var myChart = echarts.init(document.getElementById('map'));
    myChart.showLoading(
    {
        text: '加载中...',
        color: '#c23531',
        fontSize: '28px',
        textColor: '#000',
        maskColor: 'rgba(255, 255, 255, 0.2)',
        zlevel: 0,
    });

    var scale = 1;

    var geoCoordMap = {};
    echarts.util.each(china.features, function(dataItem, idx)
    {
        geoCoordMap[dataItem.properties.name] = dataItem.properties.cp;
    });

    var mapData =
    [
        {from: '青海', to: '青海', value: 90, color: '#1DE9B6'},
        {from: '青海', to: '安徽', value: 80, color: '#ACC5E9'},
        {from: '青海', to: '甘肃', value: 70, color: '#FFDB5C'},
        {from: '青海', to: '宁夏', value: 60, color: '#3D552A'},
        {from: '青海', to: '山西', value: 50, color: '#B4B9FF'},
        {from: '青海', to: '陕西', value: 40, color: '#A6C84C'},
        {from: '青海', to: '广东', value: 30, color: '#FFA022'},
        {from: '青海', to: '重庆', value: 20, color: '#46BEE9'},
        {from: '青海', to: '西藏', value: 10, color: '#FAC55C'}
    ];

    var convertLineData = function(data)
    {
        var res = [];

        for(var i = 0; i < data.length; i++)
        {
            var dataItem = data[i];
            var fromCoord = geoCoordMap[dataItem.from];
            var toCoord = geoCoordMap[dataItem.to];

            if(fromCoord && toCoord)
            {
                res.push(
                {
                    fromName: dataItem.from,
                    toName: dataItem.to,
                    coords: [fromCoord, toCoord],
                    value: dataItem.value,
                    color: dataItem.color
                });
            }
        }

        return res;
    };

    var convertPointData = function(data)
    {
        var res = [];

        for(var i = 0; i < data.length; i++)
        {
            var dataItem = data[i];
            var toCoord = geoCoordMap[dataItem.to];

            if(toCoord)
            {
                res.push(
                {
                    name: dataItem.to,
                    value: toCoord,
                    count: dataItem.value,
                    color: dataItem.color
                });
            }
        }

        return res;
    }

    var option =
    {
        tooltip:
        {
            trigger: 'item',
            axisPointer:
            {
                type: 'shadow'
            },
            textStyle:
            {
                fontSize: 12 * scale,
            },
            formatter: function(params)
            {
                let returnStr = '';

                if(params.componentSubType == 'effectScatter')
                {
                    returnStr += params.marker;
                    returnStr += params.name + ':' + params.data.count;
                }
                else if(params.componentSubType == 'lines')
                {
                    returnStr += params.marker;
                    returnStr += params.data.fromName + ' -> ' + params.data.toName;
                    returnStr += ':' + params.data.value;
                }

                return returnStr;
            }
        },
        geo:
        {
            map: 'china',
            aspectScale: 1,
            zoom: 1.25,
            label:
            {
                normal:
                {
                    show: false,
                },
                emphasis:
                {
                    show: true,
                    fontSize: 12 * scale,
                    color:"#fff"
                }
            },
            itemStyle:
            {
                normal:
                {
                    areaColor:
                    {
                        x: 0, y: 0, x2: 0, y2: 1,
                        colorStops:
                        [
                            {
                                offset: 0,
                                color: '#08429F'
                            },
                            {
                                offset: 1,
                                color: '#061E3D'
                            },
                        ],
                    },
                    borderColor: '#215495',
                    borderWidth: 2 * scale,
                },
                emphasis:
                {
                    areaColor:
                    {
                        x: 0, y: 0, x2: 0, y2: 1,
                        colorStops:
                        [
                            {
                                offset: 0,
                                color: '#084DBC'
                            },
                            {
                                offset: 1,
                                color: '#092F5E'
                            },
                        ],
                    },
                }
            },
        },
        series:
        [
            {
                type: 'effectScatter',
                coordinateSystem: 'geo',
                data: convertPointData(mapData),
                symbolSize: 15 * scale,
                showEffectOn: 'render',
                rippleEffect:
                {
                    brushType: 'stroke'
                },
                hoverAnimation: true,
                label:
                {
                    normal:
                    {
                        show: true,
                        formatter: function(param)
                        {
                            return param.data.name;
                        },
                        position: 'right',
                        fontSize: 12 * scale,
                        color: '#fff',
                    }
                },
                itemStyle:
                {
                    normal:
                    {
                        color: function(param)
                        {
                            return param.data.color;
                        },
                        shadowBlur: 10,
                        shadowColor: '#fff'
                    }
                },
                zlevel: 1
            },
            {
                type: 'lines',
                zlevel: 2,
                effect:
                {
                    show: true,
                    period: 5,
                    trailLength: 0.2,
                    symbol: 'arrow',
                    symbolSize: 4 * scale,
                },
                lineStyle:
                {
                    normal:
                    {
                        color: function(param)
                        {
                            return param.data.color;
                        },
                        width: 1 * scale,
                        opacity: 0.2,
                        curveness: .3
                    }
                },
                data: convertLineData(mapData)
            },
        ]
    };

    myChart.hideLoading();
    myChart.setOption(option, true);
    myChart.resize();
})
欢迎转载,转载时请注明来源。

 浙公网安备 33010602011771号