【python-opencv】15-图像阈值
【微语】立志要如山,行道要如水。不如山,不能坚定,不如水,不能曲达
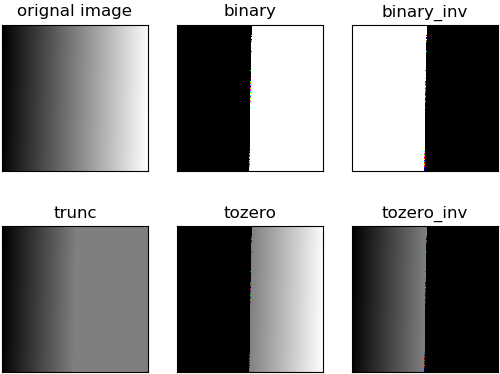
 1 import cv2 as cv
 2 import numpy as np
 3 from matplotlib import pyplot as plt
 4
 5 img = cv.imread(r'pictures\gradient.png')
 6 h , w ,ch = img.shape
 7
 8 ret , thresh1 = cv.threshold(img,127,255,cv.THRESH_BINARY)
 9 ret , thresh2 = cv.threshold(img,127,255,cv.THRESH_BINARY_INV)
10 ret , thresh3 = cv.threshold(img,127,255,cv.THRESH_TRUNC)
11 ret , thresh4 = cv.threshold(img,127,255,cv.THRESH_TOZERO)
12 ret , thresh5 = cv.threshold(img,127,255,cv.THRESH_TOZERO_INV)
13
14 titles = ['orignal image','binary','binary_inv','trunc','tozero','tozero_inv']
15 images = [img,thresh1,thresh2,thresh3,thresh4,thresh5]
16
17 for i in range(len(images)):
18     plt.subplot(2,3,i+1),plt.imshow(images[i])
19     plt.title(titles[i])
20     plt.xticks(())
21     plt.yticks(())      #隐藏y轴
22
23 plt.show()

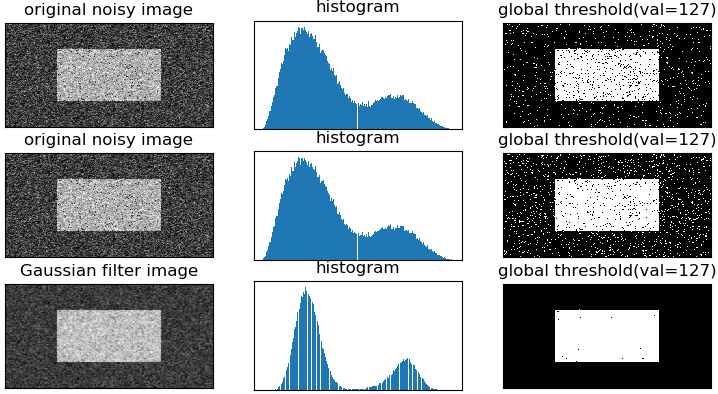
import cv2 as cv
import numpy as np
from matplotlib import pyplot as plt

img = cv.imread(r'pictures\noisy2.png')
gray = cv.cvtColor(img,cv.COLOR_BGR2GRAY)

#global thresholding
ret1,binary1 = cv.threshold(gray,127,255,cv.THRESH_BINARY)
#Otsu's thresholding
ret2,binary2 = cv.threshold(gray,0,255,cv.THRESH_BINARY+cv.THRESH_OTSU)
#Otsu's thresholding after Gaussian filtering
blur = cv.GaussianBlur(gray,(5,5),0)
ret3,binary3 = cv.threshold(blur,0,255,cv.THRESH_BINARY+cv.THRESH_OTSU)
# cv.imshow('binary1',binary1)
# cv.imshow('binary2',binary2)
# cv.imshow('blur',blur)
# cv.imshow('binary3',binary3)
#Plot all the images and their histograms
images = [img,0,binary1,
          img,0,binary2,
          blur,0,binary3]
titles = ['original noisy image','histogram','global threshold(val=127)',
          'original noisy image','histogram',"Otsu's threshold",
          'Gaussian filter image','histogram',"Otsu's threshold(Gaussian)"]
"""
使用pyplot中画直方图的方法plt.hist(),注意它的参数是一维数组
故使用numpy的ravel()方法或者flatten()方法, 将多维数组转为一维数组
#for循环每次打印出一行3幅图
"""
for i in range(3):
    plt.subplot(3,3,i*3+1),plt.imshow(images[i*3],'gray')    #plt,imshow(img,'gray') 灰度图
    plt.title(titles[i*3]),plt.xticks(()),plt.yticks(())

    plt.subplot(3,3,i*3+2),plt.hist(images[i*3].flatten(),256)
    plt.title(titles[1]),plt.xticks(()),plt.yticks(())

    plt.subplot(3,3,i*3+3),plt.imshow(images[i*3+2],'gray')
    plt.title(titles[2]),plt.xticks(()),plt.yticks(())


plt.show()

 浙公网安备 33010602011771号