HighCharts中几种tooltip的显示格式
推荐学习地址 => https://www.hcharts.cn/docs/basic-tooltip
https://api.hcharts.cn/#Highcharts.numberFormat
这里给出两个常用的例子
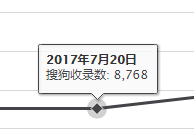
1.折线图横坐标为时间轴时,想显示成

.ts中相关highcharts配置:
 1             $scope.overviewChart = <HighChartsNGConfig>{
 2                 options: {
 3                     title: {
 4                         text: ``
 5                     },
 6                     chart: {
 7                         type: 'line'
 8                     },
 9                     yAxis: {
10                         min: 0,
11                         title: { text: null },
12                         labels: {
13                             formatter: function () {
14                                 return this.value + "%";
15                             }
16                         }
17                     },
18                     xAxis: {
19                         type: "datetime",
20                         dateTimeLabelFormats: {
21                             day: '%b/%e',
22                             month: '%y年%b月',
23                             week: '%b/%e',
24                             year: '%Y年',
25                             millisecond: '%b/%e',
26                         }
27                         // dateTimeLabelFormats: { // don't display the dummy year
28                         //     month: '%e. %b',
29                         //     year: '%b'
30                         // },
31                     },
32                     tooltip: {
33                         formatter: function () {
34                             var d = new Date(this.x);
35                             var s = '<b>' + d.getFullYear() + '年' + (d.getMonth() + 1) + '月' + d.getDate() + '日' + '</b>';
36                             s += '<br/><span style="color:' + this.point.series.color + '">' + this.point.series.name + ': ' +
37                                 this.point.y.toFixed(2) + '%' + ' </span>';
38                             return s;
39                         }
40                     },
41                     legend: {
42                         enabled: true
43                     },
44                 },
45             }
2. tootip想把数字显示成带有千位符号的,如这样:
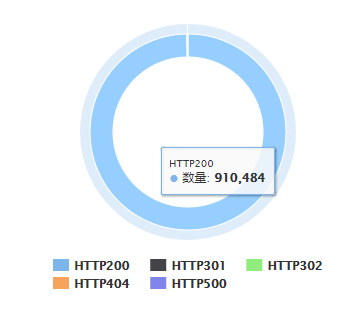
饼图的配置代码
 1             //图中数字显示成带千位符号的
 2             Highcharts.setOptions({
 3                 lang: {
 4                     thousandsSep: ','
 5                 }
 6             });
 7             //http code概念饼图
 8             $scope.pieChart = <HighChartsNGConfig>{
 9                 options: {
10                     title: {
11                         text: ``
12                     },
13                     chart: {
14                         type: 'pie',
15                         height: 300,
16                     },
17                     tooltip: {
18                         // headerFormat: '{point.name}<br>',
19                         // pointFormat: '{series.name}: <b>{point.y}%</b>'
20                     },
21                     plotOptions: {
22                         pie: {
23                             innerSize: 150,
24                             allowPointSelect: true,
25                             cursor: 'pointer',
26                             dataLabels: {
27                                 enabled: false,
28                             },
29                             showInLegend: true
30                         }
31                     },
32                 },
33                 loading: false
34             };

 浙公网安备 33010602011771号