Vue-Echarts(图表)
封装代码:
<!--
    * @Descripttion:图表组件
 -->
<template>
  <div class='YxkEcharts'>
    <VEcharts :params="echartsObj"></VEcharts>
  </div>
</template>

<script>
  // 图表
  const VEcharts = {
    props: {
      params: {
        type: Object
      }
    },
    render(createElement) {
      const createNode = params => {
        // 元素
        let ele = `ve-${params.type || 'line'}`
        // 参数
        let props = {
          attrs: {
            ...params
          }
        }
        if (!params.data.rows.length) {
          props.attrs['data-empty'] = true
        }
        // 子级
        let childNodes = []
        return createElement(ele, props, childNodes)
      }
      return createNode(this.params)
    },
  }
  export default {
    name: 'YxkEcharts',
    componentName: 'YxkEcharts',
    props: {
      echartsObj: {
        type: Object,
        default: () => {
          return {}
        }
      }
    },
    components: {
      VEcharts
    },
    data() {
      return {}
    },
    methods: {},
    computed: {},
    watch: {},
    created() {},
    mounted() {}
  }
</script>

<style lang='scss'>
  .YxkEcharts{
    position: relative;
    background: #fff;
    padding: 20px;
    .v-charts-data-empty{
      position: absolute;
      top: 0;
      left: 0;
      width: 100%;
      height: 100%;
      display: flex;
      align-items: center;
      justify-content: center;
    }
  }
</style>
// 插件 echarts v-charts
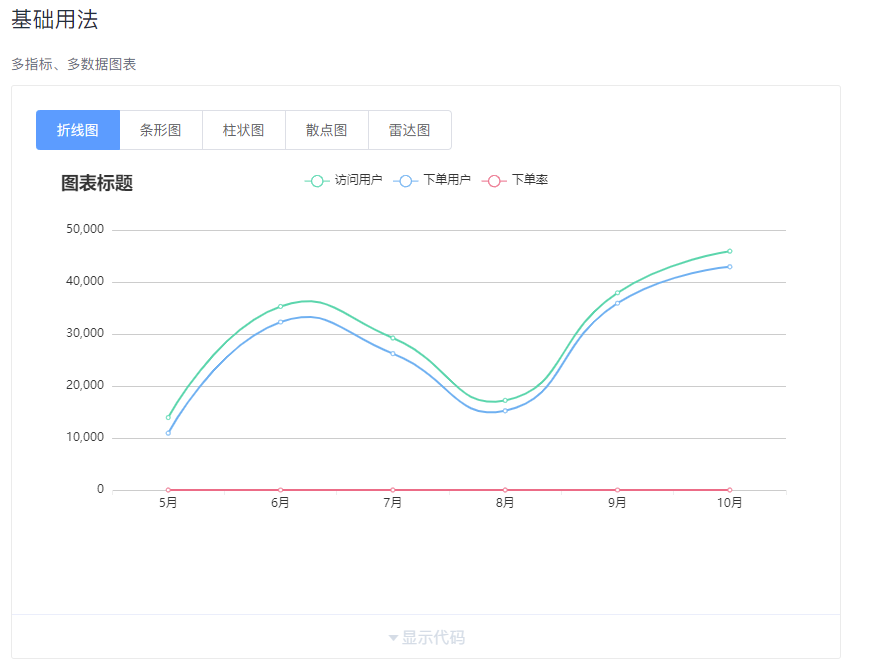
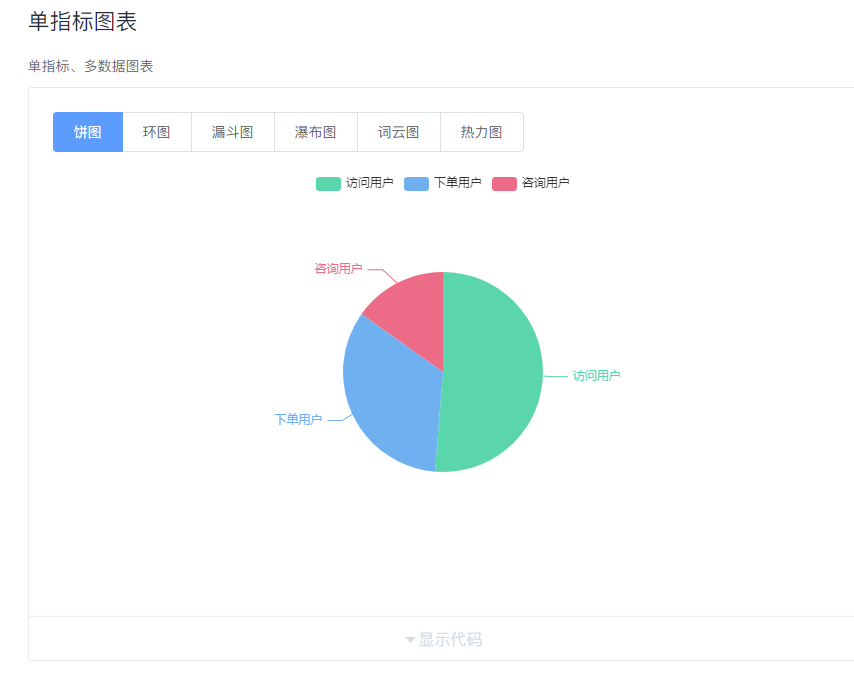
示例:
参数说明:
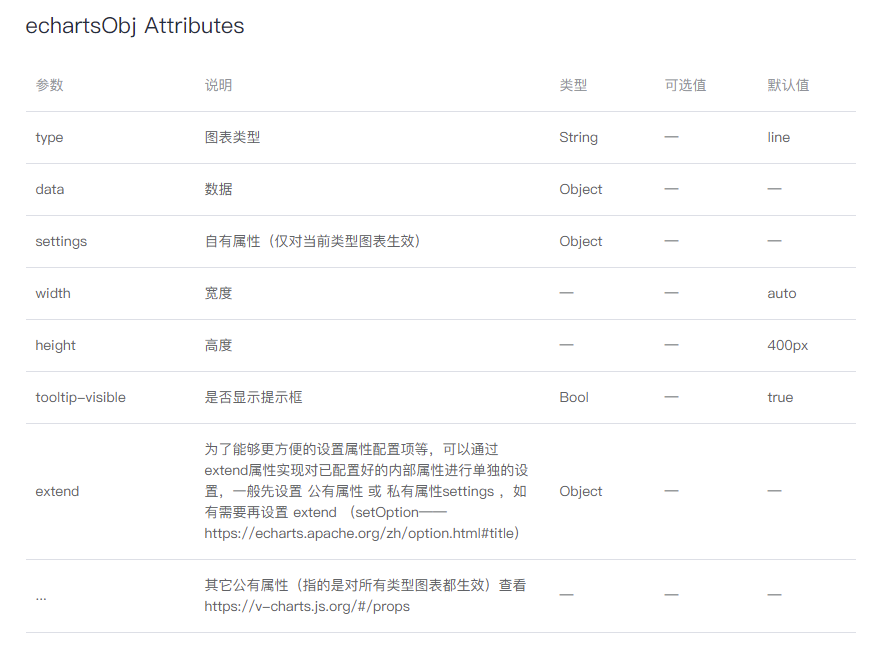


extend (setOption——https://echarts.apache.org/zh/option.html#title)
公有属性(指的是对所有类型图表都生效)查看 https://v-charts.js.org/#/props

 浙公网安备 33010602011771号