
Prometheus
Prometheus:
简介:
是一款优秀的监控工具,准确来说,应该是监控方案,Prometheus提供了监控数据搜集、存储、处理、可视化和告警一套完整的解决方案。
组件:
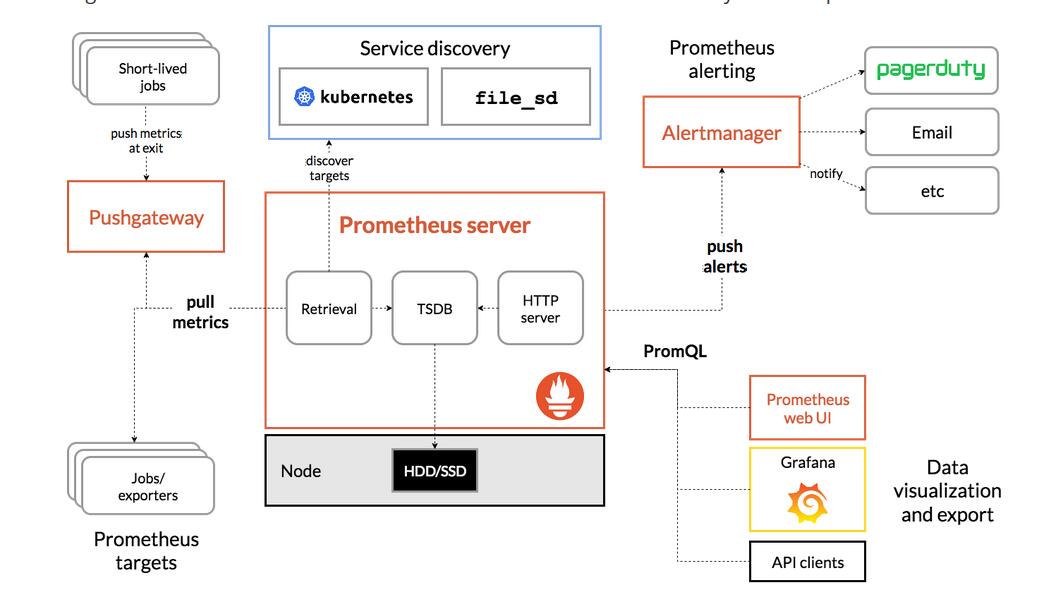
1.Prometheus Server
Prometheus Server负责从Exporter拉取和存储监控数据,并提供一套灵活的查询语言(PromQL)供用户使用
2.Exporter
Exporter负责收集目标对象(host、container等)的性能数据,并通过http接口供Prometheus Server获取
3.可视化组件
Grafana能够与Prometheus无缝集成,提供完美的数据展示能力
4.Altermanager
用户可以定义基于监控数据的告警规则,规则会触发告警。一旦Altermanager收到告警,会通过预定义的方式发出告警通知
架构:
优点:
Prometheus最大的亮点和先进性来自于它的多维数据模型
最适合prometheus的场景就是采集时间序列(ts)数据的场合,Prometheus具有很大的查询优势,此外也适用于微服务的体系架构
缺点:
由于采集数据可能会丢失,所以prometheus不适合对采集数据要100%准确的情形
与zabbix相比较,其优势在哪儿?
1.可以监控的agent更多
2.占用的资源更少
Prometheus数据结构:
指标(notation(metric(监控对象)+labels(不同维度的描述(key=value)))+samples(数据+时间戳)
Prometheus按照时间序列存储指标,每个指标都由Notation + Samples组成
Notation:也就是时间序列
是由metric的名字和一系列的标签(键值对)唯一标识的,不同的标签则代表不同的时间序列
metric名字:
该名字应该具有语义,一般用于表示metric的功能
metric名字由ASCII字符、数字、下划线以及冒号组成,且必须满足正则表达式[a-zA-Z_:][a-zA-Z0-9_:]*
例如:
http_requests_total:表示http请求的总数
标签:
使同一个时间序列有了不同维度的识别
标签中的键由ASCII字符、数字、下划线以及冒号组成,且必须满足正则表达式[a-zA-Z_:][a-zA-Z0-9_:]*
例如:
http_requests_total{method="Get"}:表示所有http请求中的Get请求,当method="post"时,则为一个新的metric
Samples(样品):
实际的时间序列,通常包含一个64位的浮点数和一个毫秒级的时间戳
例如:
http_requests_total{method="POST",endpoint="/api/tracks"}
四种Metric类型
1、counter:一种累加的metric,典型的应用如:请求的个数,结束的任务数,出现的错误数等
例如:
查询http_requests_total{method="Get",job="Prometheus",handler="query"}
返回8,经过10秒后再次查询,则返回14
2、Gauge(计量):一种常规的metric,典型的应用如:温度,运行的goroutines的个数等,可以任意加减
例如:
go_goroutines{instance="192.168.1.101",job="Prometheus"}
返回值147,经过10秒返回124
3、Histogram(柱状图):典型的应用如:请求持续时间,响应大小,可对观察结果采样,分组及统计
例如:
查询http_request_duration_microseconds_sum{job="Prometheus",handler="query"}时,返回结果图
4、Summary(类似于Histogram):典型应用如:请求持续时间,响应大小。提供观测值的count和sum功能,提供百分位的功能,既可以按百分比划分跟踪结果
instance和jobs:
instance:一个单独scrape(抓取)的目标,一般对应于一个进程
jobs:一组同种类型的instances(主要用于保证可扩展性和可靠性)
例如:
job: api-server
instance 1:192.168.1.21:5670
instance 2:192.168.1.22:5671
instance 3:192.168.1.23:5670
时间同步:
安装Prometheus之前,必须先安装ntp时间同步服务器
Prometheus T_S对系统时间的准确性要求很高,必须保证本机时间实时同步
配置ntp服务器
修改配置文件:vim /etc/ntp.conf ## 注释原有的server,追加以下两行
server 127.127.1.0
fudge 127.127.1.0 stratum 8
重启服务:systemctl restart ntpd
在exporter端设置任务计划,定时同步时间:
* * * * * /usr/sbin/ntpdate 192.168.1.250
Prometheus安装:
官网下载最新版本:https://prometheus.io
安装:
tar xf prometheus-2.19.2.linux-amd64.tar.gz
cp -rf prometheus-2.19.2.linux-amd64 /usr/local/prometheus
启动:默认运行在9090端口
cd /usr/local/prometheus
./prometheus
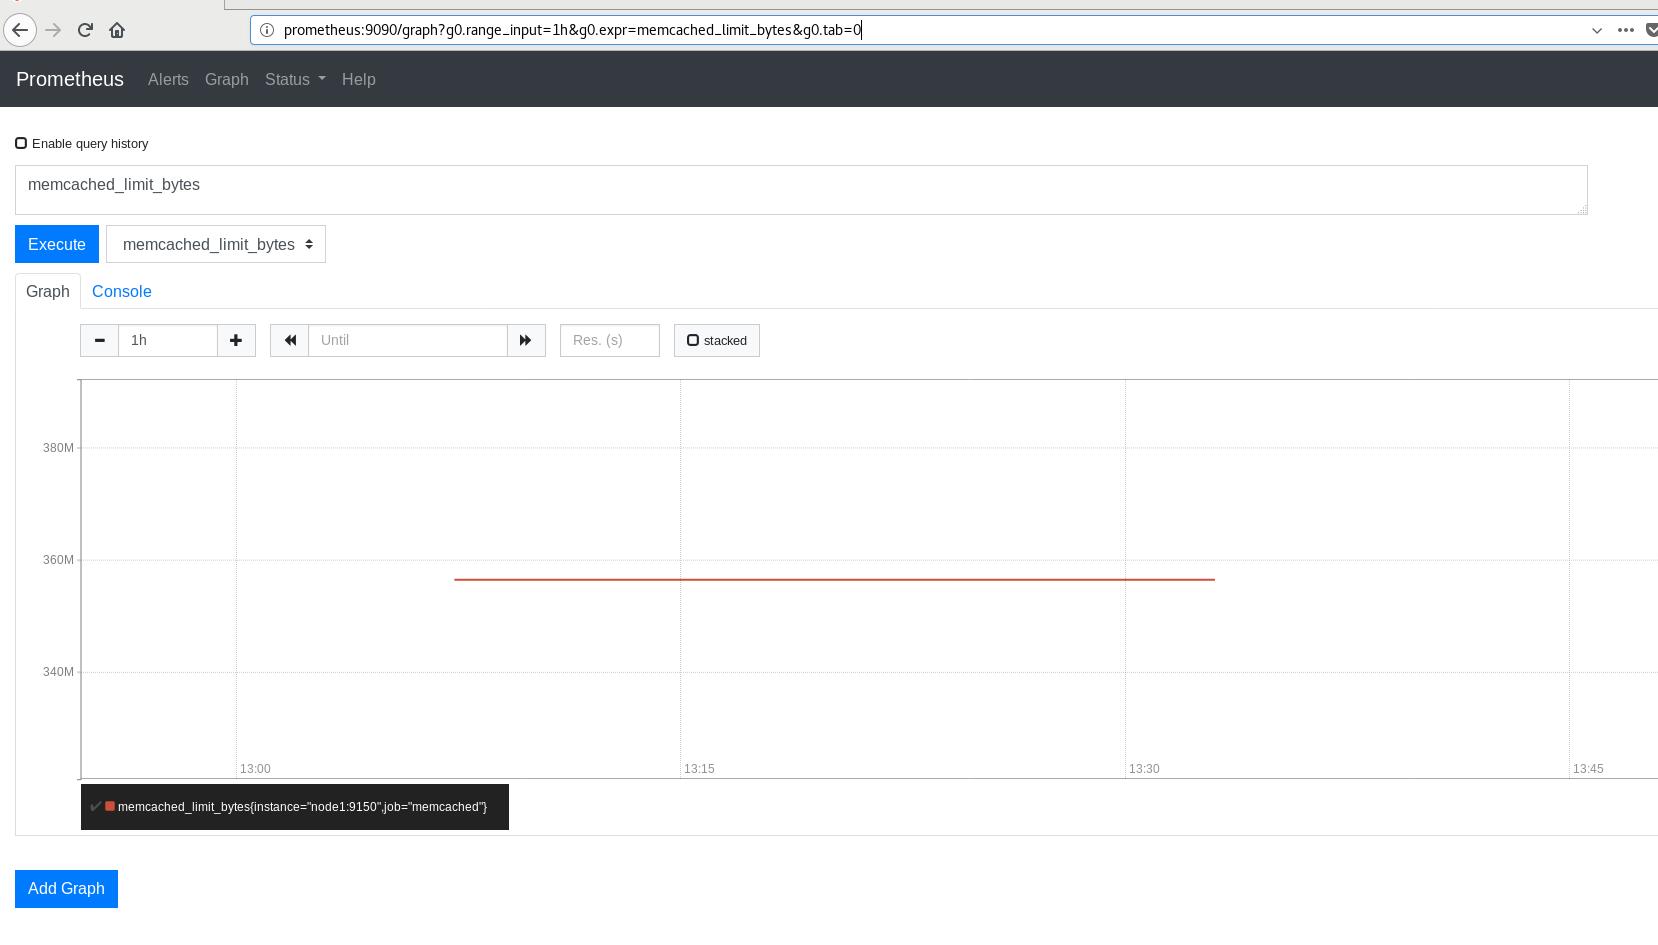
访问:
浏览器可以直接打开访问http://prometheus:9090
Prometheus主配置文件:prometheus.yml
cd /usr/local/prometheus
ls
console_libraries consoles data LICENSE NOTICE
prometheus prometheus.yml promtool tsdb
cat prometheus.yml
# my global config # 全局配置
global:
scrape_interval: 15s # Set the scrape interval to every 15 seconds. Default is every 1 minute.
evaluation_interval: 15s # Evaluate rules every 15 seconds. The default is every 1 minute.
# scrape_timeout is set to the global default (10s).
# Alertmanager configuration # 报警配置
alerting:
alertmanagers:
- static_configs:
- targets:
# - alertmanager:9093
# Load rules once and periodically evaluate them according to the global 'evaluation_interval'.
rule_files:
# - "first_rules.yml"
# - "second_rules.yml"
# A scrape configuration containing exactly one endpoint to scrape:
# Here it's Prometheus itself.
scrape_configs:
# The job name is added as a label `job=<job_name>` to any timeseries scraped from this config.
- job_name: 'prometheus' # 任务名
# metrics_path defaults to '/metrics'
# scheme defaults to 'http'.
static_configs:
- targets: ['localhost:9100'] # 监控目标,目标上面需要有对应的node_exporter
scrape_interval:
抓取采样数据的时间间隔,默认是每60秒去被监控主机上采样一次,这个就是prometheus的自定义数据采集的频率
evaluation_interval:
监控数据规则的评估频率,这个参数是prometheus多长时间会进行一次,监控规则的评估
例如:
我们设置当 内存使用量>70%时 发出报警,这样一条rule(规则),那么prometheus会默认每60秒来执行一次这个规则,检查内存的情况
node_exporter安装:
下载地址:https://prometheus.io/download/
安装:
tar xf node_exporter-1.0.1.linux-amd64.tar.gz
cd node_exporter-1.0.1.linux-amd64
./node_exporter
查看状态:
lsof -i:9100
安装Grafana:
wget https://dl.grafana.com/oss/release/grafana-7.1.3-1.x86_64.rpm
yum install grafana-7.1.3-1.x86_64.rpm
granafa默认端口为3000,可以在浏览器中输入http://localhost:3000/
granafa首次登录账户名和密码admin/admin,可以修改
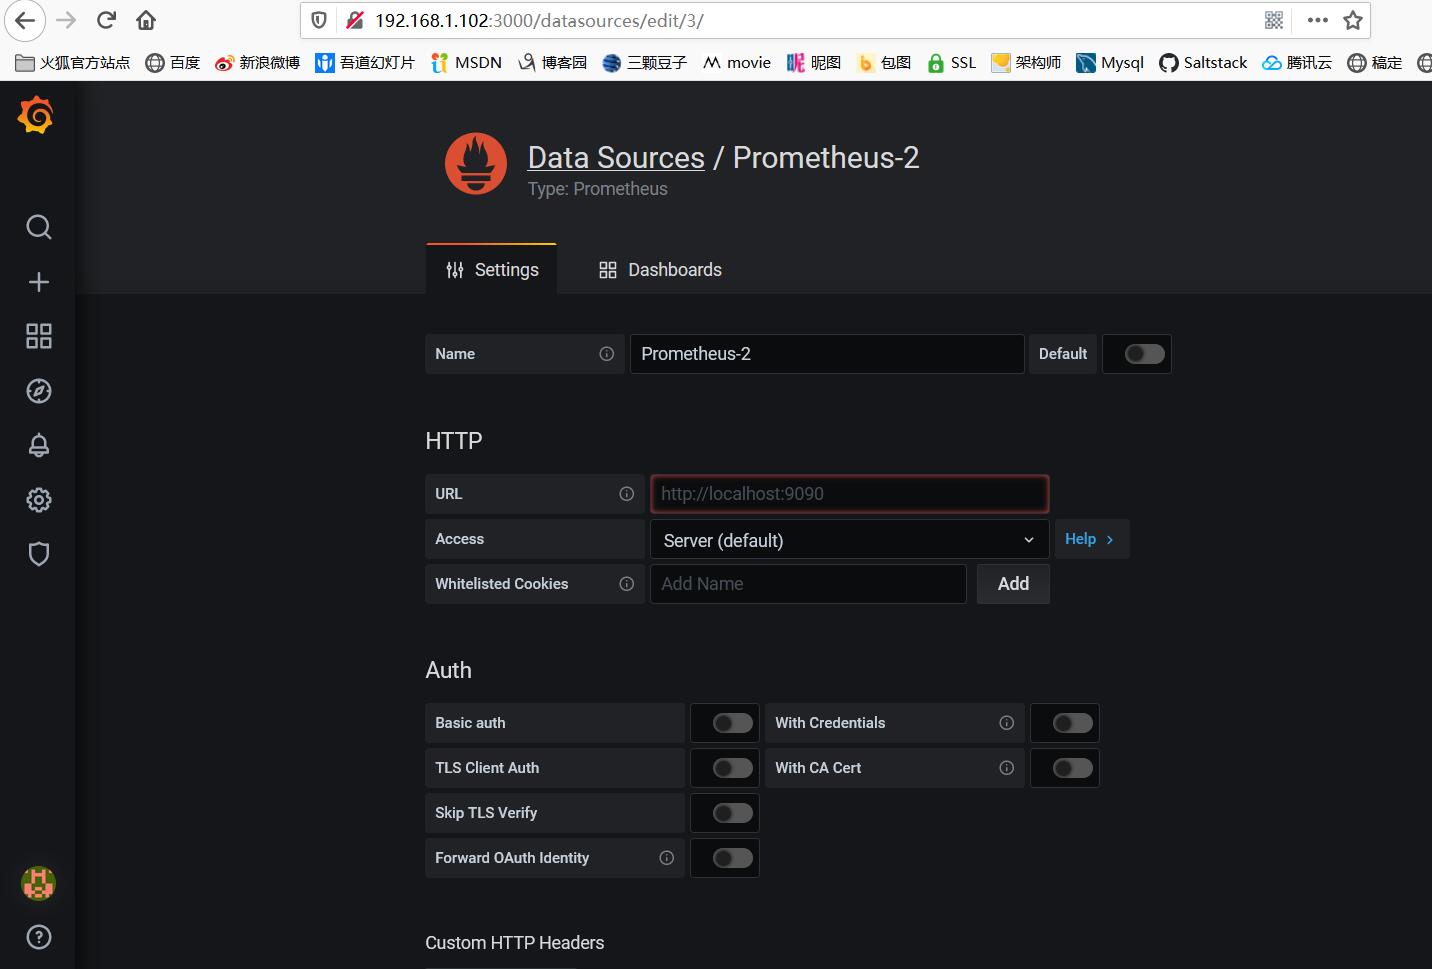
配置数据源Data sources->Add data source -> Prometheus,输入prometheus数据源的信息,主要是输入name和url
添加 Dashboard -> New Dashboard -> Import Dashboard -> 输入11074,导入Linux监控模板. 并配置数据源为Prometheus,即上一步中的name
配置完保存后即可看到逼格非常高的系统主机节点监控信息,包括系统运行时间, 内存和CPU的配置, CPU、内存、磁盘、网络流量等信息, 以及磁盘IO、CPU温度等信息。
更详细配置请参考:https://www.cnblogs.com/miaocbin/p/12009974.html

 浙公网安备 33010602011771号