
【大数据】大数据实践项目 - nginx 日志分析
Github 项目源码
1.nginx 日志收集
# 查看日志配置,不知道配置路径的话,可以执行 nginx -t
less /etc/nginx/nginx.conf

# 查看日志
cd /var/log/nginx;
ll
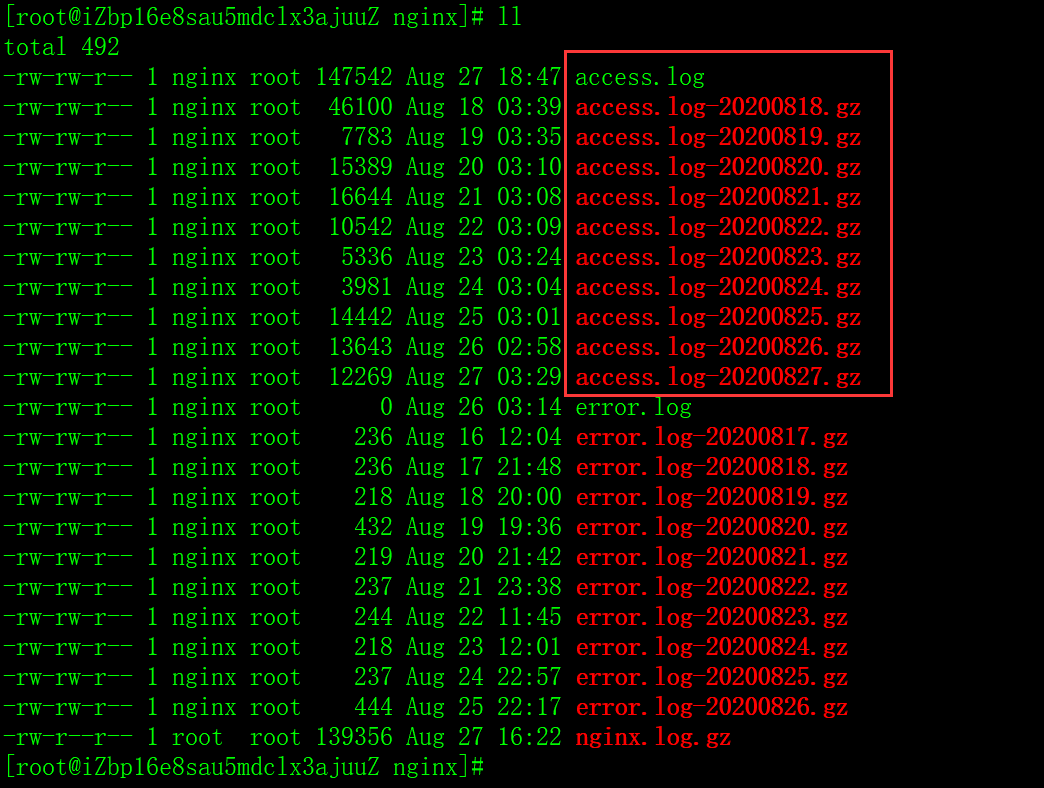
# 合并打包日志
cat access.log > nginx.log;
gunzip -c access.log*gz > nginx.log;
gzip nginx.log;
sz nginx.log.gz;
2.hive 建表加载数据
# 上传解压日志
rz;
gunzip nginx.log.gz;
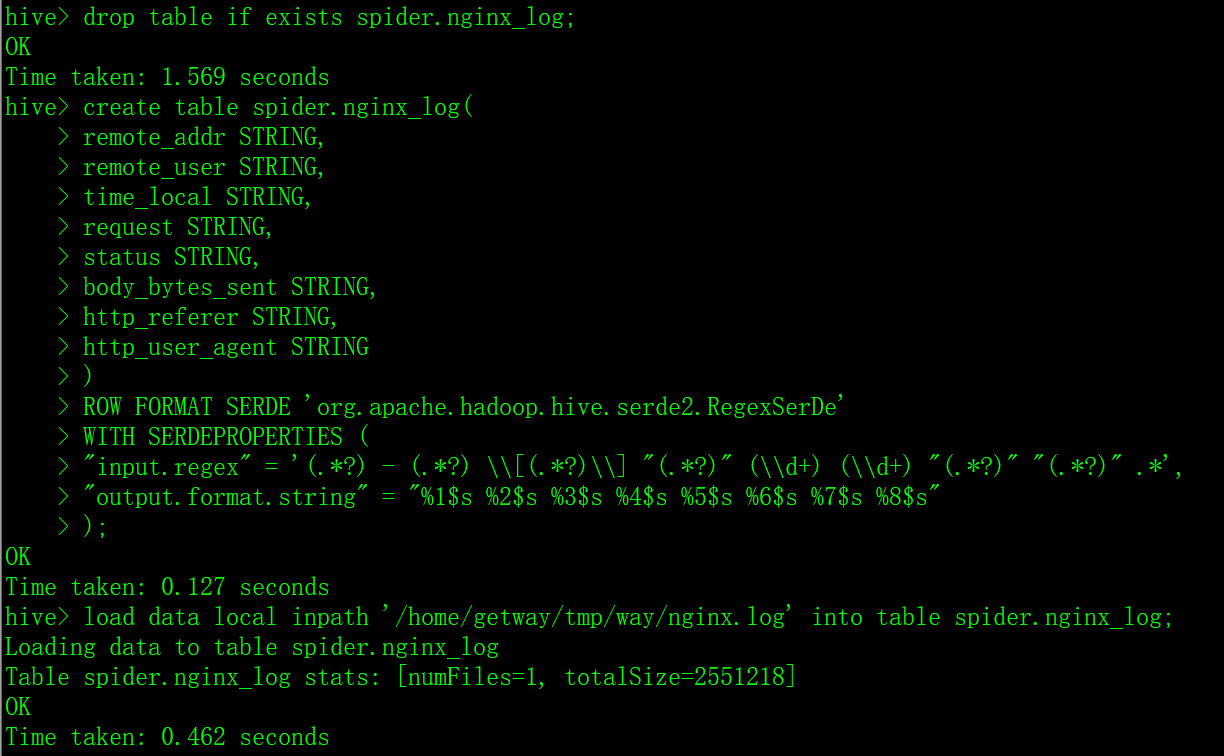
-- 根据日志格式,使用正则序列化解析,一个()是一个字段,注意转义
drop table if exists spider.nginx_log;
create table spider.nginx_log(
remote_addr STRING,
remote_user STRING,
time_local STRING,
request STRING,
status STRING,
body_bytes_sent STRING,
http_referer STRING,
http_user_agent STRING
)
ROW FORMAT SERDE 'org.apache.hadoop.hive.serde2.RegexSerDe'
WITH SERDEPROPERTIES (
"input.regex" = '(.*?) - (.*?) \\[(.*?)\\] "(.*?)" (\\d+) (\\d+) "(.*?)" "(.*?)" .*',
"output.format.string" = "%1$s %2$s %3$s %4$s %5$s %6$s %7$s %8$s"
);

-- 加载数据
load data local inpath '/home/getway/tmp/way/nginx.log' into table spider.nginx_log;
3.数据清洗与分析
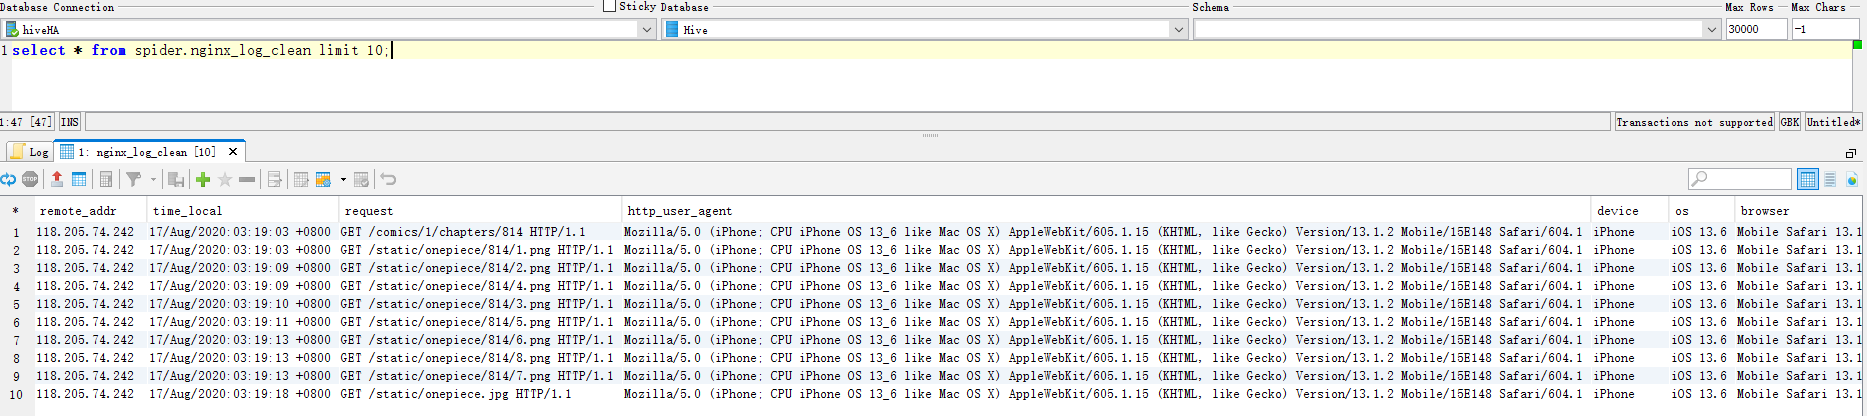
-- 数据清洗: 选择有用的字段,并通过 udf 解析 useragent,将数据写到新表 nginx_log_clean
set hive.exec.mode.local.auto=true;
set hive.exec.mode.local.auto.inputbytes.max=52428800;
set hive.exec.mode.local.auto.input.files.max=10;

add file /home/getway/tmp/way/ua_perse.py;

create table spider.nginx_log_clean as
select transform(remote_addr,
                 time_local,
                 request,
                 http_user_agent)
       USING 'python3 ua_perse.py' AS (remote_addr,
                                         time_local,
                                         request,
                                         http_user_agent,
                                         device,
                                         os,
                                         browser)
from spider.nginx_log;

-- 查看数据示例
select * from spider.nginx_log_clean limit 10;
set hive.exec.mode.local.auto=true;
set hive.exec.mode.local.auto.inputbytes.max=52428800;
set hive.exec.mode.local.auto.input.files.max=10;
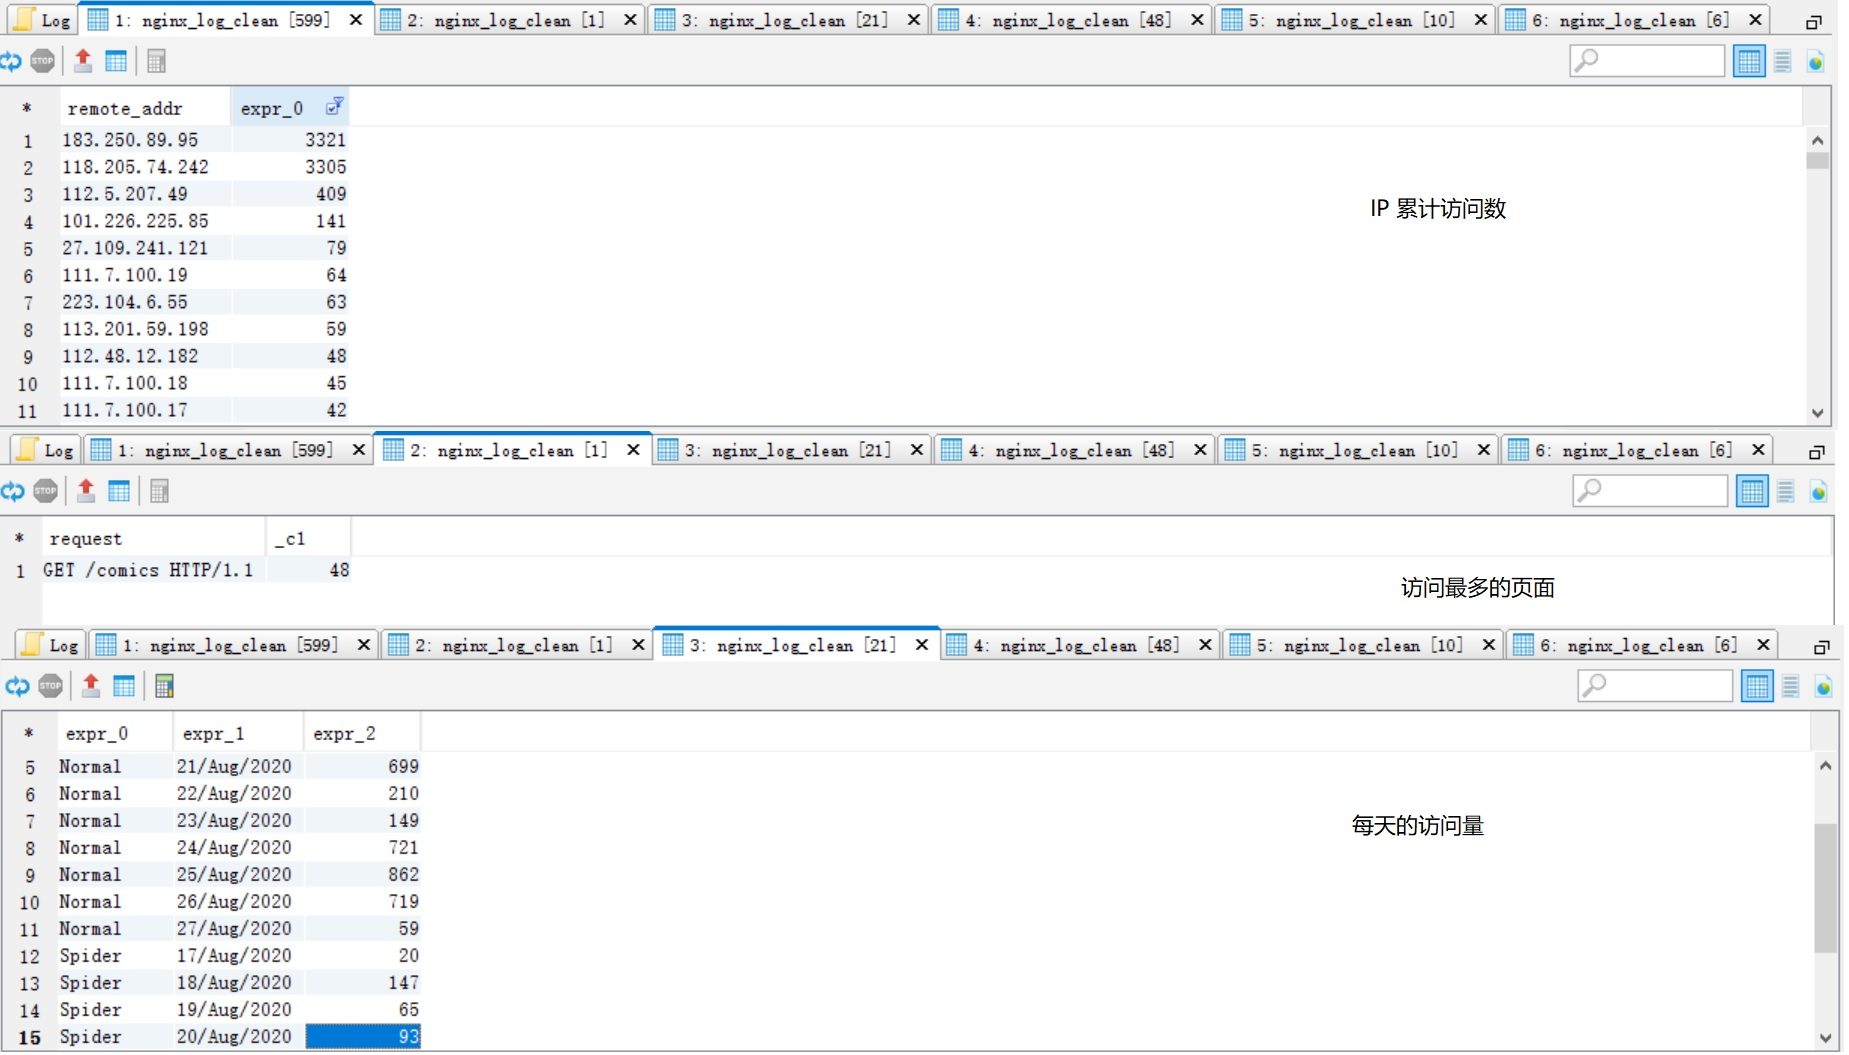
-- ip 统计
select remote_addr, count(1)
from spider.nginx_log_clean
group by remote_addr
order by 2 desc;
-- pv 最高的页面
select request, count(1)
from spider.nginx_log_clean
where request rlike 'comics'
group by request
order by 2 desc
limit 1;
-- 每天的访问数
select case when device='Spider' then 'Spider' else 'Normal' end, substring(time_local, 0, 11), count(1)
from spider.nginx_log_clean
group by case when device='Spider' then 'Spider' else 'Normal' end, substring(time_local, 0, 11)
order by 1, 2;
-- 每小时的访问数
select case when device='Spider' then 'Spider' else 'Normal' end, substring(time_local, 13, 2), count(1)
from spider.nginx_log_clean
group by case when device='Spider' then 'Spider' else 'Normal' end, substring(time_local, 13, 2)
order by 1,2;
-- 查看用户设备前 10 名
select device, count(1)
from spider.nginx_log_clean
where device not in ('Other', 'Spider') -- 过滤掉干扰数据
group by device
order by 2 desc
limit 10;
-- 爬虫访问情况
select browser, count(1)
from spider.nginx_log_clean
where device = 'Spider'
group by browser;

-- 通过 udf 获取 ip 所在省份,分析省份访问数
-- 数据量较少,使用本地模式比较快
set hive.exec.mode.local.auto=true;
set hive.exec.mode.local.auto.inputbytes.max=52428800;
set hive.exec.mode.local.auto.input.files.max=10;

add file /home/getway/baidu_api.py;

with cte as(
select remote_addr, count(1) cn
from spider.nginx_log_clean
group by remote_addr
)

select province, sum(cn)
from(
select transform(remote_addr, cn)
  USING 'python3 baidu_api.py' AS (province, cn)
from cte
) as a
group by province;
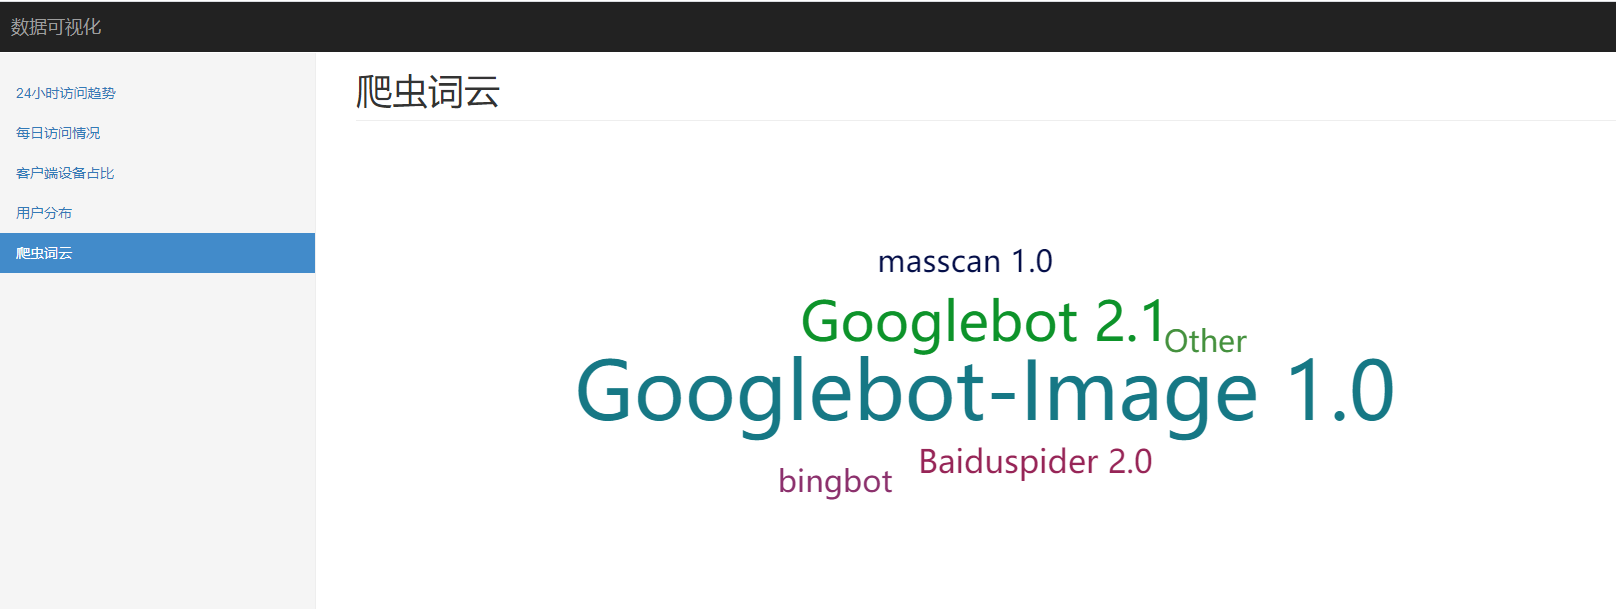
4.数据可视化
将前面需要可视化的分析结果,直接复制粘贴到 excel,然后通过 pandas 读取,经 ironman 可视化展示。
基于 flask 和 echarts 的数据可视化工具 ironman
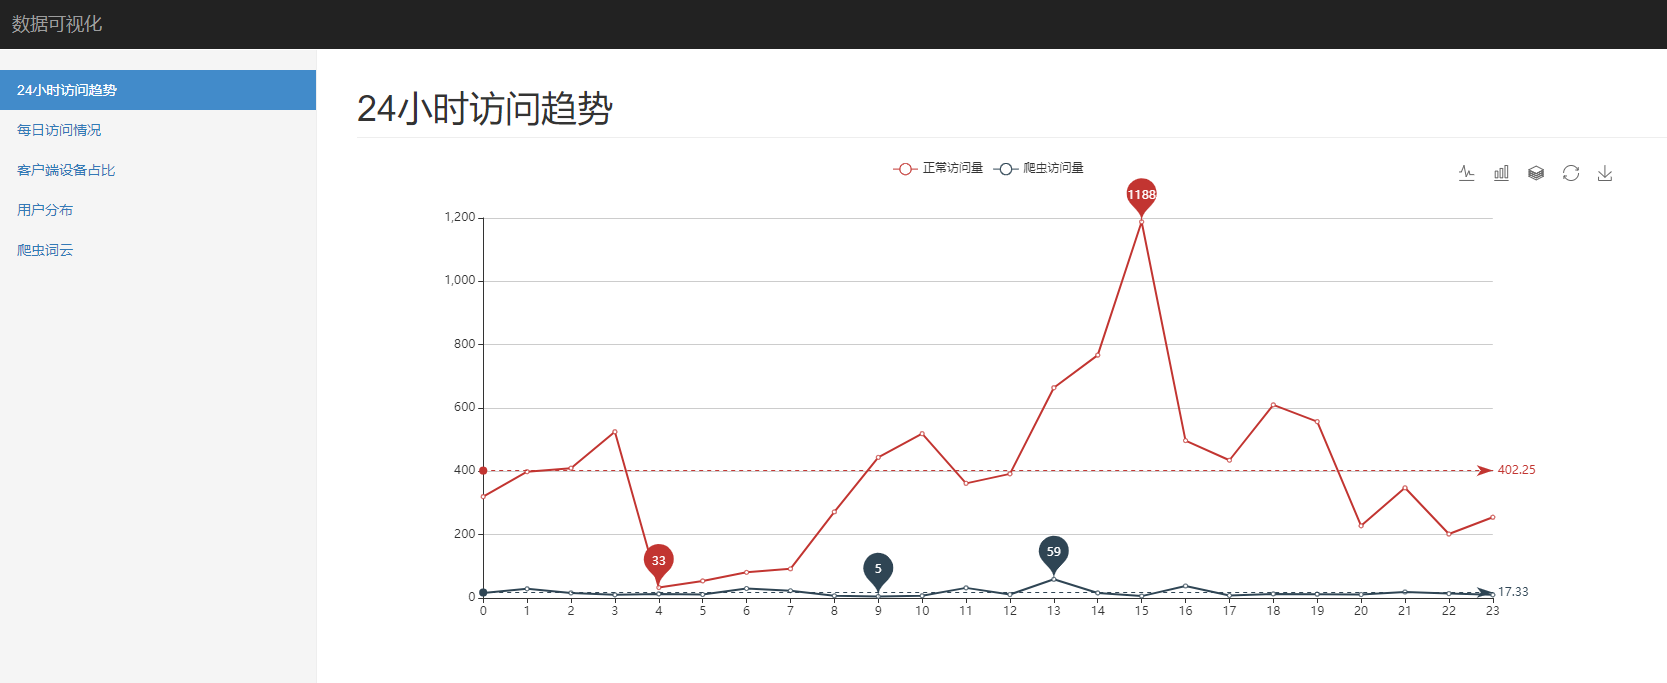
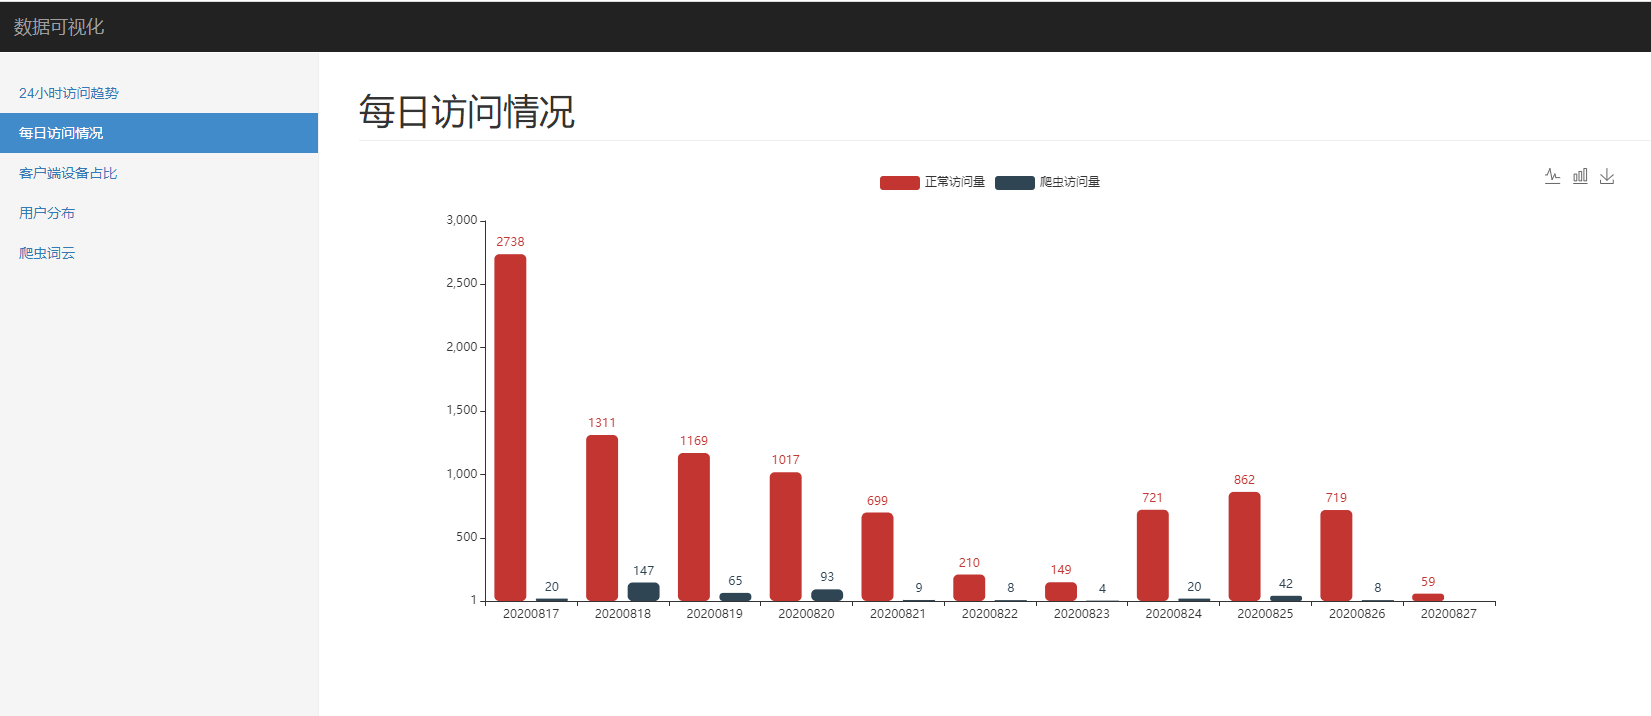
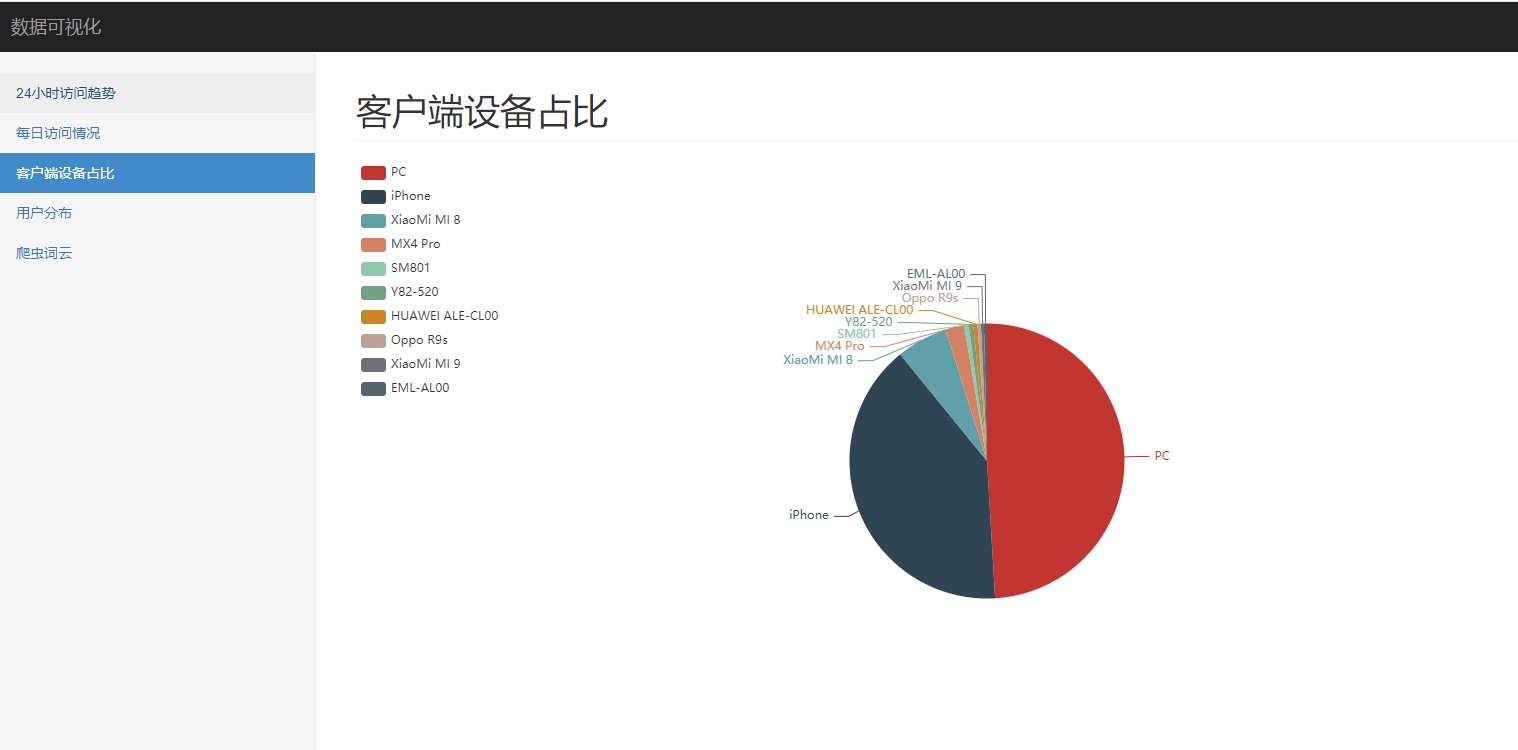
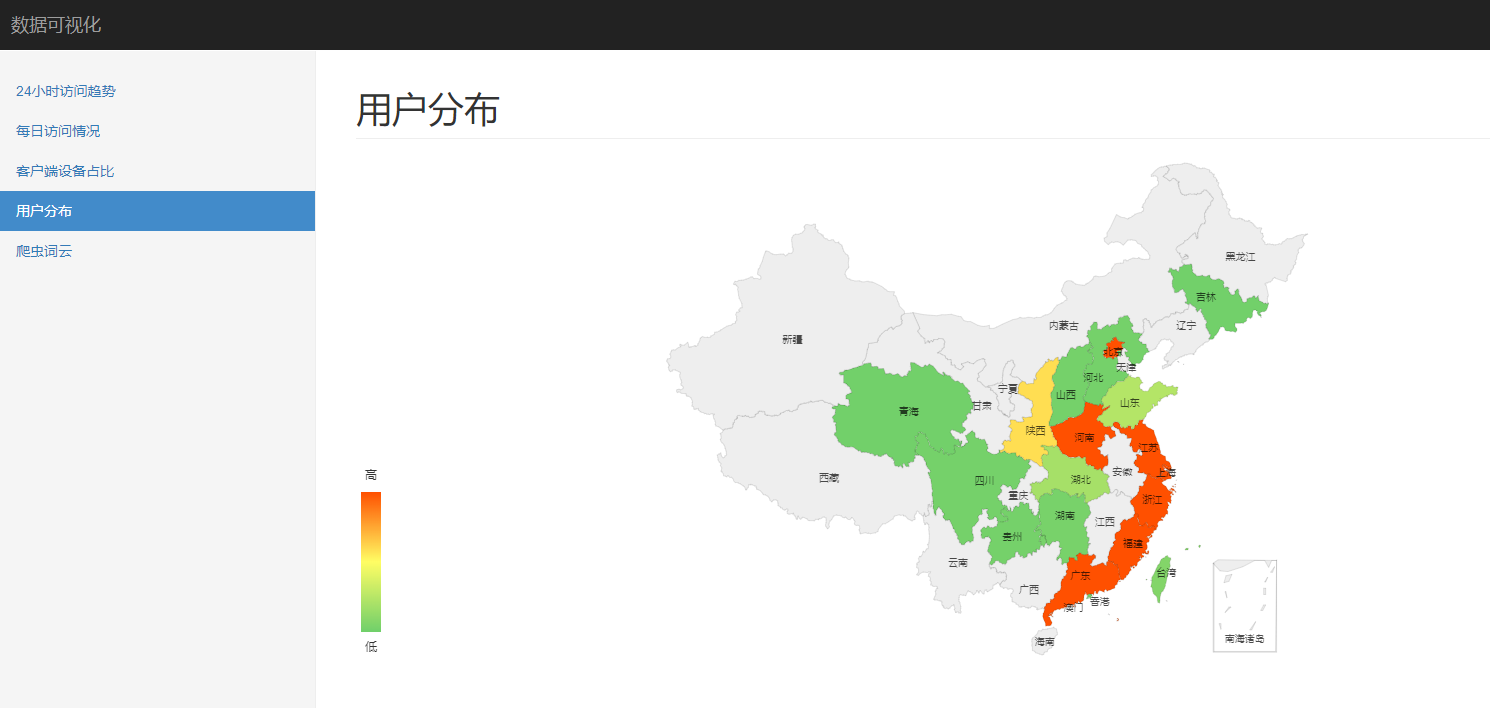
最终的效果图
24 小时访问趋势
每日访问情况
客户端设备占比
用户分布
爬虫词云

 浙公网安备 33010602011771号