【ABAP系列】SAP ABAP如何在调试查看EXPORT/IMPORT 内存数据
公众号:matinal
本文作者:matinal
前言部分
大家可以关注我的公众号,公众号里的排版更好,阅读更舒适。
正文部分
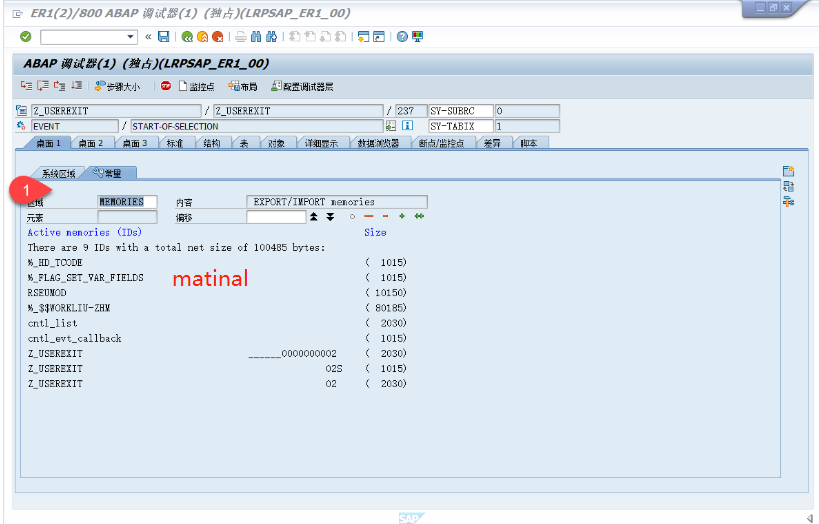
These memory IDs can be accessed in the debugger, but the option isn't accessible by default in the "new" Debugger. To display them you have two options:
- In the new Debugger, change one of the tools you're using. Do this by clicking the "New Tool" or "Replace Tool" that you can see at the top of the vertical button column on the right of each subwindow. Open the Special Tools folder in the tree and select "System Areas (Internal Only)". In the second tab of this tool you can now see a list of areas. Double-click the MEMORIES("EXPORT/IMPORT memories") area or manually enter it in the Area input field to open the list of active memory IDs. Click through on any one to see its hexadecimal value.

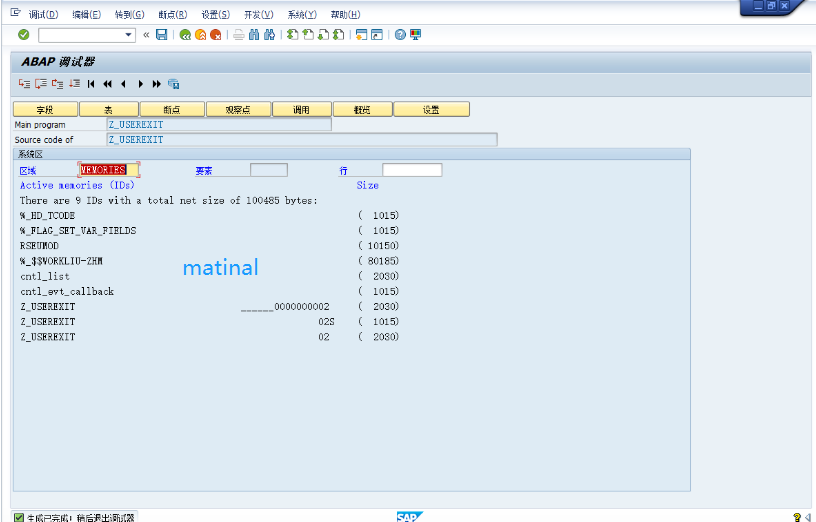
- In the menu bar, open Debugger and select "Switch to Classic Debugger". Once it opens, find the following in the menu bar: Goto, System Areas, ABAP Memory. The system areas will be displayed with the MEMORIES area selected by default.

Parameters
If you want to view the PARAMETERs that were set instead of memory IDs, the procedure is almost exactly the same. However, instead of opening the MEMORIES system area, open the SMEM ("SAP memory (SPA-GPA)") area.

 浙公网安备 33010602011771号