

matplotlib画图xticks设置为字母
matplotlib画图xticks设置为字母
一、总结
一句话总结:
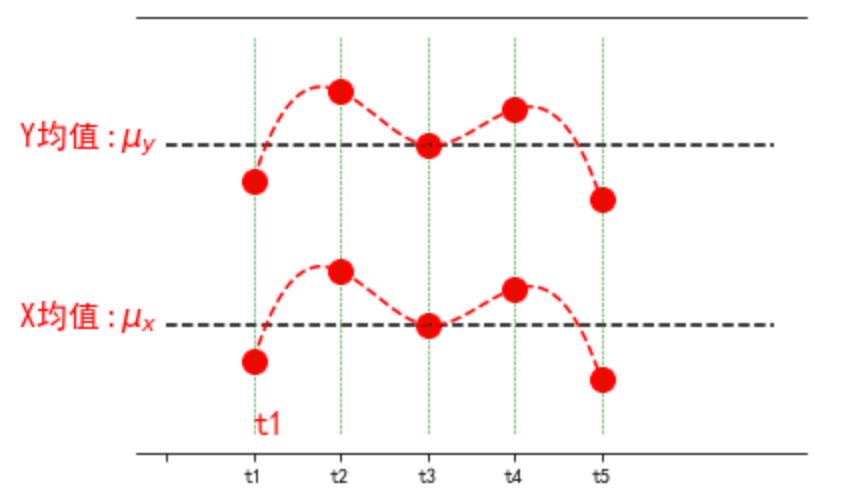
plt.xticks(np.arange(6), ('','t1', 't2', 't3', 't4', 't5'))
很多时候都可以去看帮助文档,里面介绍的非常详细
二、matplotlib画图xticks设置为字母
博客对应课程的视频位置:
import numpy as np
import matplotlib.pyplot as plt
from scipy.interpolate import make_interp_spline
# 设置matplotlib库字体的非衬线字体为黑体
plt.rcParams["font.sans-serif"]=["SimHei"]
# 设置matplotlib库字体族为非衬线字体
plt.rcParams["font.family"]="sans-serif"

fig, ax = plt.subplots()
# 取消边框
for key, spine in ax.spines.items():
    # 'left', 'right', 'bottom', 'top'
    if key == 'left' or key == 'right':
        spine.set_visible(False)
plt.xticks(np.arange(6), ('','t1', 't2', 't3', 't4', 't5'))
plt.yticks([])

# 上部分图
x_mean=[0,2,3,4,7]
x_list=[1,2,3,4,5]

x=np.array(x_list)
y=np.array([4,9,6,8,3])
y_mean=np.mean(y).repeat(5)
#plt.plot(x,y,'ro')
plt.plot(x,y,color='red', marker='o', linestyle='dashed',linewidth=0, markersize=12)
plt.plot(x_mean,y_mean,'k--')
x_smooth = np.linspace(x.min(),x.max(),300) #300 represents number of points to make between T.min and T.max
y_smooth = make_interp_spline(x, y)(x_smooth)
plt.plot(x_smooth,y_smooth,'r--')
plt.text(-1.7,np.mean(y),r'X均值'+r'$:\mu_x$', fontdict={'size':16,'color':'r'})

# 下部分图
y2=np.array([14,19,16,18,13])
y2_mean=np.mean(y2).repeat(5)
#plt.plot(x,y,'ro')
plt.plot(x,y2,color='red', marker='o', linestyle='dashed',linewidth=0, markersize=12)
plt.plot(x_mean,y2_mean,'k--')
x2_smooth = np.linspace(x.min(),x.max(),300) #300 represents number of points to make between T.min and T.max
y_smooth = make_interp_spline(x, y2)(x2_smooth)
plt.plot(x_smooth,y_smooth,'r--')
plt.text(-1.7,np.mean(y2),r'Y均值'+r'$:\mu_y$', fontdict={'size':16,'color':'r'})

# 画虚线
d_y=np.linspace(0,22,10)
for i in range(len(x_list)):
    d_x=np.array([x_list[i] for j in range(10)])
    plt.plot(d_x,d_y,'g--',linewidth=0.5)

# t时刻标注
plt.show()

 浙公网安备 33010602011771号