期末大作业
一、boston房价预测
1. 读取数据集
1 # 导入多元线性回归模型
2 from sklearn.datasets import load_boston
3 from sklearn.model_selection import train_test_split
4 # 波士顿房价数据集
5 data = load_boston()
2. 训练集与测试集划分
1 #训练集与测试集划分
2 from sklearn.model_selection import train_test_split
3 X_train,X_test,y_train,y_test=train_test_split(data.data,data.target,test_size=0.3)
3. 线性回归模型:建立13个变量与房价之间的预测模型,并检测模型好坏。
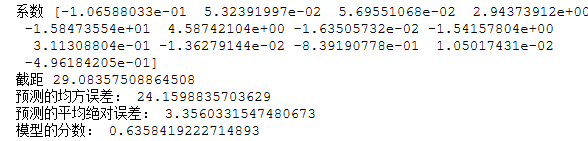
 1 #建立线性回归模型
 2 from sklearn.linear_model import LinearRegression
 3 mlr = LinearRegression()
 4 mlr.fit(X_train,y_train)
 5 print('系数',mlr.coef_,"\n截距",mlr.intercept_)
 6
 7
 8 #检测模型好坏
 9 from sklearn.metrics import regression
10 y_predict = mlr.predict(X_test)
11
12
13 #输出分数
14 print("预测的均方误差:", regression.mean_squared_error(y_test,y_predict))
15 print("预测的平均绝对误差:", regression.mean_absolute_error(y_test,y_predict))
16 print("模型的分数:",mlr.score(X_test, y_test))
4. 多项式回归模型:建立13个变量与房价之间的预测模型,并检测模型好坏。
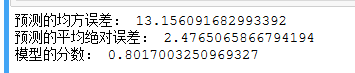
 1 #建立多项式回归模型
 2 from sklearn.preprocessing import PolynomialFeatures
 3 a = PolynomialFeatures(degree=2)
 4 X_poly_train = a.fit_transform(X_train)
 5 X_poly_test = a.transform(X_test)
 6
 7 mlrp = LinearRegression()
 8 mlrp.fit(X_poly_train, y_train)
 9
10 #检测模型好坏
11 y_predict2 = mlrp.predict(X_poly_test)
12
13 #输出分数
14 print("预测的均方误差:", regression.mean_squared_error(y_test,y_predict2))
15 print("预测的平均绝对误差:", regression.mean_absolute_error(y_test,y_predict2))
16 print("模型的分数:",mlrp.score(X_poly_test, y_test))
5. 比较线性模型与非线性模型的性能,并说明原因。
线性回归模型,是利用数理统计中回归分析,来确定两种或两种以上变量间相互依赖的定量关系的一种统计分析方法,运用十分广泛。其表达形式为y = w'x+e,e为误差服从均值为0的正态分布。线性回归模型是利用称为线性回归方程的最小平方函数对一个或多个自变量和因变量之间关系进行建模的一种回归分析。这种函数是一个或多个称为回归系数的模型参数的线性组合。只有一个自变量的情况称为简单回归,大于一个自变量情况的叫做多元回归。误差控制上会比较不稳定。
非线性回归,是在掌握大量观察数据的基础上,利用数理统计方法建立因变量与自变量之间的回归关系函数表达式(称回归方程式)。回归分析中,当研究的因果关系只涉及因变量和一个自变量时,叫做一元回归分析;当研究的因果关系涉及因变量和两个或两个以上自变量时,叫做多元回归分析。误差控制上比线性模型要稳定一些。
二、中文文本分类
0369:时政、体育、星座、游戏、娱乐
1.获取文件,写文件
 1 import os
 2 import numpy as np
 3 import sys
 4 from datetime import datetime
 5 import gc
 6 path = r'C:\Users\Administrator\Desktop\0369'
 7
 8
 9 # 导入结巴库,并将需要用到的词库加进字典
10 import jieba
11 # 导入停用词:
12 with open(r'F:\stopsCN.txt', encoding='utf-8') as f:
13     stopwords = f.read().split('\n')
2.除去噪声,如:格式转换,去掉符号,整体规范化遍历每个个文件夹下的每个文本文件。使用jieba分词将中文文本切割。去掉停用词,维护停用词表。
 1 def processing(tokens):
 2     # 去掉非字母汉字的字符
 3     tokens = "".join([char for char in tokens if char.isalpha()])
 4     # 结巴分词
 5     tokens = [token for token in jieba.cut(tokens,cut_all=True) if len(token) >=2]
 6     # 去掉停用词
 7     tokens = " ".join([token for token in tokens if token not in stopwords])
 8     return tokens
 9
10 tokenList = []
11 targetList = []
12 # 用os.walk获取需要的变量,并拼接文件路径再打开每一个文件
13 for root,dirs,files in os.walk(path):
14     for f in files:
15         filePath = os.path.join(root,f)
16         with open(filePath, encoding='utf-8') as f:
17             content = f.read()
18             # 获取新闻类别标签,并处理该新闻
19         target = filePath.split('\\')[-2]
20         targetList.append(target)
21         tokenList.append(processing(content))

6.对处理之后的文本开始用TF-IDF算法进行单词权值的计算
1 #划分训练集和测试,用TF-IDF算法进行单词权值的计算
2 from sklearn.feature_extraction.text import TfidfVectorizer
3 from sklearn.model_selection import train_test_split
4 vectorizer= TfidfVectorizer()
5 x_train,x_test,y_train,y_test=train_test_split(tokenList,targetList,test_size=0.2)
6 X_train=vectorizer.fit_transform(x_train)
7 X_test=vectorizer.transform(x_test)
7.贝叶斯预测种类
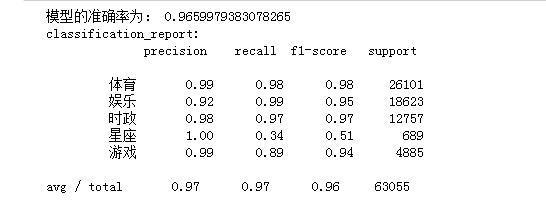
 1 #构建贝叶斯模型
 2 from sklearn.naive_bayes import MultinomialNB #用于离散特征分类,文本分类单词统计,以出现的次数作为特征值
 3 mulp=MultinomialNB ()
 4 mulp_NB=mulp.fit(X_train,y_train)
 5 #对模型进行预测
 6 y_predict=mulp.predict(X_test)
 7 # # 从sklearn.metrics里导入classification_report做分类的性能报告
 8 from sklearn.metrics import classification_report
 9 print('模型的准确率为:', mulp.score(X_test, y_test))
10 print('classification_report:\n',classification_report(y_test, y_predict))
8.模型评价。新文本类别预测
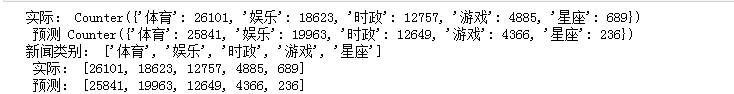
 1 # 将预测结果和实际结果进行对比
 2 import collections
 3 import matplotlib.pyplot as plt
 4
 5 # 统计测试集和预测集的各类新闻个数
 6 testCount = collections.Counter(y_test)
 7 predCount = collections.Counter(y_predict)
 8 print('实际:',testCount,'\n', '预测', predCount)
 9
10 # 建立标签列表,实际结果列表,预测结果列表,
11 nameList = list(testCount.keys())
12 testList = list(testCount.values())
13 predictList = list(predCount.values())
14 x = list(range(len(nameList)))
15 print("新闻类别:",nameList,'\n',"实际:",testList,'\n',"预测:",predictList)

 浙公网安备 33010602011771号