作业三:CART回归树
作业三:CART回归树
| 20大数据三班 | 博客链接 |
|---|---|
| 学号 | 201613336 |
问题一:
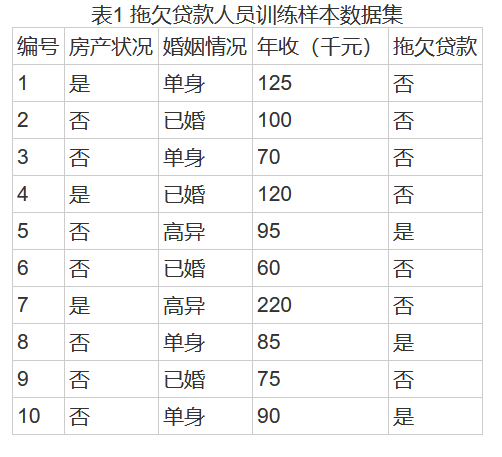
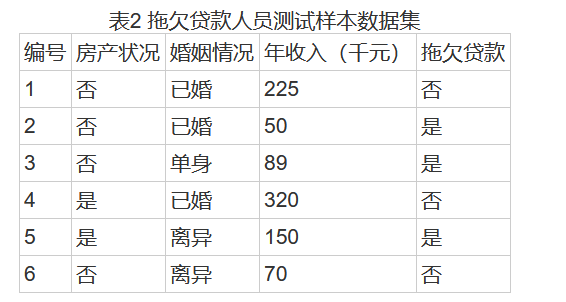
表1为拖欠贷款人员训练样本数据集,使用CART算法基于该表数据构造决策树模型,并使用表2中测试样本集确定剪枝后的最优子树。
问题二
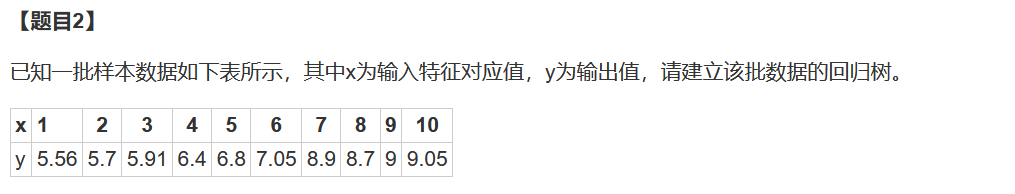
要求
1.以上两题写出详细的计算步骤;
2.以上两题在作业本上完成后拍照上传。
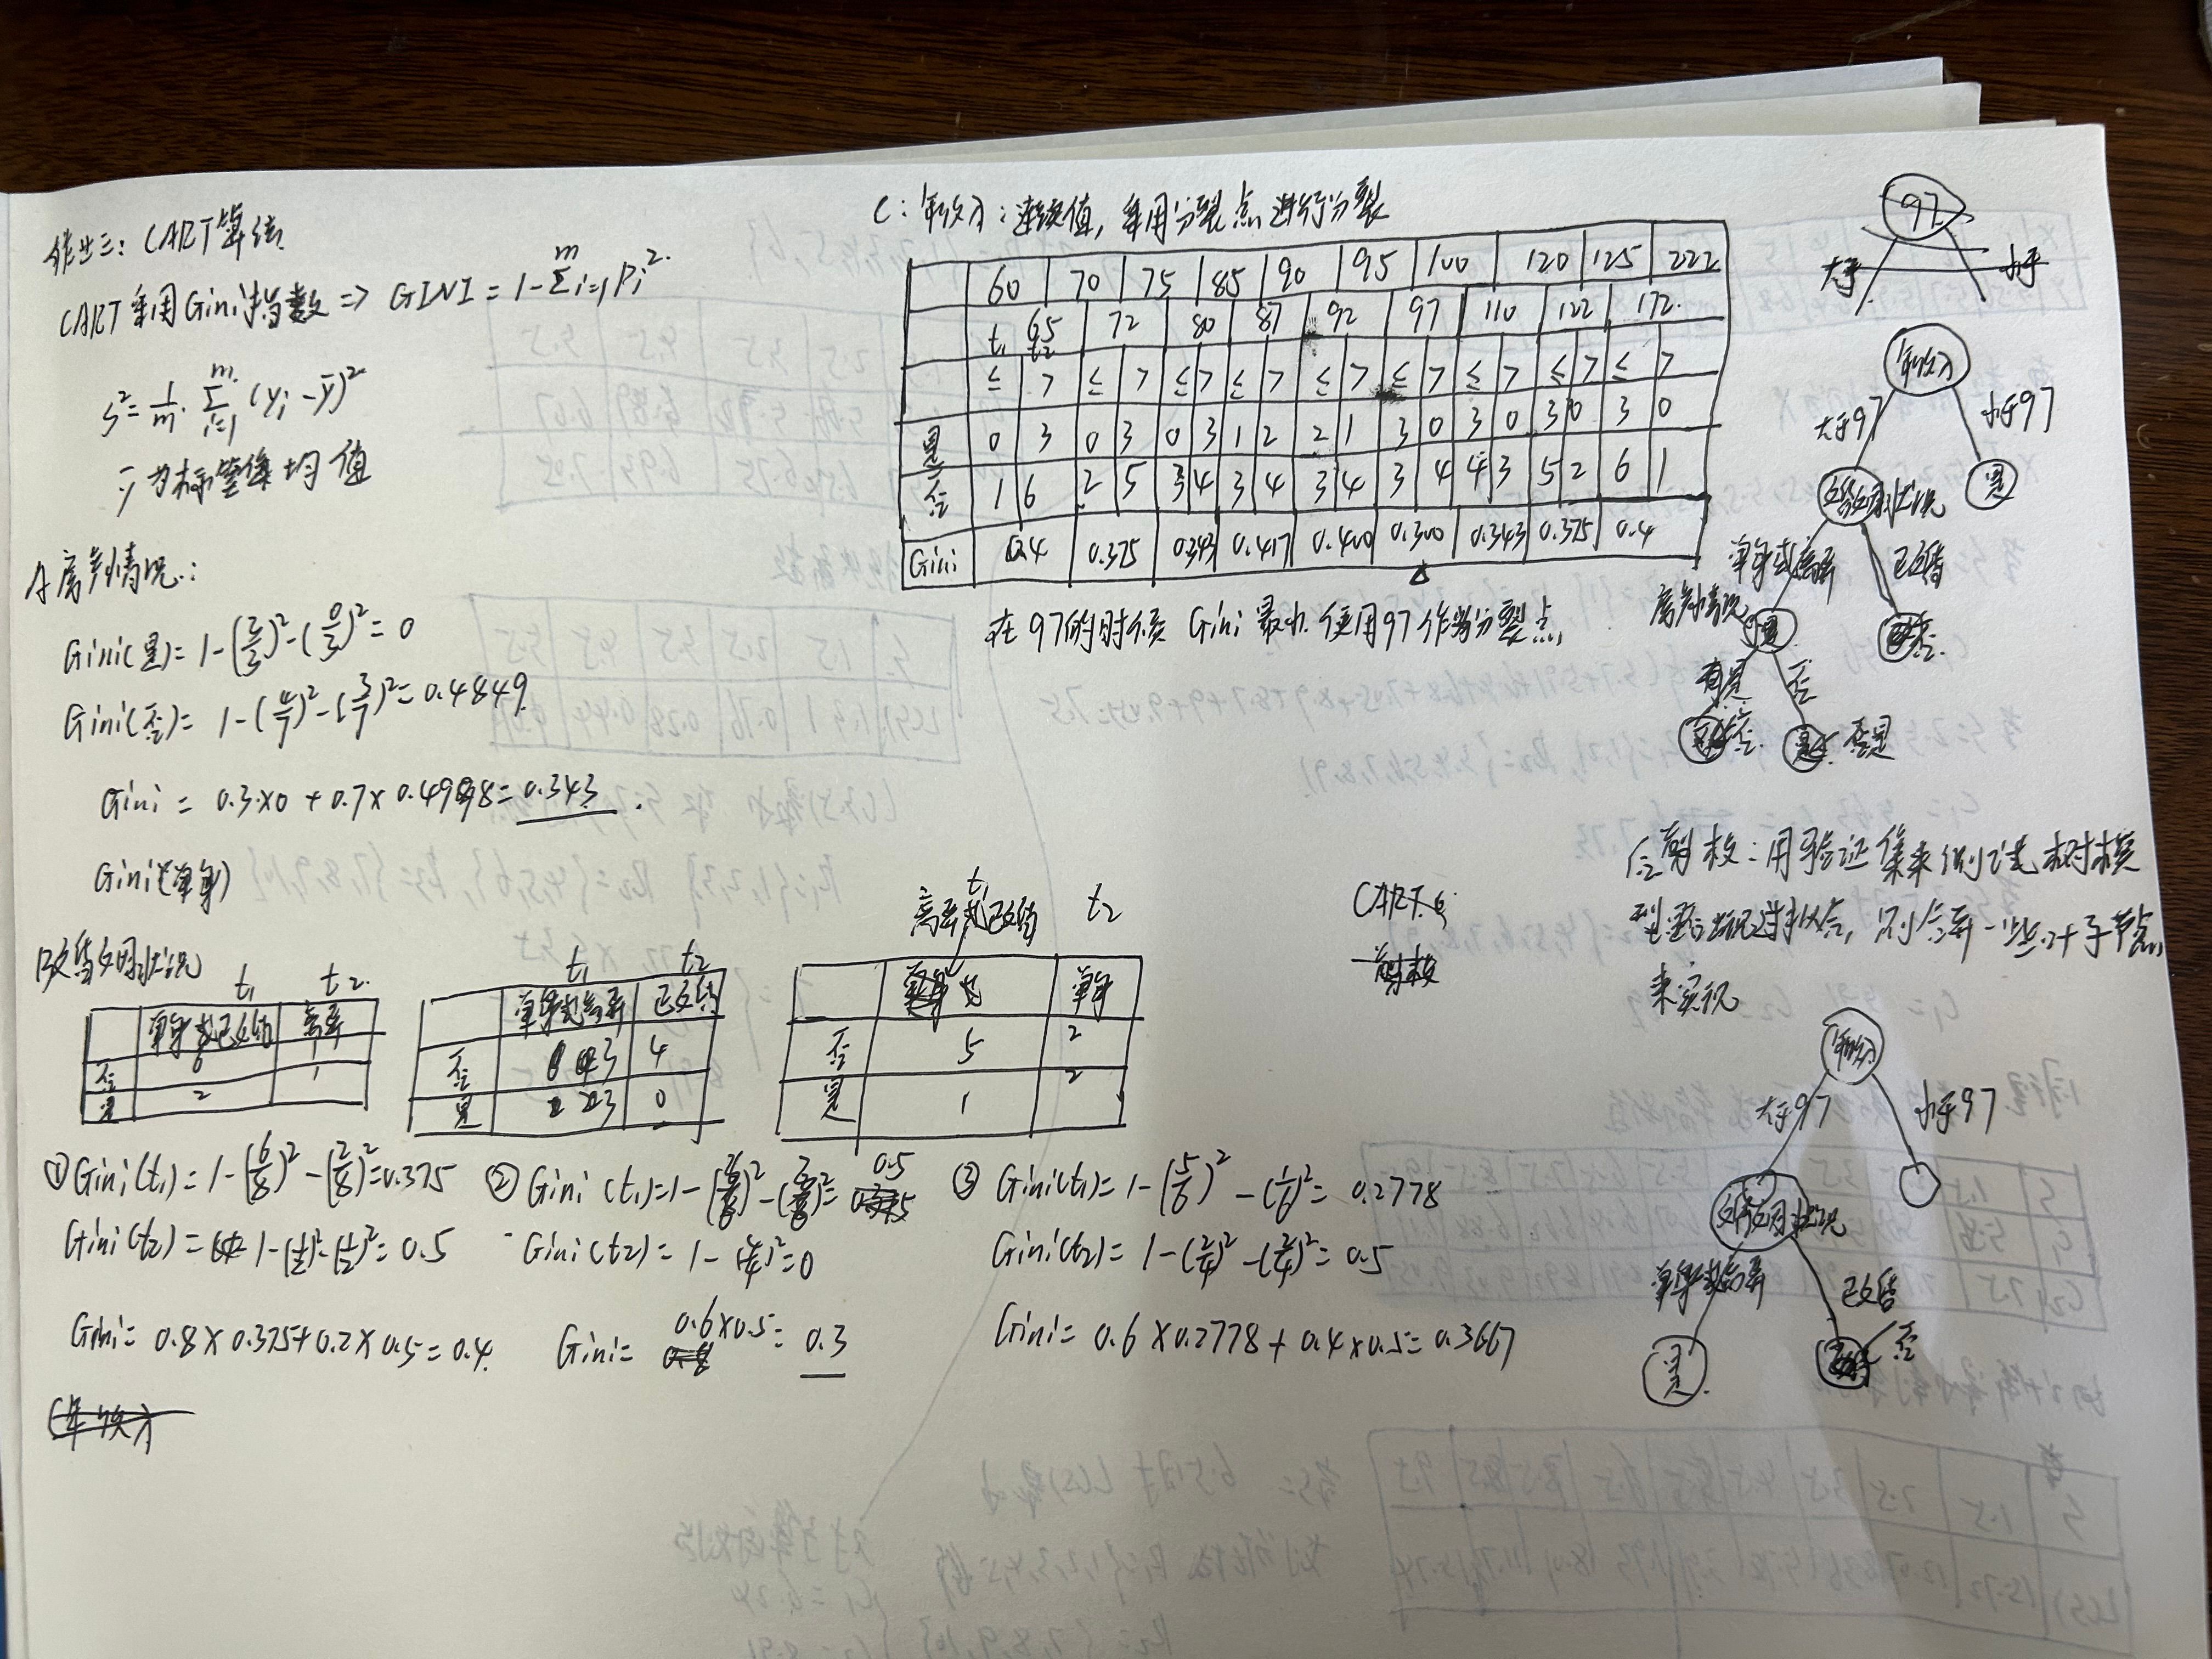
问题一的解决方案:
问题二的解决方案
1、代码
点击查看代码
#author:qiao_px
#@Time 2022/11/2 12:29
#@File 作业三.py
import numpy as np
import matplotlib.pyplot as plt
from sklearn.tree import DecisionTreeRegressor
from sklearn import linear_model
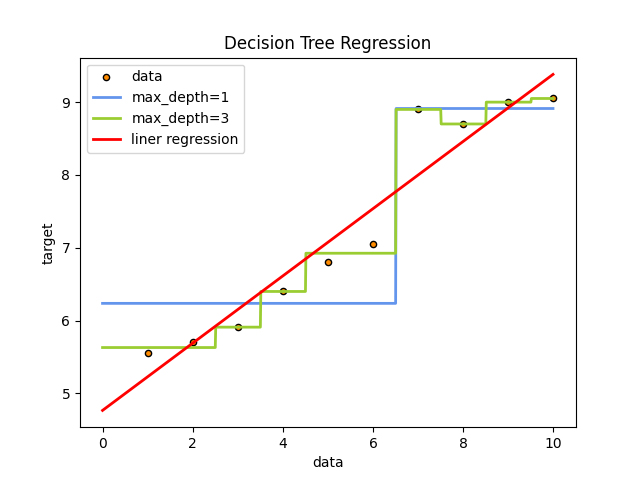
# Data set
x = np.array(list(range(1, 11))).reshape(-1, 1)
y = np.array([5.56, 5.70, 5.91, 6.40, 6.80, 7.05, 8.90, 8.70, 9.00, 9.05]).ravel()
# Fit regression model
model1 = DecisionTreeRegressor(max_depth=1)
model2 = DecisionTreeRegressor(max_depth=3)
model3 = linear_model.LinearRegression()
model1.fit(x, y)
model2.fit(x, y)
model3.fit(x, y)
# Predict
X_test = np.arange(0.0, 10.0, 0.01)[:, np.newaxis]
y_1 = model1.predict(X_test)
y_2 = model2.predict(X_test)
y_3 = model3.predict(X_test)
# Plot the results
plt.figure()
plt.scatter(x, y, s=20, edgecolor="black",
c="darkorange", label="data")
plt.plot(X_test, y_1, color="cornflowerblue",
label="max_depth=1", linewidth=2)
plt.plot(X_test, y_2, color="yellowgreen", label="max_depth=3", linewidth=2)
plt.plot(X_test, y_3, color='red', label='liner regression', linewidth=2)
plt.xlabel("data")
plt.ylabel("target")
plt.title("Decision Tree Regression")
plt.legend()
plt.show()
2、运行结果图
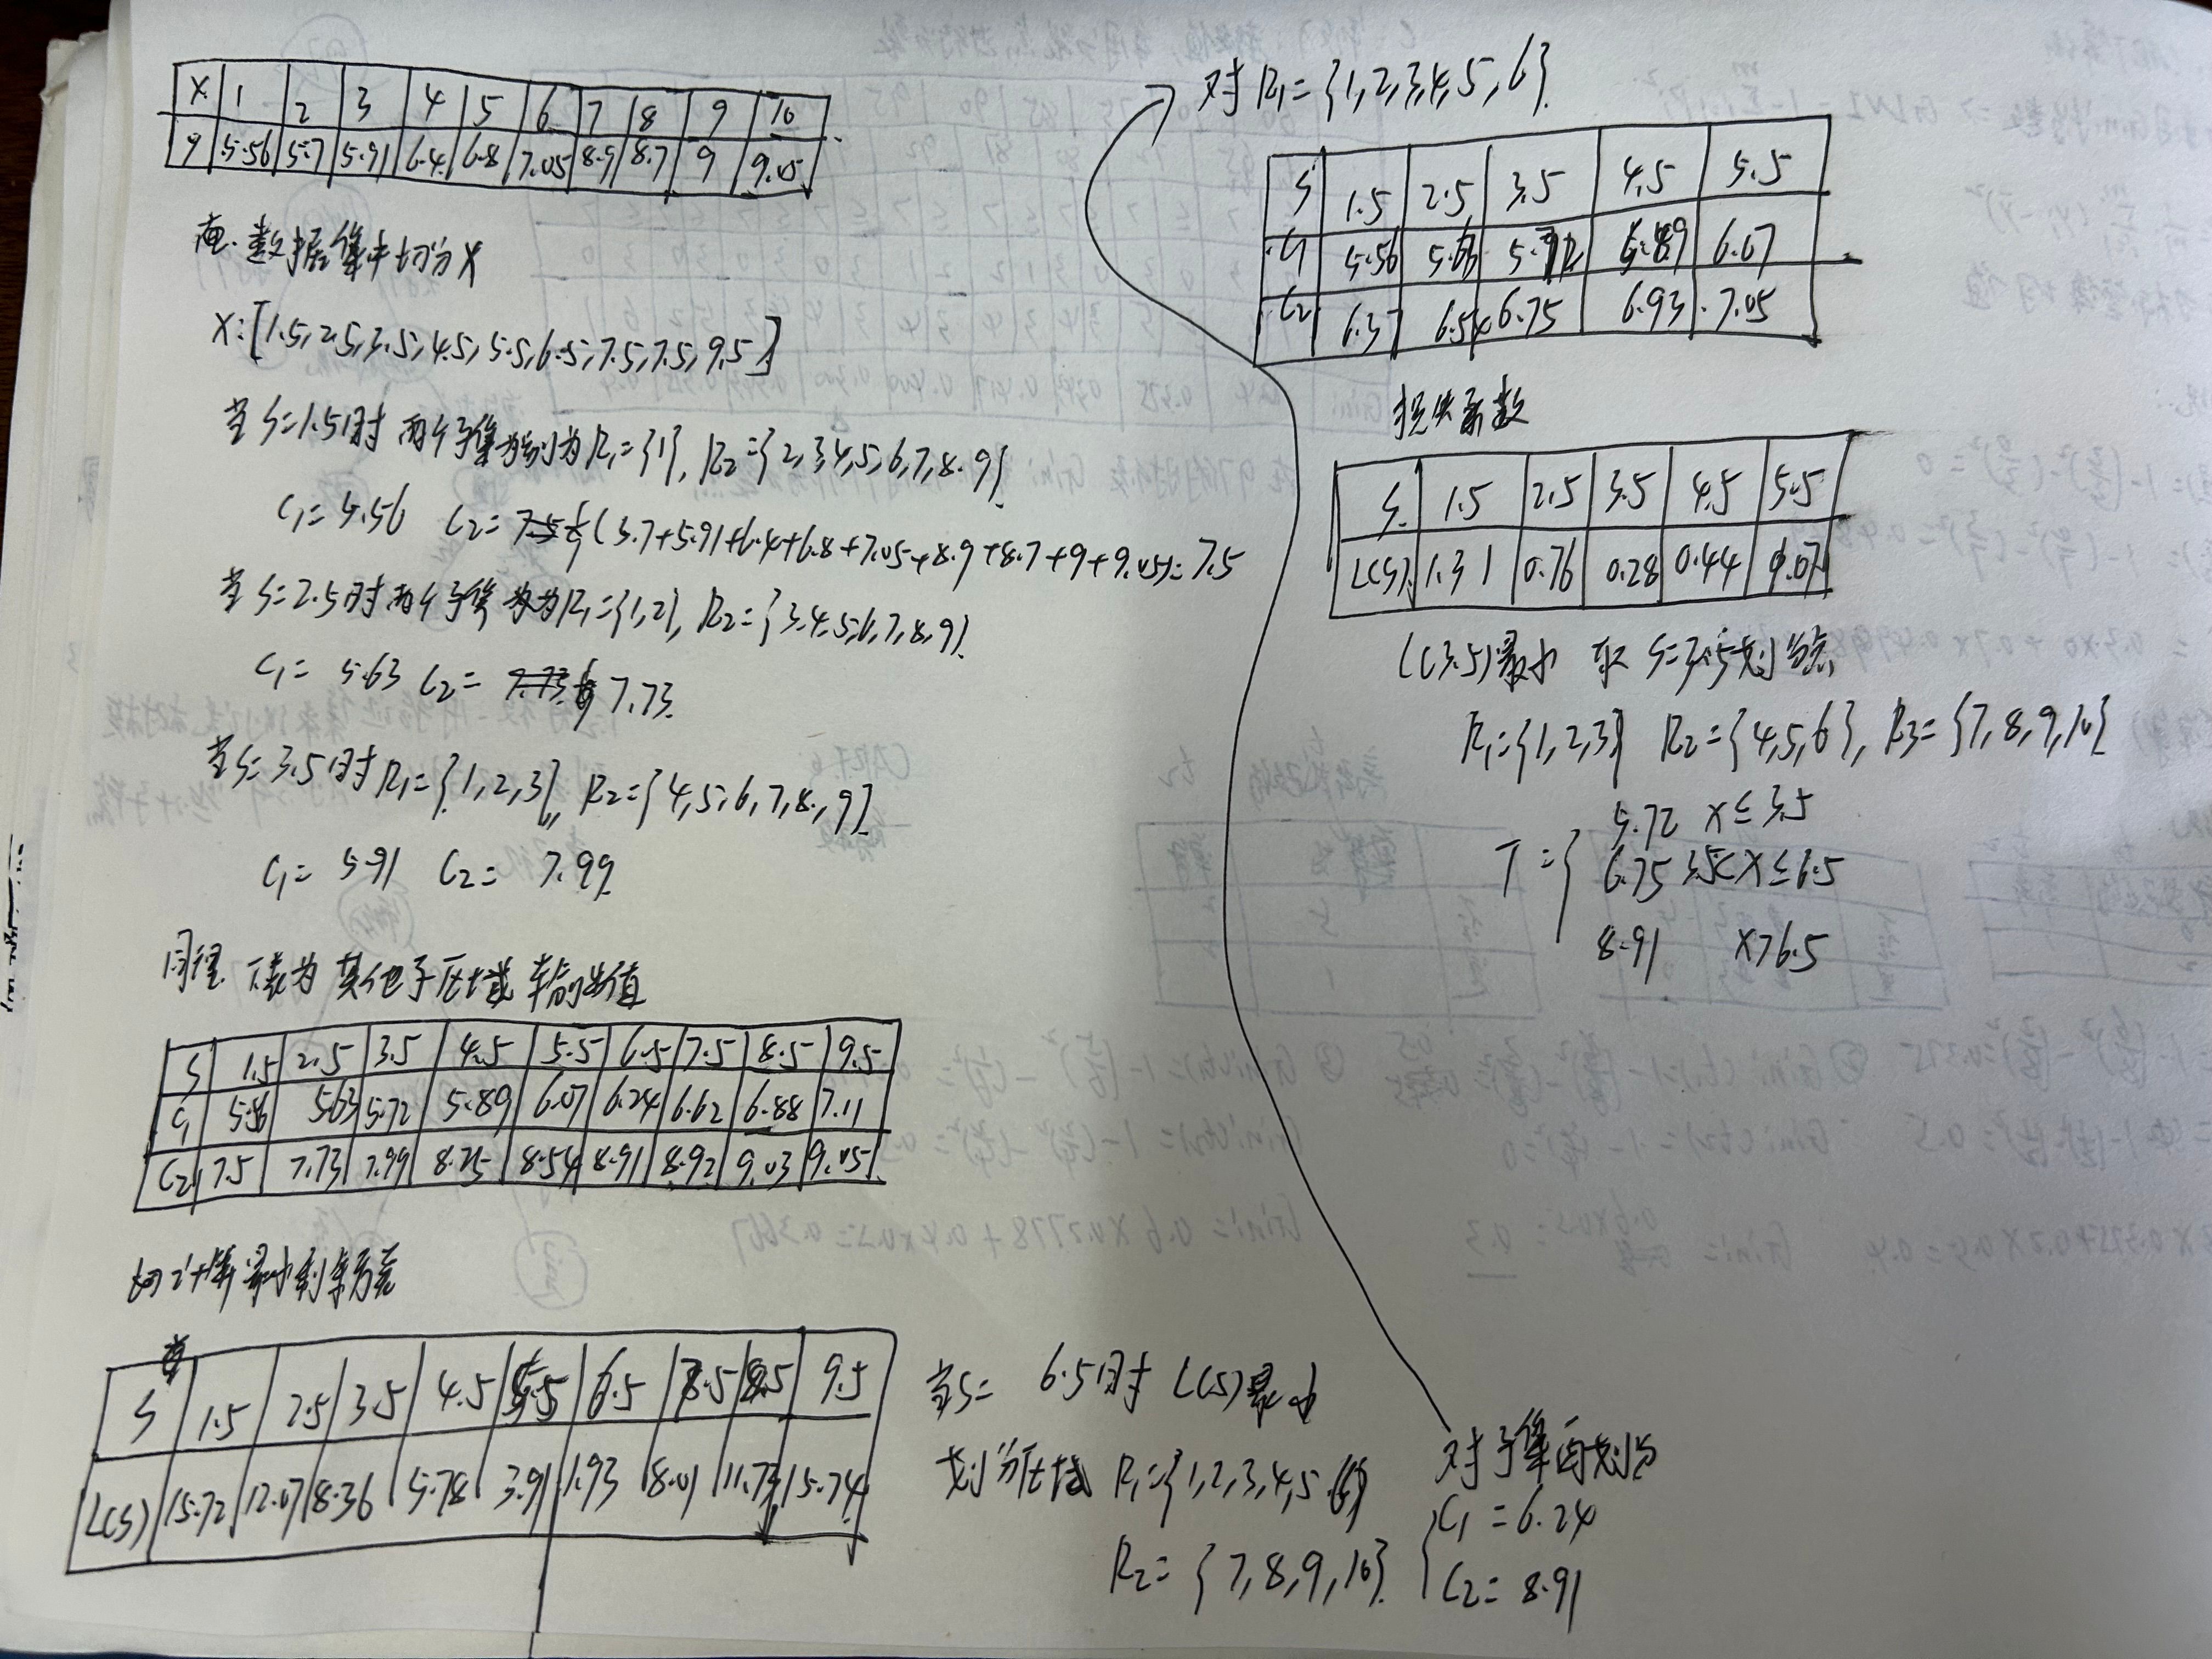
3、作业本手算过程

 浙公网安备 33010602011771号