
当当网图书畅销榜网络爬虫
一、选题的背景
为什么要选择此选题?要达到的数据分析的预期目标是什么?(10 分)
从社会、经济、技术、数据来源等方面进行描述(200 字以内)
普希金曾说“书籍是我们的精神食粮”。读书使人进步,读书让我们有知识涵养来面对生活的困难,学好知识才可以让我们找到工作立足与生活,书中自有黄金屋,书中自有颜如玉。作为一名大学生读书吸取营养是十分重要的,但是书类众多,如何在一堆图书中选取好书呢?售卖图书最出名的就是当当网了,在图书畅销榜榜中我们能找到许多优秀的图书,好的图书才能促销,还能查看到购买的最多群体,预期目标是找到图书价格和发布年份的一定关系和这些图书中的重点字,对排行榜进行爬取和观看 ,让我们能更好的选取优秀的图书。
二、主题式网络爬虫设计方案(10 分)
1.主题式网络爬虫名称
当当网图书畅销榜网络爬虫
2.主题式网络爬虫爬取的内容与数据特征分析
如下图所示,选择爬取网页的书名、评论量、年份、出版社、价格,这些数据能对图书有一定详细的了解,具有汉字让我们了解含义也有数字让我们了解数据的关系

3.主题式网络爬虫设计方案概述(包括实现思路与技术难点)
方案是首先查看网页的数据特征分布,确定实现的方法,确定可行性,进行调试确认成功。实现的思路是首先查看发现数据在HTML静态页面中,不是在json文件中,后查看数据所在位置,思考用什么方法获取,这个网页的数据在静态网页的标签中,可以通过soup进行解析后对代码进行定义来精确找到数据所在的位置,最后获取数据,技术难点就在数据的提取过程,需要熟练掌握提取数据的方法。
三、主题页面的结构特征分析(10 分)
1.主题页面的结构与特征分析
本次爬虫选取促销榜的前一百名,url为http://bang.dangdang.com/books/bestsellers/01.00.00.00.00.00-24hours-0-0-1-1,尾数是1到5,每一页有20个图书排名。所以可以多次访问不同网页来获取一定数量的排名
2.Htmls 页面解析
先爬取网页信息
1 import requests
2 url='http://bang.dangdang.com/books/bestsellers/01.00.00.00.00.00-24hours-0-0-1-1'
3 the_url = url
4 r = requests.get(the_url)
5 r.raise_for_status()
6 r.encoding = r.apparent_encoding
7 print(r.text)
结果如下
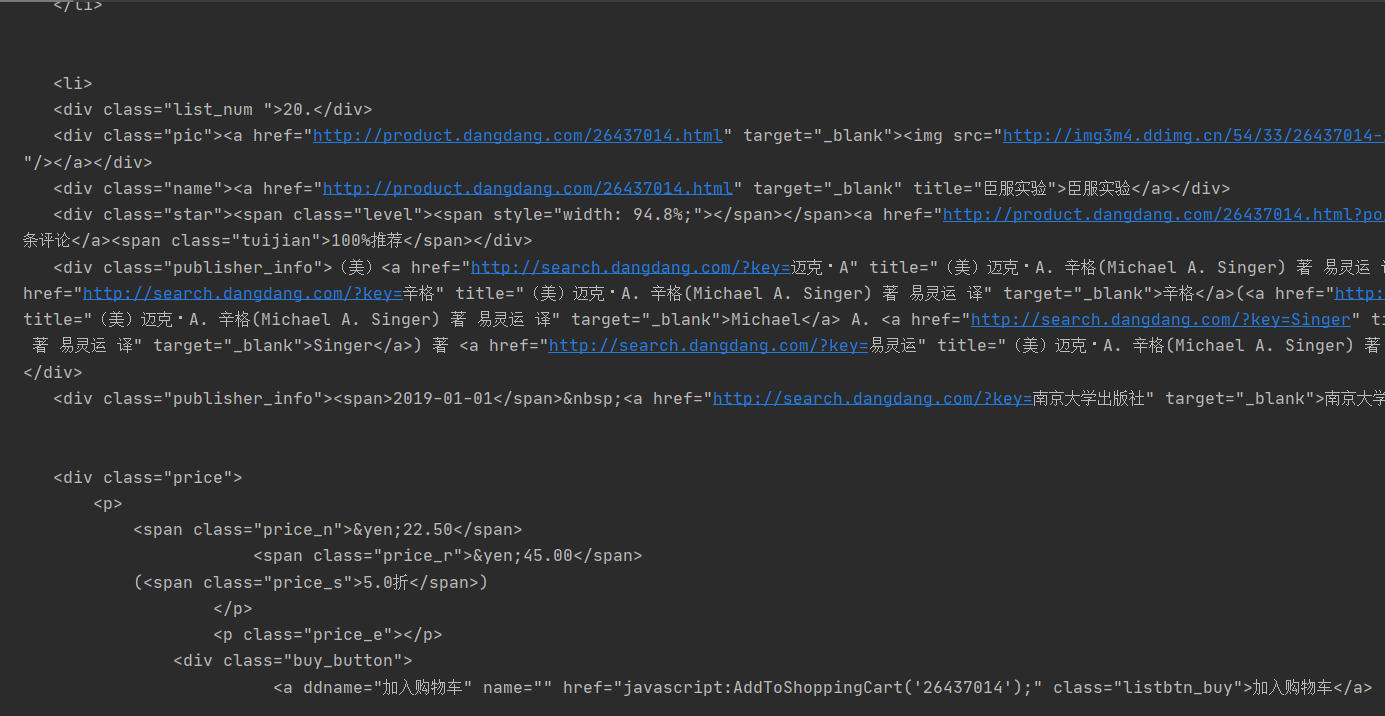
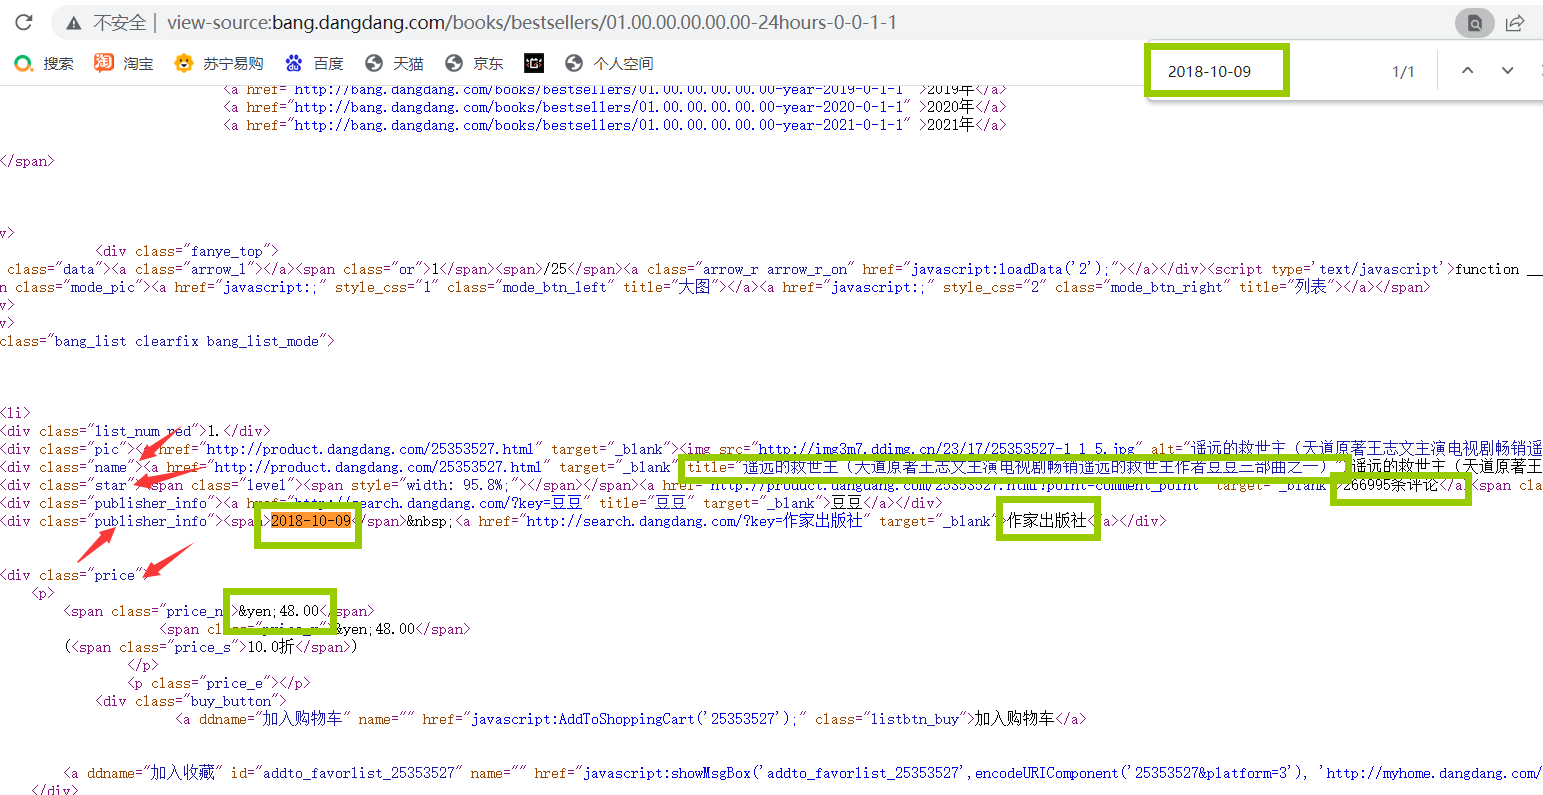
在目标网页按F12查看源码并寻找数据,对提取信息有帮助的标签进行观察确定,下图已经标明,绿色框表示提取的数据,红色箭头表示可以通过标签属性来提取的特殊标签,已经清晰表示了。
3.节点(标签)查找方法与遍历方法 (必要时画出节点树结构)
标签的结构为body下的li下的多个div标签,我们想要的数据一些在div标签下的a标签,一些在div标签下的span标签,一些在div标签下的p标签下的span标签,形成一个树形,可以根据需要进行特定查找和遍历
四、网络爬虫程序设计(60 分)
第一部分:数据爬取
  1 import requests
  2 from bs4 import BeautifulSoup
  3 import matplotlib.pyplot as plt
  4 import jieba
  5 jieba.setLogLevel(jieba.logging.INFO)
  6
  7 #获取网页信息
  8 def gethtml(url):
  9     #异常处理
 10     try:
 11         the_url=url
 12         #获取信息
 13         r= requests.get(the_url)
 14         #返回值不是200就是错误
 15         r.raise_for_status()
 16         #统一网页编码
 17         r.encoding = r.apparent_encoding
 18         return  r.text
 19     except:
 20         return '爬取失败'
 21
 22 #解析处理数据
 23 def analysis(text):
 24     #soup解析
 25     soup = BeautifulSoup(text, 'html.parser')
 26     #书名
 27     name = soup.find_all('div', attrs={'class': 'name'})
 28     for i in name:
 29         name_container.append(i.a.attrs['title'])
 30
 31     #评价数
 32     evaluate = soup.find_all('div', attrs={'class': 'star'})
 33     for i in evaluate:
 34         eva_str = i.a.string
 35         eva_num = eva_str[0:-3]
 36         evaluate_container.append(eva_num)
 37
 38     #日期
 39     publish = soup.find_all('div', attrs={'class': 'publisher_info'})
 40     target = 0
 41     for i in publish:
 42         target += 1
 43         if target % 2 == 0:
 44             date_container.append(i.span.string)
 45
 46     #出版社
 47     publish = soup.find_all('div', attrs={'class': 'publisher_info'})
 48     target2 = 0
 49     for i in publish:
 50         target2 += 1
 51         if target2 % 2 == 0:
 52             press_container.append(i.a.string)
 53
 54     #价格
 55     price = soup.find_all('div', attrs={'class': 'price'})
 56     for i in price:
 57         prices = i.p
 58         mark = 0
 59         for j in prices:
 60             mark += 1
 61             if mark == 2:
 62                 price_container.append(j.string)
 63
 64 #展示
 65 def display():
 66     grid = "{:4}\t{:8}\t{:12}\t{:18}\t{:24}\t{:30}"
 67     print(grid.format("名次", "价格", "评价数","日期","出版社", "书名"))
 68     count = 0
 69     for i in range(0,100):
 70         count = count + 1
 71         print(grid.format(count,price_container[i], evaluate_container[i], date_container[i],
 72                           press_container[i],name_container[i]))
 73
 74 #放置书名
 75 name_container=[]
 76
 77 #评价数
 78 evaluate_container=[]
 79
 80 #日期
 81 date_container=[]
 82
 83 #出版社
 84 press_container=[]
 85
 86 #价格
 87 price_container=[]
 88
 89 #主函数
 90 def main():
 91     #url模板
 92     url_templates='http://bang.dangdang.com/books/bestsellers/01.00.00.00.00.00-24hours-0-0-1-'
 93     #1-5页的排名,前100
 94     for i in range(1,6):
 95         url=url_templates+str(i)
 96         text=gethtml(url)
 97         analysis(text)
 98     #展示
 99     display()
100
101 #执行
102 if __name__ == '__main__':
103     main()
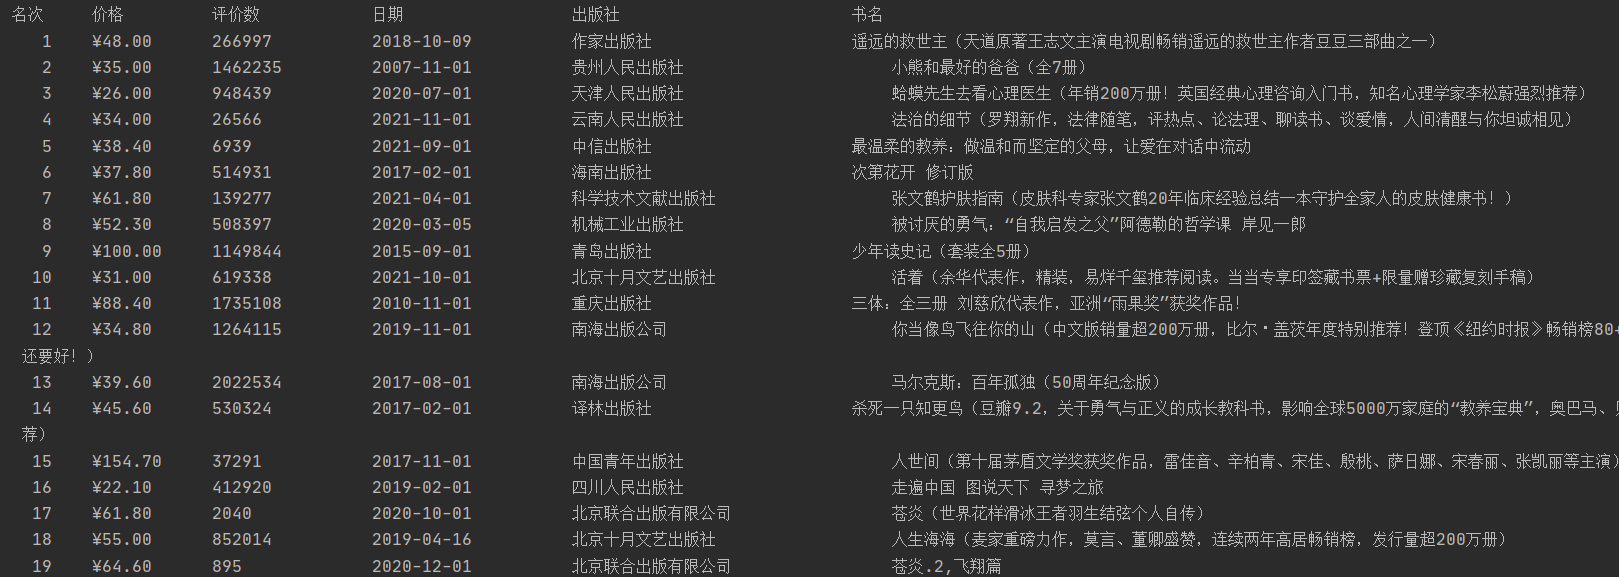
效果图如下
第二部分:词云
 1 #词云
 2
 3 jieba_container=[]
 4 #关于书名的文本字符串
 5 jieba_container_all=''
 6 #每个书名
 7 for i in name_container:
 8     list2 = ''
 9     #分词
10     jieba_container=jieba.lcut(i)
11     #每个词加入总文本
12     for j in jieba_container:
13         list2=list2+str(j)
14         list2+=' '
15     jieba_container_all+=list2
16
17 import wordcloud
18 c=wordcloud.WordCloud(width=1000,
19                       height=700,
20                       min_font_size=20,
21                       max_font_size=40,
22                       font_step=2,
23                       max_words=200,
24                       stopwords={"书"},
25                       background_color="white",
26                       font_path='D:\\SimHei.ttf'
27                       )
28 c.generate(jieba_container_all)
29 #路径
30 c.to_file("D://ddwcy.png")
效果图如下

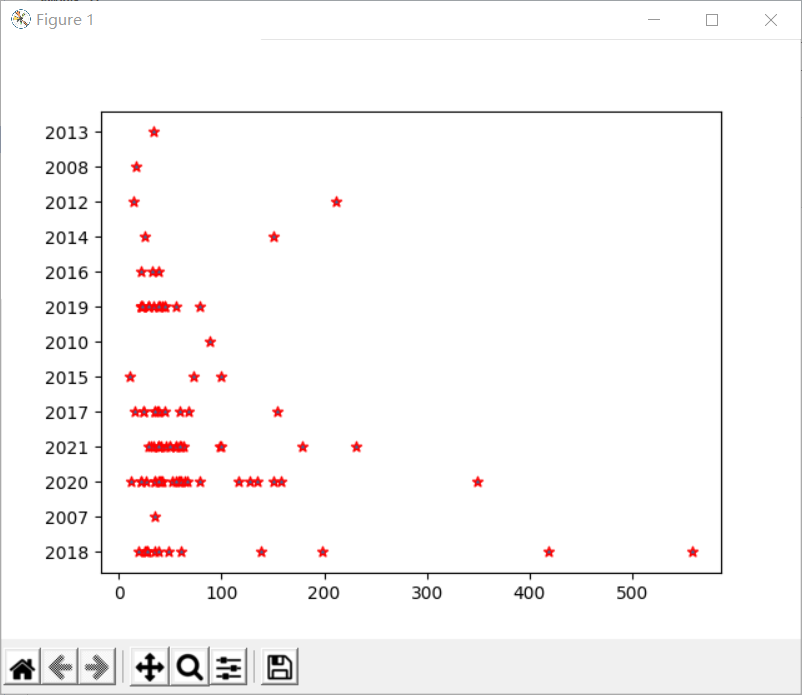
第三部分:数据分析和可视化
 1 #年份扇形
 2 year2010=0
 3 year2011=0
 4 year2012=0
 5 year2013=0
 6 year2014=0
 7 year2015=0
 8 year2016=0
 9 year2017=0
10 year2018=0
11 year2019=0
12 year2020=0
13 year2021=0
14 for i in date_container:
15     year=int(i[0:4])
16     if year<=2010:
17         year2010+=1
18     elif year==2011:
19         year2011+=1
20     elif year==2012:
21         year2012+=1
22     elif year==2013:
23         year2013+=1
24     elif year==2014:
25         year2014+=1
26     elif year==2015:
27         year2015+=1
28     elif year==2016:
29         year2016+=1
30     elif year==2017:
31         year2017+=1
32     elif year==2018:
33         year2018+=1
34     elif year==2019:
35         year2019+=1
36     elif year==2020:
37         year2020+=1
38     elif year==2021:
39         year2021+=1
40 # Matplotlib扇图
41 years=[year2010,year2011,year2012,year2013,year2014,year2015,year2016,year2017,year2018,year2019,year2020,year2021]
42 number=["2010<=","2011","2012","2013","2014","2015","2016","2017","2018","2019","2020","2021"]
43 plt.pie(x = years, labels=number)
44 plt.show()
45
46 #价格、年份散点图
47 #价格
48 x=[]
49 #年份
50 y=[]
51 for i in date_container:
52     year=i[0:4]
53     y.append(year)
54 for i in price_container:
55     price_float=float(i[1:])
56     price_int=int(price_float)
57     x.append(price_int)
58 # 用Matplotlib画散点图
59 plt.scatter(x, y,marker='*',edgecolors="red")
60 plt.show()
效果图如下:

第四部分:数据持久化
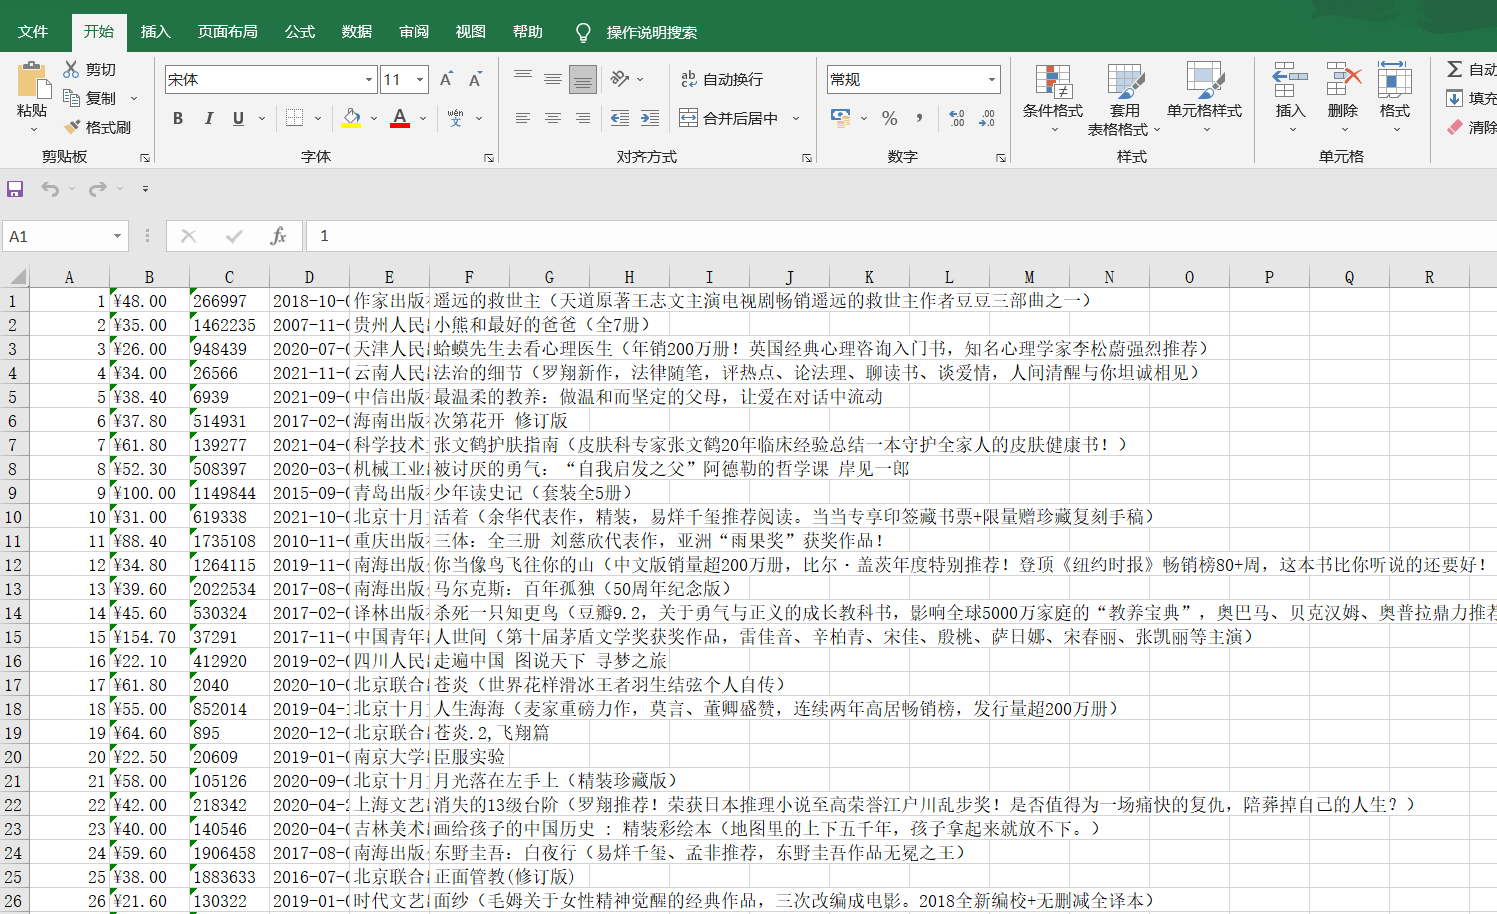
 1 #存入excel
 2 from openpyxl import Workbook
 3 W = Workbook()
 4 w= W.active
 5 data=[]
 6 count=0
 7 for i in range(0, 100):
 8     data_part = []
 9     count = count + 1
10     data_part.append(count)
11     data_part.append(price_container[i])
12     data_part.append(evaluate_container[i])
13     data_part.append(date_container[i])
14     data_part.append(press_container[i])
15     data_part.append(name_container[i])
16     data.append(data_part)
17 for i in data:
18     w.append(i)
19 #文件地址自己在save()里改
20 W.save('d://ddw.xlsx')
效果图如下:
完整代码如下
  1 import requests
  2 from bs4 import BeautifulSoup
  3 import matplotlib.pyplot as plt
  4 import jieba
  5 jieba.setLogLevel(jieba.logging.INFO)
  6
  7 #获取网页信息
  8 def gethtml(url):
  9     #异常处理
 10     try:
 11         the_url=url
 12         #获取信息
 13         r= requests.get(the_url)
 14         #返回值不是200就是错误
 15         r.raise_for_status()
 16         #统一网页编码
 17         r.encoding = r.apparent_encoding
 18         return  r.text
 19     except:
 20         return '爬取失败'
 21
 22 #解析处理数据
 23 def analysis(text):
 24     #soup解析
 25     soup = BeautifulSoup(text, 'html.parser')
 26     #书名
 27     name = soup.find_all('div', attrs={'class': 'name'})
 28     for i in name:
 29         name_container.append(i.a.attrs['title'])
 30
 31     #评价数
 32     evaluate = soup.find_all('div', attrs={'class': 'star'})
 33     for i in evaluate:
 34         eva_str = i.a.string
 35         eva_num = eva_str[0:-3]
 36         evaluate_container.append(eva_num)
 37
 38     #日期
 39     publish = soup.find_all('div', attrs={'class': 'publisher_info'})
 40     target = 0
 41     for i in publish:
 42         target += 1
 43         if target % 2 == 0:
 44             date_container.append(i.span.string)
 45
 46     #出版社
 47     publish = soup.find_all('div', attrs={'class': 'publisher_info'})
 48     target2 = 0
 49     for i in publish:
 50         target2 += 1
 51         if target2 % 2 == 0:
 52             press_container.append(i.a.string)
 53
 54     #价格
 55     price = soup.find_all('div', attrs={'class': 'price'})
 56     for i in price:
 57         prices = i.p
 58         mark = 0
 59         for j in prices:
 60             mark += 1
 61             if mark == 2:
 62                 price_container.append(j.string)
 63
 64 #展示
 65 def display():
 66     grid = "{:4}\t{:8}\t{:12}\t{:18}\t{:24}\t{:30}"
 67     print(grid.format("名次", "价格", "评价数","日期","出版社", "书名"))
 68     count = 0
 69     for i in range(0,100):
 70         count = count + 1
 71         print(grid.format(count,price_container[i], evaluate_container[i], date_container[i],
 72                           press_container[i],name_container[i]))
 73
 74 #放置书名
 75 name_container=[]
 76
 77 #评价数
 78 evaluate_container=[]
 79
 80 #日期
 81 date_container=[]
 82
 83 #出版社
 84 press_container=[]
 85
 86 #价格
 87 price_container=[]
 88
 89 #主函数
 90 def main():
 91     #url模板
 92     url_templates='http://bang.dangdang.com/books/bestsellers/01.00.00.00.00.00-24hours-0-0-1-'
 93     #1-5页的排名,前100
 94     for i in range(1,6):
 95         url=url_templates+str(i)
 96         text=gethtml(url)
 97         analysis(text)
 98     #展示
 99     display()
100
101 #执行
102 if __name__ == '__main__':
103     main()
104
105 #词云
106
107 jieba_container=[]
108 #关于书名的文本字符串
109 jieba_container_all=''
110 #每个书名
111 for i in name_container:
112     list2 = ''
113     #分词
114     jieba_container=jieba.lcut(i)
115     #每个词加入总文本
116     for j in jieba_container:
117         list2=list2+str(j)
118         list2+=' '
119     jieba_container_all+=list2
120
121 import wordcloud
122 c=wordcloud.WordCloud(width=1000,
123                       height=700,
124                       min_font_size=20,
125                       max_font_size=40,
126                       font_step=2,
127                       max_words=200,
128                       stopwords={"书"},
129                       background_color="white",
130                       font_path='D:\\SimHei.ttf'
131                       )
132 c.generate(jieba_container_all)
133 #路径
134 c.to_file("D://ddwcy.png")
135
136 #年份扇形
137 year2010=0
138 year2011=0
139 year2012=0
140 year2013=0
141 year2014=0
142 year2015=0
143 year2016=0
144 year2017=0
145 year2018=0
146 year2019=0
147 year2020=0
148 year2021=0
149 for i in date_container:
150     year=int(i[0:4])
151     if year<=2010:
152         year2010+=1
153     elif year==2011:
154         year2011+=1
155     elif year==2012:
156         year2012+=1
157     elif year==2013:
158         year2013+=1
159     elif year==2014:
160         year2014+=1
161     elif year==2015:
162         year2015+=1
163     elif year==2016:
164         year2016+=1
165     elif year==2017:
166         year2017+=1
167     elif year==2018:
168         year2018+=1
169     elif year==2019:
170         year2019+=1
171     elif year==2020:
172         year2020+=1
173     elif year==2021:
174         year2021+=1
175 # Matplotlib扇图
176 years=[year2010,year2011,year2012,year2013,year2014,year2015,year2016,year2017,year2018,year2019,year2020,year2021]
177 number=["2010<=","2011","2012","2013","2014","2015","2016","2017","2018","2019","2020","2021"]
178 plt.pie(x = years, labels=number)
179 plt.show()
180
181 #价格、年份散点图
182 #价格
183 x=[]
184 #年份
185 y=[]
186 for i in date_container:
187     year=i[0:4]
188     y.append(year)
189 for i in price_container:
190     price_float=float(i[1:])
191     price_int=int(price_float)
192     x.append(price_int)
193 # 用Matplotlib画散点图
194 plt.scatter(x, y,marker='*',edgecolors="red")
195 plt.show()
196
197 #存入excel
198 from openpyxl import Workbook
199 W = Workbook()
200 w= W.active
201 data=[]
202 count=0
203 for i in range(0, 100):
204     data_part = []
205     count = count + 1
206     data_part.append(count)
207     data_part.append(price_container[i])
208     data_part.append(evaluate_container[i])
209     data_part.append(date_container[i])
210     data_part.append(press_container[i])
211     data_part.append(name_container[i])
212     data.append(data_part)
213 for i in data:
214     w.append(i)
215 #文件地址自己在save()里改
216 W.save('d://ddw.xlsx')
五、总结(10 分)
1.经过对主题数据的分析与可视化,可以得到哪些结论?是否达到预期的目标?
在词云中我们看到最多的词是孩子,经典,世界等,看出群体大多是小孩子,从扇形图可以看出畅销榜的书籍一般是年份距离比较近的,在散点图看出价格发布多数在0-100区间的,在excel文档中我们能看见排行单,确认受欢迎的好书,已经达到预期目标
2.在完成此设计过程中,得到哪些收获?以及要改进的建议?
本次爬虫作业了解了许多好书,以及年份价格之间的一定关系和最大群体,改进的地方是需要学习更多数据分析的方法来获得数据中的更多奥义

 浙公网安备 33010602011771号