配置altermanager监控告警项(prometheus)-从零到无
--时间:2020年9月15日
--作者:飞翔的小胖猪
概述
前言
在使用prometheus对linux主机进行监控,除了通过granfana使用图形界面查看数据结合自己的运维经验判断各个指标数值从而实现对现网设备的掌握。但是通过图形界面的方式查看数据往往是一项比较繁杂的工作,大多数的情况是通过选择性的找出特定的关键指标配置好对应的altermanager告警通过webbook或其他方式直接推送出来实时的提示相关运维人员。本文只对linux操作的相关指标获取及altermanger配置进行说明不对win操作系统进行讲解。从指标选取到具体配置会逐一说明,如有疑问可以私信本人,期待共同进步。
该文章以后我会持续更新
指标
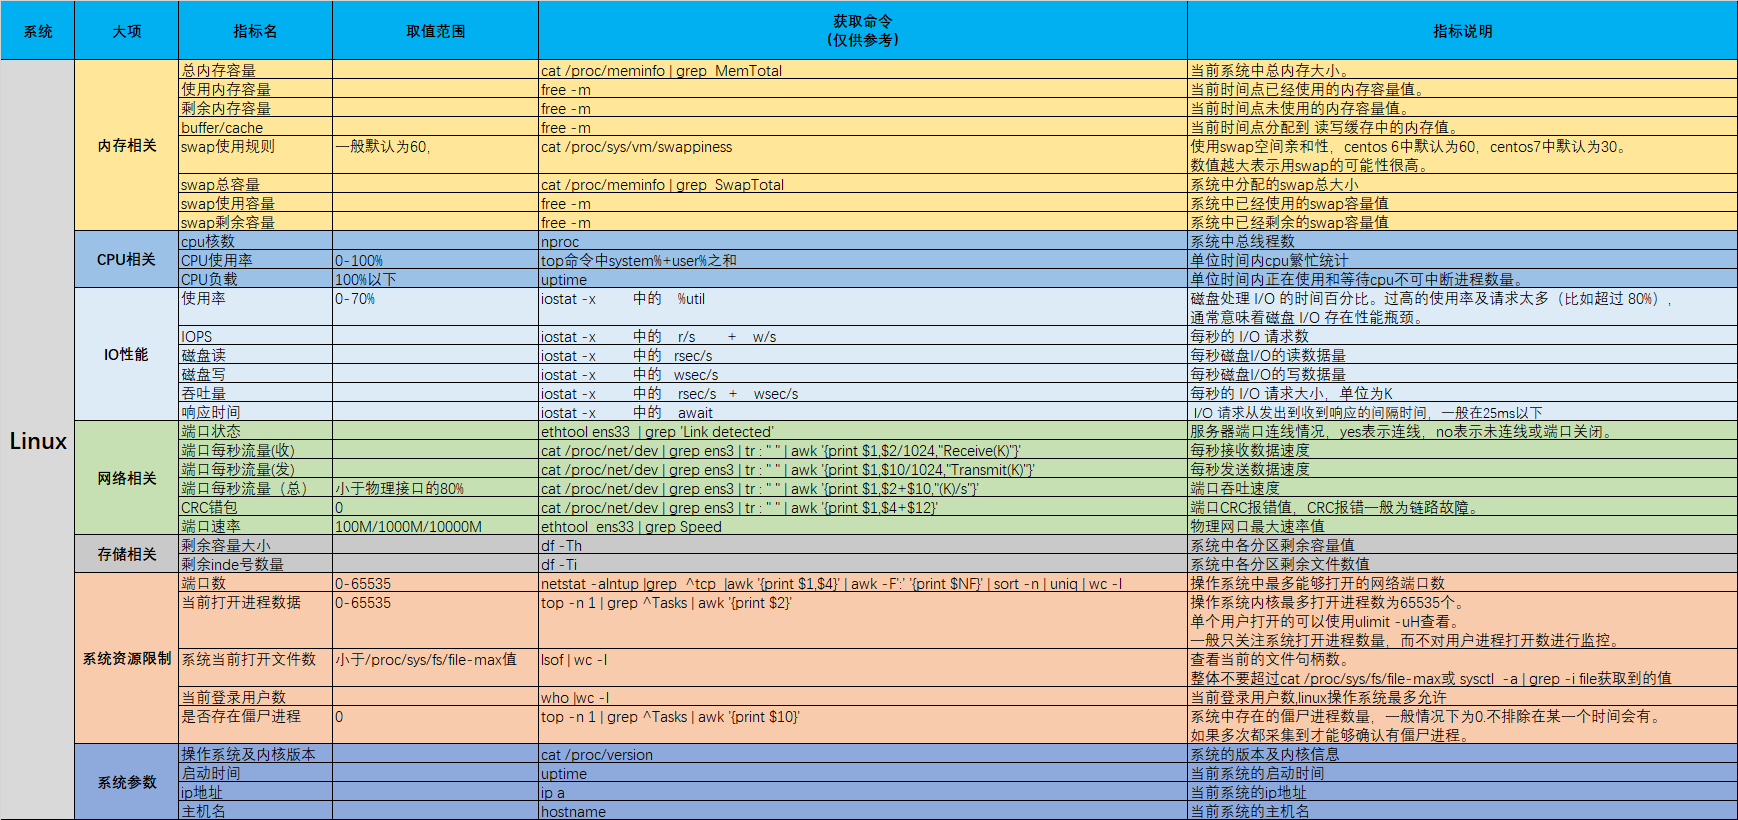
对于Linux操作系统我们主要关注其中几个常用的指标,也是我日常工作中用到比较多的指标。按照大类可划分为七大类:内存、CPU、IO、网络、存储、资源、系统。
由于我对prometheus还不是太熟,以下列出来的参数只是平时工作常使用参数。还不能在prometheus中对以下参数进行提取。该文章以后我会持续更新。
Prometheus指标
由于本人对prometheus理解有限,暂只监控告警如下内容:
主机up/down状态:up{instance=~"10|80|192.*"} == 0
CPU使用率:100 - ((avg by (instance,job,env)(irate(node_cpu_seconds_total{mode="idle"}[30s]))) *100) > 90
内存使用率:((node_memory_MemTotal_bytes -(node_memory_MemFree_bytes+node_memory_Buffers_bytes+node_memory_Cached_bytes) )/node_memory_MemTotal_bytes ) * 100 > 90
磁盘使用率:100 - (node_filesystem_free_bytes{fstype=~"ext3|ext4|xfs"} / node_filesystem_size_bytes{fstype=~"ext3|ext4|xfs"} * 100) > 95
配置
配置prometheus告警需要配置prometheus.yml、自定义的rule.yml、alertmanager.yml三个配置文件。
配置顺序步骤:
1.配置prometheus.yml文件。
2.根据在prometheus.yml中定义的rule_files:选项配置告警规则文件。
3.配置altermanger部件的alertmanger.yml。
4.重启prometheus和altermanger软件。
prometheus配置
读者请根据自己实际情况复制修改配置文件,主要的点在alerting:和rule_files:两个选项。
prometheus.yml文件简述:从192.168.111.83中consul提取node_exporter数据,设置alert规则文件在rules/node_alerts.yml中,并设置推送告警信息至192.168.111.83的alertmanger软件。
# cat prometheus.yml
# my global config
global:
  scrape_interval:     15s # Set the scrape interval to every 15 seconds. Default is every 1 minute.
  evaluation_interval: 15s # Evaluate rules every 15 seconds. The default is every 1 minute.
  # scrape_timeout is set to the global default (10s).

# Alertmanager configuration
alerting:
  alertmanagers:
  - static_configs:
    - targets:
      # - alertmanager:9093
       - 192.168.111.83:9093     #设置告警信息推送目的地


#remote_write:
    #- url: "http://192.168.111.96:8086/api/v1/prom/write?db=prometheus_db&u=prometheus_user&p=12345678"

#remote_read:
    #- url: "http://192.168.111.96:8086/api/v1/prom/read?db=prometheus_db&u=prometheus_user&p=12345678"


# Load rules once and periodically evaluate them according to the global 'evaluation_interval'.
rule_files:     #alert告警规则文件定义选项(很重要,本实验的重点)
  # - "first_rules.yml"
  # - "second_rules.yml"
   - "rules/node_alerts.yml"   #具体的alter规则文件路径,此处使用的是相对路径,rules/node_alerts.yml表示和在prometheus.yml文件同级目录下的rules目录下的node_alerts.yml文件。

# A scrape configuration containing exactly one endpoint to scrape:
# Here it's Prometheus itself.
scrape_configs: #此处是数据来源,本文的数据来源是consul中来的。
  # The job name is added as a label `job=<job_name>` to any timeseries scraped from this config.
  #  - job_name: 'prometheus'
  #  static_configs:
  #  - targets: ['localhost:9090']
  - job_name: 'consul_111_83'  #设置数据源名字
    consul_sd_configs:  #设置具体数据来源,prometheus通过192.168.111.83:8500提取consul从客户端node_exporter中抓取的数据。
    - server: '192.168.111.83:8500'  #具体的数据来源地址
      services: []
    relabel_configs:  #设置只获取特定标签node_exporter中的数据,实验中只提取__meta_consul_tags标签中含有test字符串的节点数据。
    - source_labels: [__meta_consul_tags]  #设置标签名,从哪个标签中提取数据
      regex: .*test.*  #匹配标签中含有test中的值得数据
      action: keep    #匹配过后的规则设置为保留。
alert_rules规则文件配置
在定义的alert_rules配置文件中,根据之前定义的四个指标填入到alert_rules文件中。
注:再次提示一下,此处的alert_rules规则文件是在prometheus软件下编写。具体的文件名是之前在prometheus.yml中rule_files:自己定义的,切记,切记。
groups:
- name: node_instance   #设置告警名,自定义
  rules:
  - alert: InstanceDown      #设置告警信息名,自定义。
    expr: up{instance=~"10|80|192.*"} == 0   #设置只检测ip开头为10、80、192网段的地址,可以按照你的实际情况删除{}及其中的内容,只保留up == 0。
    for: 1m  #设置告警时间为1分钟。
    labels:
      severity: critical   #设置告警等级
    annotations:
      description: Host {{ $labels.instance }} Down   #设置描述信息,{{ $labels.instance }}表示数据来源及端口。如 192.168.111.1主机down掉了,此处就会显示192.168.111.1:9100
      summary: Host {{ $labels.instance }} of {{ $labels.job }} is  Down !!!   #详细的告警信息,自定义。
- name: cpu_used     #设置cpu使用告警参数选项,该处名字自定义。
  rules:
  - alert: Cpu_used_Hight  #自定义告警类型名
    expr: 100 - ((avg by (instance,job,env)(irate(node_cpu_seconds_total{mode="idle"}[30s]))) *100) > 90  #定义CPU使用率高于90%时告警,CPU使用率和uptime中看到的CPU负载有一定的差距。
    for: 1m
    labels:
      severity: critical
    annotations:
      description: Host {{ $labels.instance }} Excessive Cpu utilization
      summary: Host {{ $labels.instance }} of {{ $labels.job }} Excessive Cpu utilization !!!
- name: mem_used
  rules:
  - alert: Men_used_Hight
    expr: ((node_memory_MemTotal_bytes -(node_memory_MemFree_bytes+node_memory_Buffers_bytes+node_memory_Cached_bytes) )/node_memory_MemTotal_bytes ) * 100 > 90 #设置内存使用率高于90时发送告警,计算方式为 总内存-空闲内存 - buffers - cached
    for: 1m
    labels:
      severity: critical
    annotations:
      description: Host {{ $labels.instance }} Excessive Memory utilization
      summary: Host {{ $labels.instance }} of {{ $labels.job }} Excessive Memory utilization !!!
- name: disk_used
  rules:
  - alert: Disk_used_Hight
    expr: 100 - (node_filesystem_free_bytes{fstype=~"ext3|ext4|xfs"} / node_filesystem_size_bytes{fstype=~"ext3|ext4|xfs"} * 100) > 95  #设置挂载分区使用率为95以上时告警
    for: 1m
    labels:
      severity: critical
    annotations:
      description: Host {{ $labels.instance }} Excessive Disk utilization
      summary: Host {{ $labels.instance }} of {{ $labels.job }} Excessive Disk utilization !!!
alter软件配置
在altermanger软件中修改alertmanager.yml配置文件。
global:
  resolve_timeout: 5m

route:
  group_by: ['instance']
  group_wait: 10s
  group_interval: 20s
  repeat_interval: 20s
  #repeat_interval: 1h
  receiver: 'webhook'   #指定接收名,这个参数必须要和receivers中找到一致的数据项。
receivers:
- name: 'webhook'
  webhook_configs:
  - url: 'http://192.168.111.83:5000/send'   #由于我写了一个简单小脚本接收数据所以此处把告警直接发送到192.168.111.83:5000中。可以参考我另一篇文档。https://www.cnblogs.com/Pigs-Will-Fly/p/13361527.html
重启软件
以下为linux命令,非脚本

# pkill prometheus      #kill prometheus软件进程
# ss -alntup | grep -i 9090   #查看确认9090端口是否GG,该条命令没有输出表示进程杀死成功
# prometheus --config.file="/usr/local/prometheus/prometheus.yml" --storage.tsdb.retention.time=90d &> /dev/null &   #启动prometheus软件,指定配置文件设置数据保留时间为90天
# ss -alntup | grep -i 9090   #确认9090端口是否启动,此时命令应该有输出。

# pkill alertmanager    #kill alertmanager软件进程
# ss -alntup | grep -i 9093  #查看确认9093端口是否GG,该条命令没有输出表示进程杀死成功
# alertmanager --config.file=/usr/local/alertmanager/alertmanager.yml --cluster.advertise-address=0.0.0.0:9093 &> /dev/null &  #启动alertmanager软件指定配置文件设置监听为0.0.0.0:9093
# ss -alntup | grep -i 9093  #确认9093段鸥是否启动,此时命令应该有输出。
测试
本文针对4种监控告警方式提供4中不同的检测方式,由于我设置的告警提示是20秒提示一次,所有在演示的时候看到的告警就有点频繁,读者可以按照自己的实际情况设置告警间隔时间。
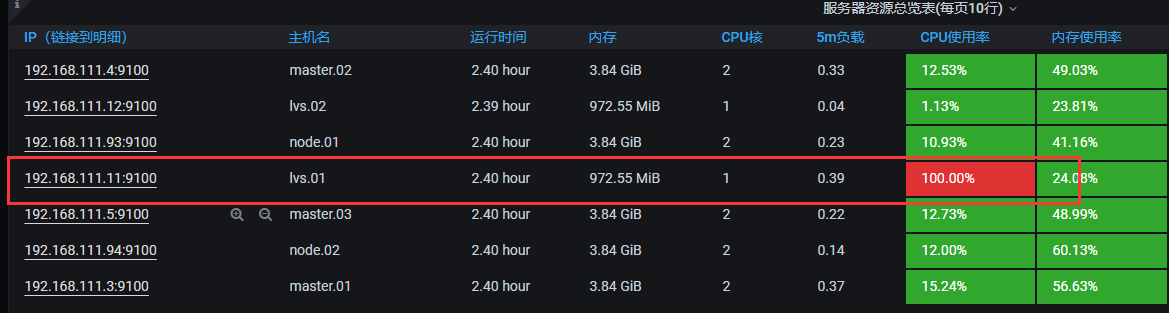
CPU测试
说明:下载stress软件,如果你Linux系统总的CPU线程有1个,那么设置测试的CPU一定要超过这个值。一般设置为2-3倍。
命令: stress --cpu 3 --timeout 6000
granfan截图:
python接收截图:

其中 firing表示告警信息生成。 resolved表示告警恢复。
内存测试
说明:下载memtester软件,根据你实际的内存量设置合适的内存测试值,如你的主机有10G,那么按照设置告警的规则为90才告警,你可以设置测试内存为9.5G。测试单位有B K M G自选。
命令:memtester 900M
granfan截图:

python接收截图:

测试的时候由于内存占用过大,所以一并触发了CPU告警。
磁盘测试
说明:实验新挂一张小盘,使用dd命令创建一个大文件,文件一定要占用新盘的95%以上的存储空间。
命令:dd if=/dev/zero of=/tester/test11 bs=1024K count=1900
granfan截图:

python接收截图:

规则文件还有一点小问题,导致异常告警。
主机up/down测试
说明:直接对一个监控节点进行关机操作,但是有一个问题prometheus监控是通过客户端的9100端口监控数据,一旦9100端口不通也会触发节点down告警。
命令:halt -p
python接收截图:


 浙公网安备 33010602011771号