
vue中Echarts的使用-自选效果
由于项目要求使用数据图,于是我选择了我们的Echarts用来实现效果
一:全局安装Echarts
npm install echarts --save(这个安装的是最新的版本有时候回报init未定义)这个时候可以使用低版本npm install --save echarts@4.1.0我是用的4.1.0
二:在所需echarts的页面中引入Echarts
import echarts from "echarts";
三:按照这个步骤以此移入自己选择的Echarts配置
export default {
  name: "",
  data() {
    return {};
  },
  mounted() {
    this.drawLine(); // 调用绘图函数
  },
  methods: {
    drawLine() {
      // 初始化
      let myCharts = echarts.init(this.$refs.myCharts);
    //  let myChart = echarts.init(document.getElementById('myChart'));
    //   写配置
      let option = {
        xAxis: {
          type: "category",
          data: ["Mon", "Tue", "Wed", "Thu", "Fri", "Sat", "Sun"],
        },
        yAxis: {
          type: "value",
        },
        series: [
          {
            data: [820, 932, 901, 934, 1290, 1330, 1320],
            type: "line",
            smooth: true,
          },
        ],
      };

      // 使用配置生成报表
      myCharts.setOption(option);
    },
  },
};
有时候会出现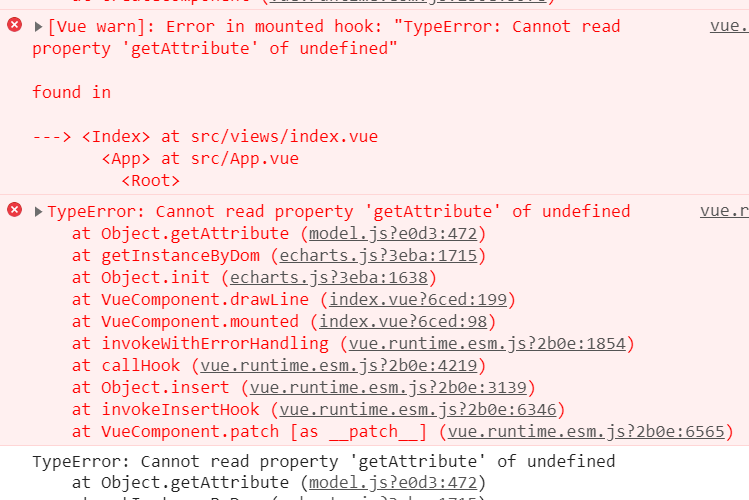 可以尝试一下使用
一:
mounted() {
this.$nextTick(() => {
this.drawLine();
});
}
二:
  mounted() {
    setTimeout(() => {
      this.drawLine(); // 调用绘图函数
    }, 1000);
  },

 浙公网安备 33010602011771号