vuecli项目导入echarts
使用步骤:
安装echarts:
cnpm install echarts --save
在main.js插入语句:(echarts 5版本使用的语句)
import * as echarts from "echarts";

Vue.prototype.$echarts = echarts
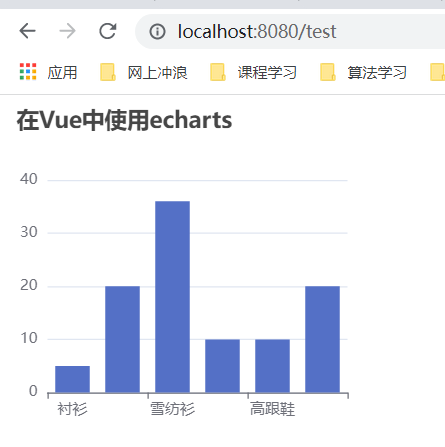
写一个Test组件测试使用
<template>
<div>
  <div id="myChart" :style="{width: '300px', height: '300px'}"></div>
</div>
</template>

<script>
export default {
  name: 'hello',
  data () {
    return {
      msg: 'Welcome to Your Vue.js App'
    }
  },
  mounted(){
    this.drawLine();
  },
  methods: {
    drawLine(){
      // 基于准备好的dom,初始化echarts实例
      let myChart = this.$echarts.init(document.getElementById('myChart'))
      // 绘制图表
      myChart.setOption({
        title: { text: '在Vue中使用echarts' },
        tooltip: {},
        xAxis: {
          data: ["衬衫","羊毛衫","雪纺衫","裤子","高跟鞋","袜子"]
        },
        yAxis: {},
        series: [{
          name: '销量',
          type: 'bar',
          data: [5, 20, 36, 10, 10, 20]
        }]
      });
    }
  }
}
</script>

<style scoped>

</style>
成功使用:

 浙公网安备 33010602011771号