
编写SpringMVC自定义Prometheus监控指标
一、前言
上一篇文章中,我已经详细介绍了Prometheus的起源、架构、工作流程,以及如何基于SpringBoot编写自定义监控指标的内容(文章链接:https://www.cnblogs.com/MrChao/articles/12074927.html),因此本文我们将不再对Prometheus的一些常见基础问题进行赘述,直接进入今天的主题——基于JMX开发tomcat的Prometheus自定义监控指标。
二、JMX_Export介绍
我们知道,Prometheus监控数据的主要来源就是 和各个target绑定运行的Export程序。它的工作方式是 监控应用服务的Export进程(也可能是一个独立的服务)需要公开一个HTTP接口的端点,该端点用来收集并公开度量的列表和当前的值;Prometheus Server采集程序则定期从此接口拉取数据并存放在时序数据库中,然后通过可视化的Dashboard(例如Grafana)进行数据展示。在SpringBoot应用中,Spring官方提供的Actuator监控平台就已经默认提供了Prometheus监控的端点,我们只需要添加micrometer的支持就可以方便地对SpringBoot应用进行相关的监控。但是,如果的应用程序不是SpringBoot程序,而是传统的SpringMVC、Struts或者是使用了更加古老的框架技术开发的应用,那么我门可能就需要借助另外一款 Prometheus官方已经为我们开发好的指标收集程序——JMX_Export了。
该项目的地址是:https://github.com/prometheus/jmx_exporter
这里请允许我先对JMX技术做一个简单的介绍,因为这会对我们理解后面的自定义指标开发很有帮助。
JMX的全称是Java Management Extensions。顾名思义,它是管理Java的一种扩展。它提供了一种可以方便地管理、监控运行中Java程序的机制。通常被用于管理线程,内存,日志Level,服务重启,系统环境等场景。下面是官方提供的JMX架构图:

可以看到JMX的架构共分为三层,分别是:Remote Managent Level、Agent Level和Probe Level。
·首先Probe层表示一个个MBean(Managed Bean),在JMX中MBean代表一个被管理的资源实例,通过MBean中暴露的方法和属性,外界可以获取被管理的资源的状态和操纵MBean的行为。事实上,MBean就是一个Java Object,同JavaBean模型一样,外界使用内省和反射来获取Object的值和调用Object的方法,只是MBean更为复杂和高级一些。MBean通过公共方法以及遵从特定的设计模式封装了属性和操作,以便暴露给管理应用程序。例如,一个只读属性在管理构件中只有Get方法,既有Get又有Set方法表示是一个可读写的属性。常见的MBean有以下五种:Standard MBean,Dynamic MBean,Open MBean,Model MBean和MXBeans。
·然后Agent层就是一个MBeanServer,它是一个专门用于MBean对象注册和管理的代理服务组件。MBean注册到MBeanServer后,MBeanServer就可以代理外界对它们的访问,外界可以通过名字得到对应的MBean实例。需要注意的是,通常情况下MBeanServer都会以一个Java Agent的形式运行起来,可以简单理解为它就是一个独立的Java线程,可以放在main线程之前或之后执行,同时我们也需要为这个Java Agent单独分配一个端口号,专门用于与外界进行交互。
·最后是Remote Managent,它一般就是我们常用的一些JVM监控工具,比如JConsole(当然也支持web管理方式)。我们一般通过使用JConsole去连接Agent层中暴露的端口,从而查看应用进程(如tomcat)中暴露出来的一个个MBean信息,最终实现对远端进程的监控和管理。
那么,说了这么多,这和我们的JMX_Export又有什么关系呢?我相信,到这里大部分的小伙伴应该都已经明白了。其实JMX_Export就是一个以Java Agent的形式和我们应用系统一同启动的程序。比如我们的应用系统是一个SpringMVC程序,当我们将应用部署到tomcat并启动时,JMX_Export就会随tomcat一同启动,并监听在设定的某一个端口上;然后我们就通过JConsole去连接该agent端口,就可通过JConsole的界面查看到Tomcat中暴露的各种MBean信息了。如下图:
(注意:如果你的JConsole连接的是远程tomcat,请在Catalina.sh脚本的JAVA_OPTS变量后追加以下虚拟机参数:-Dcom.sun.management.jmxremote=true -Djava.rmi.server.hostname=192.168.3.112 -Dcom.sun.management.jmxremote.port=9099 -Dcom.sun.management.jmxremote.ssl=false -Dcom.sun.management.jmxremote.authenticate=false,ip和port配置成自己的)

那么如何让JMX_Export随我们的应用进程tomcat一同启动的呢?其实很简单,就是在我们启动tomcat的Catalina.sh脚本中追加这样一个参数 :-javaagent:$TOMCAT_HOME/lib/jmx_prometheus_javaagent-0.12.0.jar=7171:$TOMCAT_HOME/conf/promConfig.yaml,如图:
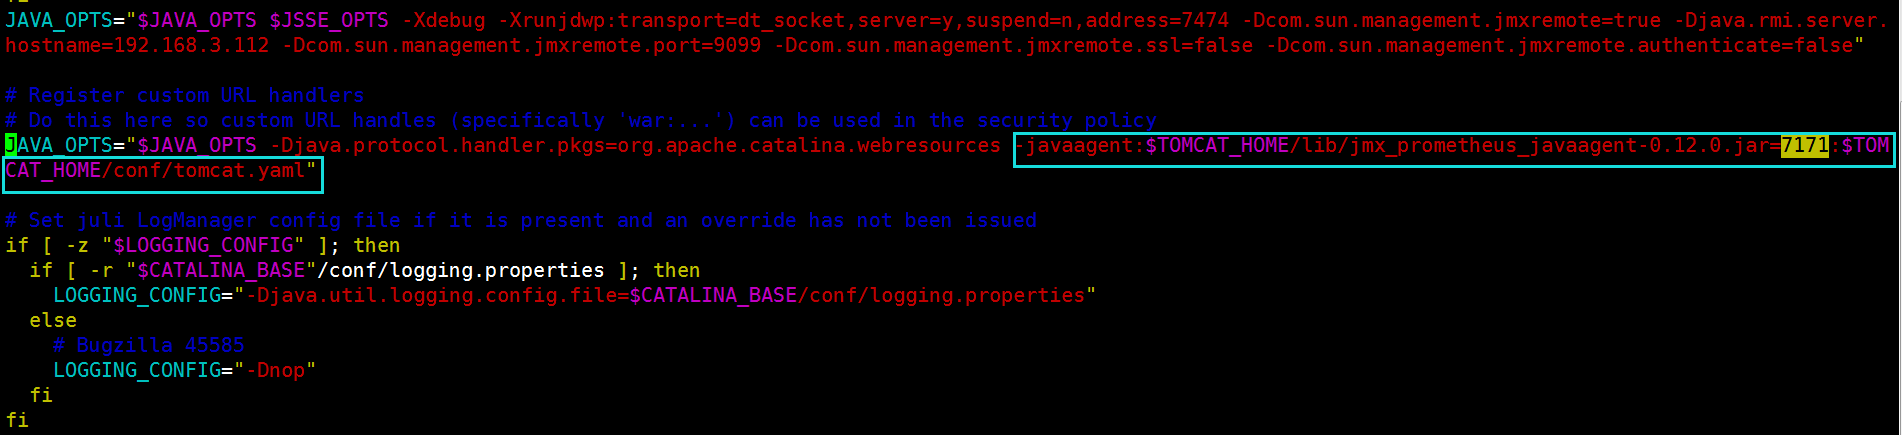
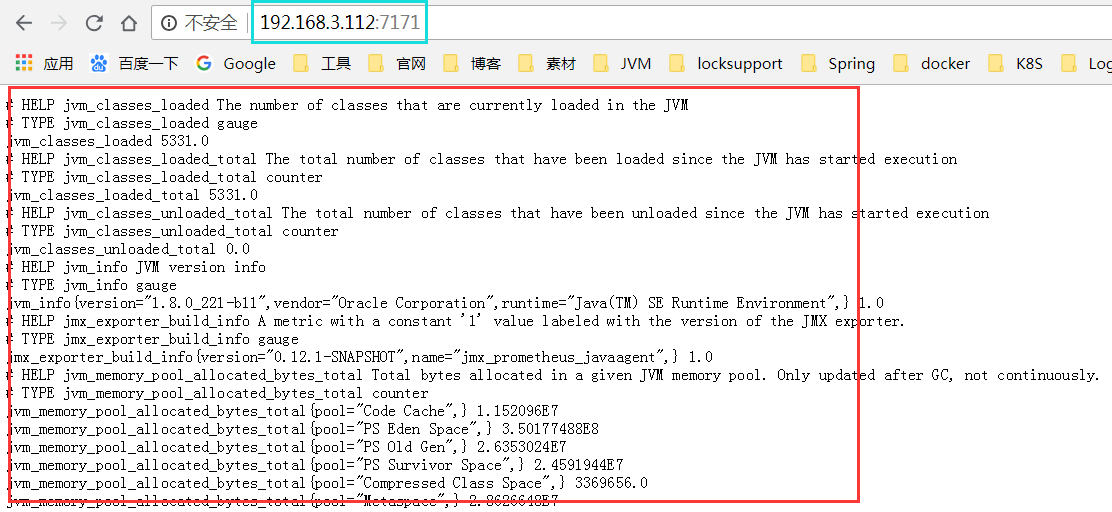
该参数的意思是将JMX_Export(jmx_prometheus_javaagent-0.12.0.jar包)以Agent方式运行(注意:$TOMCAT_HOME是我本地自定义的环境变量),并监听7171端口,暴露MBean的配置文件路径为:$TOMCAT_HOME/conf/promConfig.yaml。当应用正常启动后,我们通过浏览器去访问http://${IP}:7171便可以查看到通过JMX_Export暴露的监控数据了。如下图:
【这里需要提一嘴的是,添加在Catalina.sh脚本启动命令中的agent参数,里面有一项是指定暴露MBean配置文件的路径:$TOMCAT_HOME/conf/promConfig.yaml。JMX_Export官方针对不同的中间件(如tomcat、kafka、activeMQ等等)都给出了一份配置demo,比如tomcat的配置链接:https://github.com/prometheus/jmx_exporter/blob/master/example_configs/tomcat.yml。官方在GitHub上对其中的每一个配置项都给出了详细的说明,本文也不再赘述,这里只做一下简要的补充说明。
①即该配置文件的主要作用就是配置需要暴露和需要排除的MBean,因为像Tomcat这样的中间件默认情况下会暴露非常多的MBean,但并不是每一个都是我们需要的,所以这里的配置就可以对MBean进行正则匹配,只暴露我们需要的一些MBean信息;
②其次就是配置规则的说明(这里以tomcat.yaml为例),
- pattern: 'Catalina<type=GlobalRequestProcessor, name=\"(\w+-\w+)-(\d+)\"><>(\w+):'
name: tomcat_$3_total
labels: port: "$2"
protocol: "$1" help:
Tomcat global $3
type: COUNTER
这里的$1、$2、$3就是依次获取- pattern: 'Catalina<type=GlobalRequestProcessor, name=\"(\w+-\w+)-(\d+)\"><>(\w+):'配置中"()"中正则表达式匹配到的具体值,,比如$1获取(\w+-\w+)匹配到的值,$2获取(\d+)匹配到的值,依次下去;
③因为我们后面会介绍如何基于JMX开发自定义的Prometheus监控指标,在开发过程中,为了方便起见,这里建议暴露所有MBean信息,即JMX_Export使用如下配置:
---
lowercaseOutputLabelNames: true
lowercaseOutputName: true
rules:
- pattern: '.*'
表示暴露所有MBean信息,并不对任何指标信息做格式优化。
】
三、需求与设计
到这里,我相信大部分的小伙伴对JMX和JMX_Export的工作原理已经有了一个不错的理解了。那么既然Prometheus就是通过收集JMX_Export暴露Tomcat内置的各种MBean信息来做到系统状态监控的,那么我门能不能自己也去编写一个MBean,然后通过JMX_Export把它暴露出去,并由Prometheus收集起来,从而实现对应用的某一种状态进行监控呢?答案是:当然可以!
需求:以SpringMVC项目为例,下面我们计划开发以下三个监控指标:①各个http接口的调用次数;②各个http接口请求错误次数;③各个http接口在30秒内请求平均耗时。
设计:以需求③为例。因为需要获取的是各个http接口的调用信息,所以这里使用Spring拦截器去开发;需要获取30秒每一个接口的平均请求时间,则需要先获取每一个接口在30秒内所有请求的总耗时,然后通过 请求总耗时/请求总次数 即可得到30秒内的平均耗时;存储结构设计:ConcurrentHashMap<String, ConcurrentLinkedQueue<Long>>(即 String表示各个http请求名称,ConcurrentLinkedQueue表示请求时间队列,单位是Long——毫秒),申请两个该类型的存储结构,每隔30秒轮换使用,停止使用的存储对象由一个定时任务线程清算数据并计算平均耗时,然后将计算得到的平均耗时通过MBean暴露出去,等待Prometheus拉取、存储和展示。代码流程设计图如下:

四、指标开发
第一步:
IDEA新建SpringBoot根模块custom-prome-tomcat;
在custom-prome-tomcat中分别新建模块custom-prome-springmvc和模块custom-prome-test,其中custom-prome-springboot模块用于封装自定义指标拦截器,custom-prome-test模块用于测试;
custom-prome-springmvc的pom.xml添加Spring相关依赖,内容如下:
  1 <?xml version="1.0" encoding="UTF-8"?>
  2 <project xmlns="http://maven.apache.org/POM/4.0.0"
  3          xmlns:xsi="http://www.w3.org/2001/XMLSchema-instance"
  4          xsi:schemaLocation="http://maven.apache.org/POM/4.0.0 http://maven.apache.org/xsd/maven-4.0.0.xsd">
  5     <modelVersion>4.0.0</modelVersion>
  6     <packaging>jar</packaging>
  7
  8     <parent>
  9         <artifactId>custom-prome-tomcat</artifactId>
 10         <groupId>com.custom.prome</groupId>
 11         <version>0.0.1-SNAPSHOT</version>
 12     </parent>
 13
 14     <groupId>com.custom.prome</groupId>
 15     <artifactId>custom-prome-springmvc</artifactId>
 16     <version>0.0.1-SNAPSHOT</version>
 17
 18     <properties>
 19         <java.version>1.8</java.version>
 20         <servlet.version>3.0.1</servlet.version>
 21         <resources.encoding>UTF-8</resources.encoding>
 22         <spring.version>4.3.13.RELEASE</spring.version>
 23         <maven.compiler.version>3.5.1</maven.compiler.version>
 24         <maven.resources.version>2.4.3</maven.resources.version>
 25     </properties>
 26
 27     <dependencies>
 28         <!-- spring核心包 -->
 29         <dependency>
 30             <groupId>org.springframework</groupId>
 31             <artifactId>spring-core</artifactId>
 32             <version>${spring.version}</version>
 33         </dependency>
 34         <dependency>
 35             <groupId>org.springframework</groupId>
 36             <artifactId>spring-context</artifactId>
 37             <version>${spring.version}</version>
 38         </dependency>
 39         <dependency>
 40             <groupId>org.springframework</groupId>
 41             <artifactId>spring-context-support</artifactId>
 42             <version>${spring.version}</version>
 43         </dependency>
 44         <dependency>
 45             <groupId>org.springframework</groupId>
 46             <artifactId>spring-web</artifactId>
 47             <version>${spring.version}</version>
 48         </dependency>
 49         <dependency>
 50             <groupId>org.springframework</groupId>
 51             <artifactId>spring-webmvc</artifactId>
 52             <version>${spring.version}</version>
 53         </dependency>
 54         <dependency>
 55             <groupId>org.springframework</groupId>
 56             <artifactId>spring-tx</artifactId>
 57             <version>${spring.version}</version>
 58         </dependency>
 59         <dependency>
 60             <groupId>org.springframework</groupId>
 61             <artifactId>spring-aop</artifactId>
 62             <version>${spring.version}</version>
 63         </dependency>
 64         <dependency>
 65             <groupId>javax.servlet</groupId>
 66             <artifactId>javax.servlet-api</artifactId>
 67             <version>${servlet.version}</version>
 68             <scope>provided</scope>
 69         </dependency>
 70     </dependencies>
 71
 72     <build>
 73         <finalName>Custom-prome-springmvc</finalName>
 74         <plugins>
 75             <!-- 代码编译插件 -->
 76             <plugin>
 77                 <groupId>org.apache.maven.plugins</groupId>
 78                 <artifactId>maven-compiler-plugin</artifactId>
 79                 <version>${maven.compiler.version}</version>
 80                 <configuration>
 81                     <source>${java.version}</source>
 82                     <target>${java.version}</target>
 83                     <encoding>${resources.encoding}</encoding>
 84                 </configuration>
 85             </plugin>
 86             <!-- 资源拷贝插件 -->
 87             <plugin>
 88                 <groupId>org.apache.maven.plugins</groupId>
 89                 <artifactId>maven-resources-plugin</artifactId>
 90                 <version>${maven.resources.version}</version>
 91                 <executions>
 92                     <execution>
 93                         <phase>compile</phase>
 94                     </execution>
 95                 </executions>
 96                 <configuration>
 97                     <encoding>${resources.encoding}</encoding>
 98                 </configuration>
 99             </plugin>
100         </plugins>
101     </build>
102
103 </project>
第二步:编写MBean类
package com.custom.prome.mbean;

import java.util.HashMap;
import java.util.Map;
import java.util.concurrent.ConcurrentHashMap;
import java.util.concurrent.atomic.AtomicLong;

/**
 * 该类将暴露为MBean,用于监控RequestCountInterceptor中的数据
 */
public class RequestCountInterceptorMBean {
    /**
     * 已经处理好的每个URL请求的平均时间
     */
    public static Map<String,Double> avgTime = new HashMap<>();
    /**
     * 每个URL访问的次数--需要通过MBean暴露出去---存在并发操作,需要使用AtomicLong
     */
    public static Map<String, AtomicLong> countOfEveryRequest = new ConcurrentHashMap<>();
    /**
     * 每个URL请求错误次数--需要通过MBean暴露出去---存在并发操作,需要使用AtomicLong
     */
    public static Map<String, AtomicLong> errorCount = new ConcurrentHashMap<>();
    /**
     * 以下方法用于MBean暴露出去,只暴露getter方法
     */
    public Map<String, Double> getAvgTime() {
        return avgTime;
    }
    public Map<String, Long> getCountOfEveryRequest() {
        Map<String,Long> count4MBean = new HashMap<>();
        for (Map.Entry<String, AtomicLong>  dataEntry: countOfEveryRequest.entrySet()) {
            count4MBean.put(dataEntry.getKey(), dataEntry.getValue().longValue());
        }
        return count4MBean;
    }
    public Map<String, Long> getErrorCount() {
        Map<String,Long> count4MBean = new HashMap<>();
        for (Map.Entry<String, AtomicLong>  dataEntry: errorCount.entrySet()) {
            count4MBean.put(dataEntry.getKey(), dataEntry.getValue().longValue());
        }
        return count4MBean;
    }
    public void resetCountOfEveryRequest() {
        for (Map.Entry<String,AtomicLong> dataEntry: countOfEveryRequest.entrySet()) {
            countOfEveryRequest.put(dataEntry.getKey(), new AtomicLong(0L));
        }
    }

}
第三步:编写自定义指标拦截器
package com.custom.prome.interceptor;

import com.custom.prome.mbean.RequestCountInterceptorMBean;
import com.custom.prome.util.MyProperty;
import org.springframework.web.servlet.HandlerInterceptor;
import org.springframework.web.servlet.ModelAndView;

import javax.servlet.http.HttpServletRequest;
import javax.servlet.http.HttpServletResponse;
import java.util.Map;
import java.util.concurrent.*;
import java.util.concurrent.atomic.AtomicLong;

/**
 * @Date 2019-11-30
 * @author create by JC
 * @implNote MVC拦截器,用于统计每个URL的访问次数、访问失败次数、30秒内平均响应时间等
 */
public class RequestCountInterceptor implements HandlerInterceptor {
    /**
     * 任务睡眠时间,建议睡眠2秒钟
     */
    private static final int TASK_SlEEP_TIME = 2;
    /**
     * 每个URL访问的时间,分为A池B池两个容器
     */
    private static final Map<String, ConcurrentLinkedQueue<Long>> timePoolOfEveryRequest_A = new ConcurrentHashMap<>() ;
    private static final Map<String, ConcurrentLinkedQueue<Long>> timePoolOfEveryRequest_B = new ConcurrentHashMap<>() ;
    /**
     * 获取指挥员实例(单例)
     */
    private static final PoolExchanger poolExchanger = PoolExchanger.getInstance();
    private static final ThreadLocal<Long> requestBeanThreadLocal = new ThreadLocal<>();
    @Override
    public boolean preHandle(HttpServletRequest request, HttpServletResponse response, Object handler) {
        if(RequestCountInterceptorMBean.countOfEveryRequest.get(request.getRequestURI()) == null){
            RequestCountInterceptorMBean.countOfEveryRequest.put(request.getRequestURI(), new AtomicLong(0L));
        }
        requestBeanThreadLocal.set(System.currentTimeMillis());
        return true;
    }
    @Override
    public void postHandle(HttpServletRequest request, HttpServletResponse response, Object handler, ModelAndView modelAndView) {
        Map<String, ConcurrentLinkedQueue<Long>> timePoolOfEveryRequest = poolExchanger.getTimePoolOfEveryRequest();
        ConcurrentLinkedQueue<Long> timePool = timePoolOfEveryRequest.get(request.getRequestURI());
        //如果还没有的话,先放一个进去(池子存在替换问题,所以不能在preHandle()中先放入,否则postHandle()可能取到空值)
        if(timePool == null){
            timePool = new ConcurrentLinkedQueue<>();
            timePoolOfEveryRequest.put(request.getRequestURI(), timePool);
        }
        //将URL访问消耗时间放进去
        timePool.add(System.currentTimeMillis() - requestBeanThreadLocal.get());
        //业务流程处理结束后会执行该方法,在这里请求数加一
        AtomicLong count_atomic = RequestCountInterceptorMBean.countOfEveryRequest.get(request.getRequestURI());
        count_atomic.incrementAndGet();
    }

    @Override
    public void afterCompletion(HttpServletRequest request, HttpServletResponse response, Object handler, Exception ex) {
        System.out.println("end");
        //统计错误请求
        if(ex != null){
            String requestURI = request.getRequestURI();
            if(RequestCountInterceptorMBean.errorCount.get(requestURI) == null){
                RequestCountInterceptorMBean.errorCount.put(requestURI, new AtomicLong(1L));
                return;
            }
            RequestCountInterceptorMBean.errorCount.get(requestURI).incrementAndGet();
        }
    }
    public static PoolExchanger getPoolExchanger(){
        return RequestCountInterceptor.poolExchanger;
    }
    public static ThreadLocal getRequestBeanThreadLocal(){
        return RequestCountInterceptor.requestBeanThreadLocal;
    }
    /**
     * 定时指挥员类,专为内部使用
     */
    public static class PoolExchanger{
        //使用 A/B池 的指挥员
        private volatile boolean flagMan = false;
        //切换 A/B池 的定时器
        private static ScheduledExecutorService exchangerExecutor = null;
        private static PoolExchanger poolExchanger = new PoolExchanger();
        public static PoolExchanger getInstance(){return PoolExchanger.poolExchanger;}
        private PoolExchanger(){
            exchangerExecutor = Executors.newSingleThreadScheduledExecutor();
            exchangerExecutor.scheduleAtFixedRate(() -> {
                //long startTime = System.currentTimeMillis();
                Map<String, ConcurrentLinkedQueue<Long>> timePoolOfEveryRequest_notUse;
                //System.out.println("定时器执行,当前获取:"+(flagMan?"A池":"B池"));
                //先翻转状态,表示立即停止正在使用的池,很重要!
                if(flagMan){
                    flagMan = false;
                }else {
                    flagMan = true;
                }
                //这里睡眠2秒钟,避免有部分线程没有完成ConcurrentLinkedQueue.add()操作
                try {
                    TimeUnit.SECONDS.sleep(RequestCountInterceptor.TASK_SlEEP_TIME);
                    timePoolOfEveryRequest_notUse = getTimePoolOfEveryRequest(!flagMan);
                    //开始清算停用的池子中的数据
                    handleData(timePoolOfEveryRequest_notUse);
                    //清算完数据后,把所有数据清掉
                    timePoolOfEveryRequest_notUse.clear();
                } catch (Exception e) { throw new RuntimeException("数据统计异常!"+e); }
                //long costTime = System.currentTimeMillis() - startTime - 2000;
                //System.out.println("数据统计结束,耗时:"+costTime+"ms");
            }, 0, MyProperty.FLASH_TIME, TimeUnit.SECONDS);
        }
        public Map<String, ConcurrentLinkedQueue<Long>> getTimePoolOfEveryRequest(){
            //System.out.println("当前状态:"+(flagMan?"A池":"B池")+"生效,"+(!flagMan?"A池":"B池")+"空闲");
            return flagMan?timePoolOfEveryRequest_A:timePoolOfEveryRequest_B;
        }
        public ScheduledExecutorService getExchangerExecutor(){return PoolExchanger.exchangerExecutor;}
        private Map<String, ConcurrentLinkedQueue<Long>> getTimePoolOfEveryRequest(boolean flagMan){
            //System.out.println("当前状态:"+(flagMan?"A池":"B池")+"生效,"+(!flagMan?"A池":"B池")+"空闲");
            return flagMan?timePoolOfEveryRequest_A:timePoolOfEveryRequest_B;
        }
        /**
         * 统计监控数据方法,这里的逻辑是统计每个URL30秒内的平均响应时间
         */
        private void handleData(Map<String, ConcurrentLinkedQueue<Long>> timePoolOfEveryRequest){
            Long dataSum = 0L;
            //先清空上一次的数据,再写入新数据
            RequestCountInterceptorMBean.avgTime.clear();
            for (Map.Entry<String,ConcurrentLinkedQueue<Long>>  dataEntry: timePoolOfEveryRequest.entrySet()) {
                ConcurrentLinkedQueue<Long> dataList = dataEntry.getValue();
                for (Long data: dataList) {
                    dataSum += data;
                }
                //一个URL请求的平均时间
                double avgTime =  dataSum/dataList.size();
                RequestCountInterceptorMBean.avgTime.put(dataEntry.getKey(), avgTime);
            }
        }
    }

}
第四步:编写Spring的Java配置类
说明:该配置主要有两个作用:
①向Spring的Bean工厂注入拦截器实例,就是我们第三步编写的RequestCountInterceptor 类;
②通过Spring对JMX的支持接口向tomcat中内置的MBeanServer注册自定义MBean。
这里要重点说明一下,Spring对JMX的支持包含两种方式,即编程和注解,通过这两种方式我们就可以很方便地将Spring Bean导出为MBean,从而实现管理、监控和配置运行中的应用进程。首先说一下注解的方式,Spring提供了几个核心的注解用于导出MBean:
@ManagedResource 用于类上,表示该类江北导出为MBean;
@ManagedAttribute 用于方法上,表示将属性暴露为MBean的托管属性,在getter上标注表示该托管属性可读,在setter上标注表示该托管属性可写;
@ManagedOperation 用于方法上,表示将标注的方法暴露为MBean托管操作,即在外部可以调用方法执行;
使用上述注解暴露MBean时,需要在spring.xml中添加标签<context:mbean-export server="mbeanServer"></context:mbean-export> 或Java配置类上添加注@EnableMBeanExport(server="mbeanServer")以打开JMX注解功能。
虽然使用注解的方式可以方便的将一个Spring Bean导出为MBean,但笔者在真正使用时却发现了一些问题,比如Spring在获取MBeanServer时并不能获取Tomcat内置的mbeanServer对象,从而导致MBean无法注册;如果你采用标签或注解重新声明一个MBeanServer,那么当你使用JConsole去连接tomcat时又无法获取重新声明的MBeanServer实例。经过源码跟踪和多番尝试后,笔者决定采用编程的方式进行MBean的暴露,虽然这稍微麻烦一些,但切实可行!
编程的方式就是通过public MBeanExporter mbeanExporter() {}方法来暴露MBean(如下文红色代码部分),通过public MethodNameBasedMBeanInfoAssembler assembler() {}来过滤MBean中的指定方法,从而实现暴露MBean的指定字段(如下文蓝色代码部分,需要注意的是要排除Object中的默认方法)。
通过以上所述,我们现在就可以通过编程的方式将我们已经编写好的MBean类RequestCountInterceptorMBean中的一些字段和属性暴露出去了,代码如下:
需要注意的就是,以下红色代码中的黑色部分就是MBean暴露的名称,这里是Custom-PromeInterceptor:type=httprequest,name=urlstatistic,这将用于JMX_Export的监控数据解析。
package com.custom.prome.config;


import com.custom.prome.interceptor.RequestCountInterceptor;
import com.custom.prome.mbean.RequestCountInterceptorMBean;
import com.custom.prome.util.MyProperty;
import org.springframework.context.annotation.Bean;
import org.springframework.context.annotation.Configuration;
import org.springframework.jmx.export.MBeanExporter;
import org.springframework.jmx.export.assembler.MethodNameBasedMBeanInfoAssembler;
import org.springframework.web.servlet.config.annotation.EnableWebMvc;
import org.springframework.web.servlet.config.annotation.InterceptorRegistration;
import org.springframework.web.servlet.config.annotation.InterceptorRegistry;
import org.springframework.web.servlet.config.annotation.WebMvcConfigurerAdapter;

import java.lang.reflect.Method;
import java.util.ArrayList;
import java.util.HashMap;
import java.util.List;
import java.util.Map;

@EnableWebMvc
@Configuration
public class JmxJavaConfig extends WebMvcConfigurerAdapter {

    @Bean
    public RequestCountInterceptor requestCountInterceptor(){
        return new RequestCountInterceptor();
    }

    @Override
    public void addInterceptors(InterceptorRegistry registry) {
        InterceptorRegistration interceptorRegistration = registry.addInterceptor(requestCountInterceptor());
        interceptorRegistration.addPathPatterns("/**");
        interceptorRegistration.excludePathPatterns(MyProperty.resourcesSuffix);
    }

    @Bean
    public RequestCountInterceptorMBean requestCountInterceptorMBean(){
        return new RequestCountInterceptorMBean();
    }

    @Bean
    public MethodNameBasedMBeanInfoAssembler assembler() {
        MethodNameBasedMBeanInfoAssembler assembler = new MethodNameBasedMBeanInfoAssembler();
        RequestCountInterceptorMBean requestCountInterceptorMBean = requestCountInterceptorMBean();
        Class clazz = requestCountInterceptorMBean.getClass();
        Method[] methodz = clazz.getMethods();
        List<String> methodNames = new ArrayList<>();
        for (int i = 0; i < methodz.length; i++) {
            String methodName = methodz[i].getName();
            if(!MyProperty.defaultMethods.contains(methodName)){
                methodNames.add(methodName);
            }
        }
        String[] names = new String[methodNames.size()];
        for (int i = 0; i < methodNames.size(); i++) {
            names[i] = methodNames.get(i);
        }
        assembler.setManagedMethods(names);
        return assembler;
    }
    @Bean
    public MBeanExporter mbeanExporter() {
        MBeanExporter exporter = new MBeanExporter();
        Map<String, Object> beans = new HashMap<>();
     //此处请格外注意,Custom-PromeInterceptor:type=httprequest,name=urlstatistics就是我们暴露的MBean的名称
        beans.put("Custom-PromeInterceptor:type=httprequest,name=urlstatistics", requestCountInterceptorMBean());
        exporter.setBeans(beans);
        exporter.setAssembler(assembler());
        return exporter;
    }
}
阶段总结:以上四步我们就通过SpringMVC拦截器编写出了一个自定义监控指标类,并通过使用了Spring JMX进行托管。下面我们只需要将该模块发布出去,并在其他需要接入该监控指标模块的项目中进行pom引用,即可完成自定义监控指标的接入。
第五步:编写测试模块
package com.custom.prome.controller;

import org.springframework.web.bind.annotation.RequestMapping;
import org.springframework.web.bind.annotation.RestController;

import java.util.concurrent.atomic.AtomicLong;

@RestController
@RequestMapping("/hello")
public class Hello {
    //用于计数
    private AtomicLong count = new AtomicLong(0);

    @RequestMapping("get")
    public String getCount() {
        return count.intValue()+"";
    }

    @RequestMapping("add")
    public String setCount() {
        return count.incrementAndGet()+"";
    }

    @RequestMapping("reset")
    public String reset() {
        count.set(0);
        int i = 1/0;
        return "重置操作,当前值:"+count.intValue();
    }
}
并在custom-prome-test的pom.xml中添加依赖:
<?xml version="1.0" encoding="UTF-8"?>
<project xmlns="http://maven.apache.org/POM/4.0.0"
         xmlns:xsi="http://www.w3.org/2001/XMLSchema-instance"
         xsi:schemaLocation="http://maven.apache.org/POM/4.0.0 http://maven.apache.org/xsd/maven-4.0.0.xsd">
    <modelVersion>4.0.0</modelVersion>
    <packaging>war</packaging>

    <parent>
        <artifactId>custom-prome-tomcat</artifactId>
        <groupId>com.custom.prome</groupId>
        <version>0.0.1-SNAPSHOT</version>
    </parent>

    <groupId>com.custom.prome</groupId>
    <artifactId>custom-prome-test</artifactId>
    <version>0.0.1-SNAPSHOT</version>

    <dependencies>
        <dependency>
            <groupId>com.custom.prome</groupId>
            <artifactId>custom-prome-springmvc</artifactId>
            <version>0.0.1-SNAPSHOT</version>
        </dependency>
    </dependencies>

    <build>
        <finalName>prome-test</finalName>
        <plugins>
            <!-- 编译插件 -->
            <plugin>
                <groupId>org.apache.maven.plugins</groupId>
                <artifactId>maven-compiler-plugin</artifactId>
                <version>3.5.1</version>
                <configuration>
                    <source>1.8</source>
                    <target>1.8</target>
                    <encoding>UTF-8</encoding>
                </configuration>
            </plugin>
            <!-- 设置资源文件的编码方式 -->
            <plugin>
                <groupId>org.apache.maven.plugins</groupId>
                <artifactId>maven-resources-plugin</artifactId>
                <version>2.4.3</version>
                <executions>
                    <execution>
                        <phase>compile</phase>
                    </execution>
                </executions>
                <configuration>
                    <encoding>UTF-8</encoding>
                </configuration>
            </plugin>
            <plugin>
                <groupId>org.apache.maven.plugins</groupId>
                <artifactId>maven-war-plugin</artifactId>
                <version>2.3</version>
                <configuration>
                    <webResources>
                        <resource>
                            <filtering>true</filtering>
                            <directory>src/main/webapp</directory>
                            <includes>
                                <include>**/web.xml</include>
                            </includes>
                        </resource>
                    </webResources>
                    <warSourceDirectory>src/main/webapp</warSourceDirectory>
                    <webXml>src/main/webapp/WEB-INF/web.xml</webXml>
                </configuration>
            </plugin>
        </plugins>
    </build>
</project>
注:custom-prome-test的springmvc-servlet.xml和web.xml配置省略。
然后将项目打成war包并发布至tomcat中,启动tomcat后,通过http://192.168.3.112:8080/hello/${controller}分别对三个测试接口进行访问。
第六步:使用JConsole查看MBean
使用JConsole连接tomcat进程,即可看到访问测试接口/prome-test/hello/add次数为13,访问测试接口/prome-test/hello/add次数为26;
/prome-test/hello/add接口30秒内的平均耗时是3.0毫秒,/prome-test/hello/get接口30秒内的平均耗时是2.0毫秒。

前提:已在Catalina.sh脚本的JAVA_OPTS变量后追加-Dcom.sun.management.jmxremote=true -Djava.rmi.server.hostname=192.168.3.112 -Dcom.sun.management.jmxremote.port=9099 -Dcom.sun.management.jmxremote.ssl=false -Dcom.sun.management.jmxremote.authenticate=false虚拟机参数
第七步:通过JMX_Export端点查看暴露的监控数据
打开浏览器,访问:http://192.168.3.112:7171即可查看通过JMX_Export端点暴露的自定义监控数据。红色部分表示接口访问次数,绿色部分表示30秒内接口访问耗时
1 # HELP Custom_promeinterceptor_httprequest_countofeveryrequest countOfEveryRequest (Custom-PromeInterceptor<type=httprequest, name=urlstatistics, countofeveryrequest_key=/prome-test/hello/get><>CountOfEveryRequest)
2 # TYPE Custom_promeinterceptor_httprequest_countofeveryrequest untyped
3 Custom_promeinterceptor_httprequest_countofeveryrequest{name="urlstatistics",countofeveryrequest_key="/prome-test/hello/get",} 13.0
4 Custom_promeinterceptor_httprequest_countofeveryrequest{name="urlstatistics",countofeveryrequest_key="/prome-test/hello/add",} 26.0
5 # HELP Custom_promeinterceptor_httprequest_avgtime avgTime (Custom-PromeInterceptor<type=httprequest, name=urlstatistics, avgtime_key=/prome-test/hello/get><>AvgTime)
6 # TYPE Custom_promeinterceptor_httprequest_avgtime untyped
7 Custom_promeinterceptor_httprequest_avgtime{name="urlstatistics",avgtime_key="/prome-test/hello/get",} 2.0
8 Custom_promeinterceptor_httprequest_avgtime{name="urlstatistics",avgtime_key="/prome-test/hello/add",} 3.0
五、总结
本文主要介绍了基于Spring JMX开发Prometheus的监控指标,核心思想就是通过MBean去暴露拦截器中捕获的访问监控数据,然后通过JMX_Export进行解析并通过指定端点暴露出去,即可实现自定义指标监控指标的开发。需要注意的是,自定义指标的名称(这里是Custom-PromeInterceptor:type=httprequest,name=urlstatistics)是可以通过JConsole链接看到的;其次,由于JMX_Export默认情况下并不支持解析Map类型的数据结构,所以很多情况下我们还需要对JMX_Export进行一些二次开发,去添加支持我们自己定义的一些结构化数据。我们在这里其实已经对JMX_Export进行了少量的二次开发工作,主要就是添加了对Map类型数据的解析操作,但笔者并没有在本文对该细节进行展开说明,主要就是因为本文的核心是介绍开发自定义监控指标的思想,没必要在细枝末节上花费大量篇幅。笔者已经将修改过的JMX_Export项目和自定义监控指标项目都上传至了GitHub,如有童鞋对该项目存在疑问或是想深入研究该项目源码,则请自行通过项目连接下载项目运行并查看相关结果。
二次开发后的JMX_Export:https://github.com/JCACJY/jmx_export_custom
自定义监控指标custom-prome-tomcat:https://github.com/JCACJY/custom-prome-tomcat

 浙公网安备 33010602011771号