

ECharts 常用统计图
ECharts 常用统计图
一、地图
1、代码实现
//地图调用
getDetailsMap("echartsMap", map_qu_name, map_qu_num, "人数", sName);

//地图JS
function getDetailsMap(v_id, map_name, map_num, dw, v_name, ratio) {
    var myChart = echarts.init(document.getElementById(v_id));
    myChart.clear();

    var mapName = [];  //地区名字
    for (var i = 0; i < map_name.length; i++) {
        mapName.push({
            name: map_name[i],
            value: map_num[i],
            label: {
                normal: {
                    show: true,
                    formatter: function (params) {
                        return ratio ? params.name+"\n"+ params.value + "%" : params.name+"\n"+ params.value; //地图上展示文字 + 数值
                    },
                }
            },
            itemStyle: {
                normal: {
                    areaColor: {
                        x: 0,
                        y: 0,
                        x2: 0,
                        y2: 1,
                        colorStops: [{
                            offset: 0,
                            color: '#073684' // 0% 处的颜色
                        }, {
                            offset: 1,
                            color: '#061E3D' // 100% 处的颜色
                        }],
                    },
                    borderColor: '#4ce2ff',
                    borderWidth: 1,
                },
                emphasis: {
                    areaColor: {
                        x: 0,
                        y: 0,
                        x2: 0,
                        y2: 1,
                        colorStops: [{
                            offset: 0,
                            color: '#073684' // 0% 处的颜色
                        }, {
                            offset: 1,
                            color: '#061E3D' // 100% 处的颜色
                        }],
                    },
                }
            }
        })
    }

    //若涉及市州下区县展示,需下载相应JSON文件
    var url;
    if(v_name == '吉林省'){
        url = '../../workspace/jy/leaderviewjl/json/jilinnew.json';
    } else if (v_name == '2201') {
        url = '../../workspace/jy/leaderviewjl/json/changchun.json';
    } else if (v_name == '2202') {
        url = '../../workspace/jy/leaderviewjl/json/jilinshi.json';
    } else if (v_name == '2203') {
        url = '../../workspace/jy/leaderviewjl/json/siping.json';
    } else if (v_name == '2204') {
        url = '../../workspace/jy/leaderviewjl/json/liaoyuan.json';
    } else if (v_name == '2205') {
        url = '../../workspace/jy/leaderviewjl/json/tonghua.json';
    } else if (v_name == '2206') {
        url = '../../workspace/jy/leaderviewjl/json/baishan.json';
    } else if (v_name == '2207') {
        url = '../../workspace/jy/leaderviewjl/json/songyuan.json';
    } else if (v_name == '2208') {
        url = '../../workspace/jy/leaderviewjl/json/baicheng.json';
    } else if (v_name == '2224') {
        url = '../../workspace/jy/leaderviewjl/json/yanbian.json';
    }

    $.get(url, function (geoJson) {
        // myChart.hideLoading();
        echarts.registerMap('jilin', geoJson);

        myChart.setOption(option = {
            tooltip: {
                trigger: 'item',
                formatter: ratio ? '{b}<br/>' + dw + ':{c}%' : '{b}<br/>' + dw + ':{c}人'
            },
            geo: {
                map: 'jilin',
                zoom: 1.1,
                roam: false,
                itemStyle: {
                    normal: {
                        areaColor: '#013C62',
                        shadowColor: '#182f68',
                        shadowOffsetX: 0,
                        shadowOffsetY: 25
                    },
                    emphasis: {
                        areaColor: '#2AB8FF',
                        borderWidth: 0,
                        color: 'green',
                        label: {
                            show: false
                        }
                    }
                }
            },
            series: [
                {
                    type: 'map',
                    roam: false,
                    mapType: 'jilin',
                    geoIndex: 1,
                    aspectScale: 0.75, //长宽比
                    zoom: 1.1,
                    showLegendSymbol: false, // 存在legend时显示
                    label: {
                        normal: {
                            show: true,
                            textStyle: {
                                fontSize: 16,
                                color: '#fff',
                                fontFamily: 'cursive'
                            }
                        },
                        emphasis: {//对应的鼠标悬浮效果
                            show: true,
                            textStyle: {
                                fontSize: 22,
                                color: "#fff",
                                fontFamily: 'cursive'
                            }
                        }
                    },
                    itemStyle: {
                        normal: {
                            borderColor: '#2ab8ff',
                            borderWidth: 1,
                            areaColor: '#12235c'
                        },
                        emphasis: {
                            areaColor: '#2AB8FF',
                            borderWidth: 2,
                            color: 'green'
                        }
                    },
                    data: mapName
                }
            ]
        });
    });

    //地图点击事件
    myChart.on('click', function (param) {
        var selected = param.name;
        if (selected) {
            switch (selected) {
                case '长春市':
                    break;
                case '吉林市':
                    break;
                case '四平市':
                    break;
                case '辽源市':
                    break;
                case '通化市':
                    break;
                case '白山市':
                    break;
                case '松原市':
                    break;
                case '白城市':
                    break;
                case '延边朝鲜族自治州':
                    break;
                case selected:
                    break;
            }
        }
    });
}
2、地图效果图

二、折线图(也可当柱状图-单条)
1、代码实现
//折线图调用
getBarY("chartsLine", "", line_name, line_num, 'line', '8%', '2.5%', '4%', '20%', colorList, false);

//柱状图-单条调用
getBarY("chartsBar", "", line_name, line_num, 'bar', '8%', '2.5%', '4%', '20%', colorList, false);
//折线图JS
function getBarY(v_id, v_title, v_data_name, v_data_cnt, v_type, v_x, v_x2, v_y, v_y2, colorList, isShowZoom) {
    var myChart = echarts.init(document.getElementById(v_id));
    myChart.clear();

    option = {
        title: {
            text: '',
            subtext: ''
        },
        tooltip: {
            trigger: 'axis',
            axisPointer: {
                type: 'shadow'
            }
        },
        color: colorList,
        legend: {
            data: []
        },
        grid: {
            top: v_x,
            left: v_x2,
            right: v_y,
            bottom: v_y2,
            containLabel: true
        },
        xAxis: {
            type: 'category',
            data: v_data_name,
            splitLine : {
                show : false
            },
            axisLabel : {
                textStyle : {
                    color : '#3678ff'
                },
                interval: 0,
                rotate: 25 //文字倾斜度
            },
            axisTick : {
                show : false
            },
            axisLine : {
                lineStyle : {
                    color : '#234DB4',
                    width : 2
                }
            }
        },
        yAxis: {
            type: 'value',
            nameTextStyle : {
                color : '#3678ff'
            },
            splitLine : {
                show : false
            },
            axisLabel : {
                textStyle : {
                    color : '#3678ff'
                }
            },
            axisTick : {
                show : false
            },
            axisLine : {
                lineStyle : {
                    color : '#234DB4',
                    width : 2
                }
            }
        },
        series: [{
            name: [],
            type: v_type,
            showAllSymbol: true,
            symbol: 'circle',
            symbolSize: 15,
            barWidth: '15',
            data: v_data_cnt,
            label: {
                normal: {
                    show: true,
                    position: 'top',
                    textStyle: {
                        color: '#fff'
                    }
                }
            },
            itemStyle: {
                normal: {
                    color: function(params) {
                                var color_list = colorList;
                                return color_list[params.dataIndex]
                            },
                    borderColor: "#fff",
                    borderWidth: 2,
                    shadowColor: 'rgba(0, 0, 0, .3)',
                    shadowBlur: 0,
                    shadowOffsetY: 2,
                    shadowOffsetX: 2
                }
            },
            areaStyle: {
                normal: {
                    color: new echarts.graphic.LinearGradient(0, 0, 0, 1,
                        [{
                            offset: 0,
                            color: 'rgba(108,80,243,0.5)'
                        },
                        {
                            offset: 1,
                            color: 'rgba(108,80,243,0.1)'
                        }],
                        false
                    )
                }
            }
        }],
        dataZoom: [{
            start: 0,        // 滚动条开始范围
            end: v_data_name.length > 25 ? 40 : 100,   // 滚动条结束范围
            show: isShowZoom ? true : false,  // 是否显示滚动条
            xAxisIndex: [0],
            textStyle: {
                color: '#b1d4ff'    // 显示字的颜色
            },
            bottom: 20,
            backgroundColor: 'rgba(53,142,255,0.1)',  // 背景颜色
            height: 20,           // 滚动条高度
            handleSize: 20,                          // 手柄高度
            showDataShadow: true, // 显示数据阴影
            // 数据走势部分的颜色
            dataBackground: {
                areaStyle: {
                    opacity: 0.5, // 走势区域的透明度
                    color: '#7662ee' // 走势区域的颜色
                },
                lineStyle: {
                    opacity: 1,   // 走势线条的透明度
                    color: '#7662ee' // 走势区域的颜色
                }
            },
            handleStyle: {
                color: '#b1d4ff', // 手柄颜色
                shadowBlur: 8,    // 阴影长度
                shadowColor: 'rgba(0, 0, 0, 0)',// 阴影颜色
                shadowOffsetX: 2, // 手柄本身的阴影 X 偏移。
                shadowOffsetY: 2  // 手柄本身的阴影 Y 偏移。
            }},
            {
                type: 'inside'// 鼠标滚动效果
            }]
    };
    myChart.setOption(option);
}
注:shadowColor、shadowBlur这俩属性IE加上会报错(IE11、10、9、8都试过)
areaStyle: {
    normal: {
        color: new echarts.graphic.LinearGradient(0, 0, 0, 1,
            [{
                offset: 0,
                color: 'rgba(108,80,243,0.3)'
            },
            {
                offset: 1,
                color: 'rgba(108,80,243,0)'
            }],
            false
        ),
        shadowColor: 'rgba(108,80,243, 0.9)',  //IE加上这个属性就会报错
        shadowBlur: 20  //IE加上这个属性就会报错
    }
}
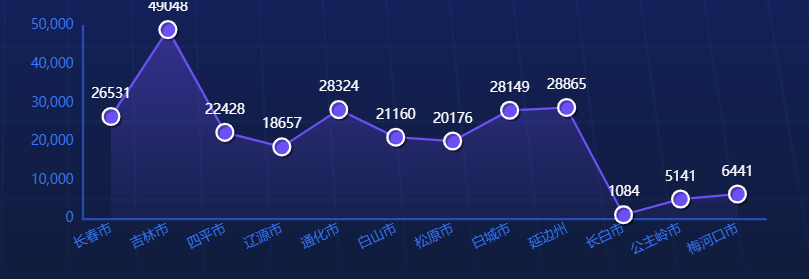
2、折线图效果
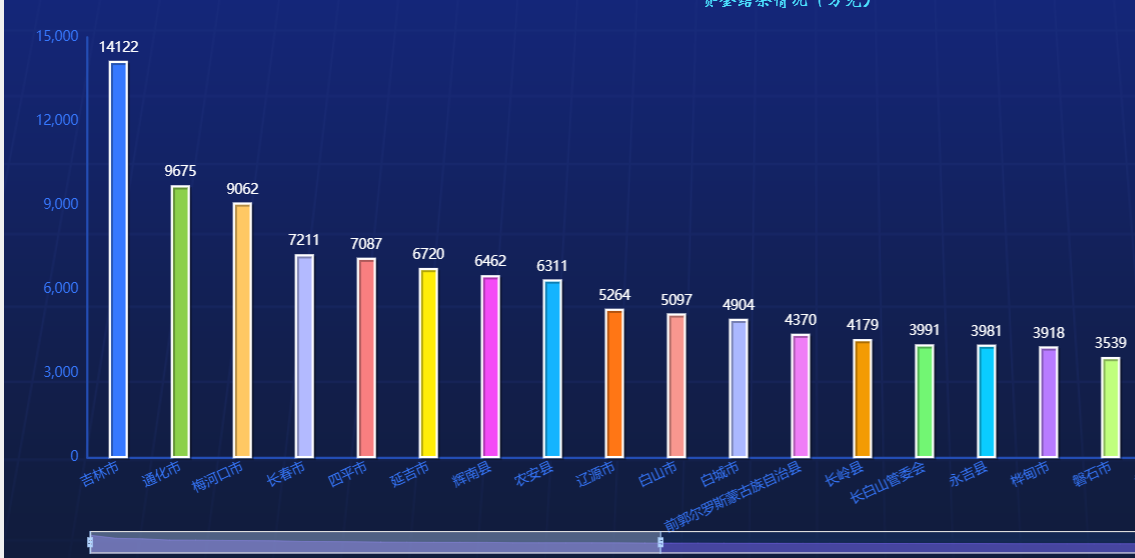
3、柱状图效果-单条
三、柱状图-多条
1、代码实现
//柱状图-多条调用
getDoubleBarY('bar_echarts', bar_name, [bar_jhNum, bar_sjNum], ['计划完成:' + jhwc_count, '实际完成:' + zxjy_count], '地区', '人数(人)', '2%', '8%', '20%', '13%');

//柱状图多条JS
function getDoubleBarY(b_id, data_name, data_num, legend_name, x_util, y_util, v_x, v_x1, v_y, v_y1) {
    var myChart = echarts.init(document.getElementById(b_id));
    myChart.clear();

    var data = [];
    var dataList;
    var series = [];
    var seriesList;
    var color = ["#02c3f1", "#53e568", "#a154e9"];
    for(var i = 0; i < legend_name.length; i++){
        dataList = {
            name: legend_name[i],
            textStyle: {
                color: color[i]
            }
        };
        data.push(dataList);

        seriesList = {
            name: legend_name[i],
            type: 'bar',
            data: data_num[i],
            barWidth: '10',
            label: {
                show: true,
                formatter: "{a|}",
                color: "#fff",
                position: "top",
                distance: -10,
                backgroundColor: color[i],
                padding: 4,
                borderRadius: 15,
                rich: {
                    a: {
                        width: 6,
                        height: 6,
                        borderRadius: 6,
                        lineHeight: 6,
                        backgroundColor: "#fff"
                    }
                }
            },
            itemStyle: {
                normal: {
                    color: {
                        type: "linear",
                        x: 0,
                        y: 0,
                        x2: 1,
                        y2: 1,
                        colorStops: [{
                            offset: 0,
                            color: color[i] // 0% 处的颜色
                        },
                            {
                                offset: 1,
                                color: "#1F4869" // 100% 处的颜色
                            }
                        ]
                    }
                }
            }
        };
        series.push(seriesList);
    }

    option = {
        color: ['#3678ff'],
        tooltip: {
            trigger: 'axis',
            axisPointer: { // 坐标轴指示器,坐标轴触发有效
                type: 'shadow' // 默认为直线,可选为:'line' | 'shadow'
            }
        },
        legend: {
            itemWidth: 0,
            data: data,
            formatter: function (name) {
                return "█ " + name;
            }
        },
        grid: {
            left: v_x,
            right: v_x1,
            top: v_y,
            bottom: v_y1,
            containLabel: true
        },
        xAxis: [{
            name: x_util,
            nameTextStyle: {
                color: '#3678ff'
            },
            type: 'category',
            data: data_name,
            splitLine: {
                show: false
            },
            axisLabel: {
                textStyle : {
                    color : '#3678ff'
                },
                interval: 0,
                rotate: 45 //文字倾斜度

            },
            axisTick: {
                show: false
            },
            axisLine: {
                lineStyle: {
                    color: '#234DB4',
                    width: 2
                }
            }
        }],
        yAxis: [{
            name: y_util,
            nameTextStyle: {
                color: '#3678ff'
            },
            type: 'value',
            splitLine: {
                show: false
            },
            axisLabel: {
                textStyle: {
                    color: '#3678ff'
                }
            },
            axisTick: {
                show: false
            },
            axisLine: {
                lineStyle: {
                    color: '#234DB4',
                    width: 2
                }
            },
        }],
        series: series
    };
    myChart.setOption(option);
}
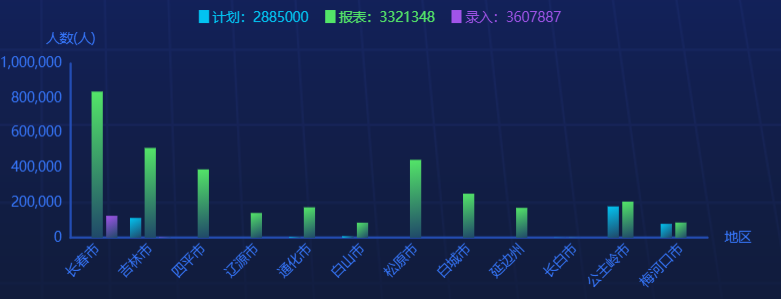
2、柱状图效果-多条
四、迁徙地图
1、代码实现
//迁徙地图调
var qyData  = [];
qyData.push([{name: '吉林'}, {name: area_name[i], value: area_num[i] / 1000}]);
getZGMap("echartsQXMap", qyData);
//迁徙地图JS
function getZGMap(p_id, qyData) {
    var myChart = echarts.init(document.getElementById(p_id));
    myChart.clear();

    var geoCoordMap = {
        '吉林': [125.8154, 44.2584],
        '黑龙江省': [127.9688, 45.368],
        '辽宁省': [123.1238, 42.1216],
        '山东省': [117.1582, 36.8701],
        '河北省': [114.4995, 38.1006],
        '北京市': [116.23, 39.54],
        '天津市': [117.2, 39.12],
        '江苏省': [118.7846, 32.08513],
        '广东省': [113.15, 23.08],
        '内蒙古自治区': [111.73, 40.83],
        '浙江省': [120.15, 30.28]
    };

    var planePath = 'path://M1705.06,1318.313v-89.254l-319.9-221.799l0.073-208.063c0.521-84.662-26.629-121.796-63.961-121.491c-37.332-0.305-64.482,36.829-63.961,121.491l0.073,208.063l-319.9,221.799v89.254l330.343-157.288l12.238,241.308l-134.449,92.931l0.531,42.034l175.125-42.917l175.125,42.917l0.531-42.034l-134.449-92.931l12.238-241.308L1705.06,1318.313z';

    var convertData = function (data) {
        var res = [];
        for (var i = 0; i < data.length; i++) {
            var dataItem = data[i];
            var fromCoord = geoCoordMap[dataItem[0].name];
            var toCoord = geoCoordMap[dataItem[1].name];
            if (fromCoord && toCoord) {
                res.push([{
                    coord: fromCoord
                }, {
                    coord: toCoord
                }]);
            }
        }
        return res;
    };

    var color = ['#a6c84c', '#ffa022', '#46bee9'];
    var series = [];
    [['吉林', qyData]].forEach(function (item, i) {
        series.push({
                name: item[0],
                type: 'lines',
                zlevel: 1,
                effect: {
                    show: true,
                    period: 6,
                    trailLength: 0.7,
                    color: '#fff',
                    symbolSize: 3
                },
                lineStyle: {
                    normal: {
                        color: color[i],
                        // color: function (value) { //随机颜色
                        //     return "#" + ("00000" + ((Math.random() * 16777215 + 0.5) >> 0).toString(16)).slice(-6);
                        // },
                        width: 0,
                        curveness: 0.2
                    }
                },
                data: convertData(item[1])
            },
            {
                name: item[0],
                type: 'lines',
                zlevel: 2,
                effect: {
                    show: true,
                    period: 6,
                    trailLength: 0,
                    symbol: planePath, //飞机图标
                    symbolSize: 10 //飞机大小
                },
                lineStyle: {
                    normal: {
                        color: color[i],
                        width: 1,
                        opacity: 0.4,
                        curveness: 0.2
                    }
                },
                data: convertData(item[1])
            },
            {
                name: item[0],
                type: 'effectScatter',
                coordinateSystem: 'geo',
                zlevel: 2,
                rippleEffect: {
                    brushType: 'stroke'
                },
                label: {
                    normal: {
                        show: true,
                        position: 'right',
                        formatter: '{b}'
                    }
                },
                symbolSize: function (val) {
                    return val[2] / 8;
                },
                itemStyle: {
                    normal: {
                        color: color[i]
                    }
                },
                data: item[1].map(function (dataItem) {
                    return {
                        name: dataItem[1].name,
                        value: geoCoordMap[dataItem[1].name].concat([dataItem[1].value])
                    };
                })
            });
    });

    option = {
        title : {
        },
        tooltip : {
            trigger: 'item'
        },
        geo: {
            map: 'china',
            label: {
                normal:{
                    show: false,
                },
                emphasis: {
                    show: false,
                }
            },
            roam: false,
            itemStyle: {
                normal: {
                    areaColor: '#004981',
                    borderColor: '#46d9ff'
                },
                emphasis: {
                    areaColor: '#004999'
                }
            }
        },
        series: series
    };

    var url = '../../workspace/jy/leaderviewjl/json/china.json';
    $.get(url, function (geoJson) {
        myChart.hideLoading();
        echarts.registerMap('china', geoJson);
        myChart.setOption(option);
    })
}
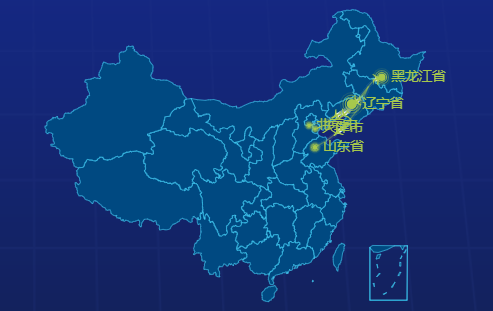
2、迁徙效果图

 浙公网安备 33010602011771号