matlab中wvtool
参考:https://ww2.mathworks.cn/help/signal/ref/wvtool.html?searchHighlight=wvtool&s_tid=doc_srchtitle
wvtool 工具可以同时查看时域和频域图
wvtool
Syntax
wvtool(WindowVector)
wvtool(WindowVector1,...,WindowVectorN)
 H = wvtool(...)
Description
wvtool( opens the Window Visualization Tool (WVTool) with time and frequency domain plots of the window vector specified in WindowVector)WindowVector. WindowVector must be a real-valued row or column vector. By default, the frequency domain plot is the magnitude squared of the Fourier transform of the window vector in decibels (dB). You can generate window vectors for a number of common window functions using the Signal Processing Toolbox™ software. See window for a list of supported window functions.
wvtool( opens WVTool with time and frequency domain plots of the window vectors specified in WindowVector1,...,WindowVectorN)WindowVector1, …, WindowVectorN.
H = wvtool(...) returns the figure handle, H.
Note
A related tool, Window Designer, is available for designing and analyzing windows.

Note
If you launch WVTool from Filter Designer, an Add/Replace icon, which controls how new windows are added from Filter Designer, appears on the toolbar.
WVTool Menus
In addition to the usual menus items, wvtool contains these wvtool-specific menu commands:
File menu:
-
Export — Exports the displayed plot(s) to a graphic file.
Edit menu:
-
Copy figure — Copies the displayed plot(s) to the clipboard (available only on Windows platforms).
-
Copy options — Displays the Preferences dialog box (available only on Windows platforms).
-
Figure, Axes, and Current Object Properties — Displays the Property Editor.
View menu:
-
Time domain — Check to show the time domain plot.
-
Frequency domain — Check to show the frequency domain plot.
-
Legend — Toggles the window name legend on and off. This option is also available with the Legend toolbar button.
-
Analysis Parameters — Controls the response plot parameters, including number of points, range, x- and y-axis units, sampling frequency, and normalized magnitude.
You can also access the Analysis Parameters by right-clicking the x-axis label of a plot in the Window Viewer panel.
-
Insert menu:
You use the Insert menu to add labels, titles, arrows, lines, text, and axes to your plots.
Tools menu:
-
Edit Plot — Turns on plot editing mode
-
Zoom In — Zooms in along both x- and y-axes.
-
Zoom X — Zooms in along the x-axis only. Drag the mouse in the x direction to select the zoom area.
-
Zoom Y — Zooms in along the y-axis only. Drag the mouse in the y direction to select the zoom area.
-
Full View — Returns to full view.
Examples
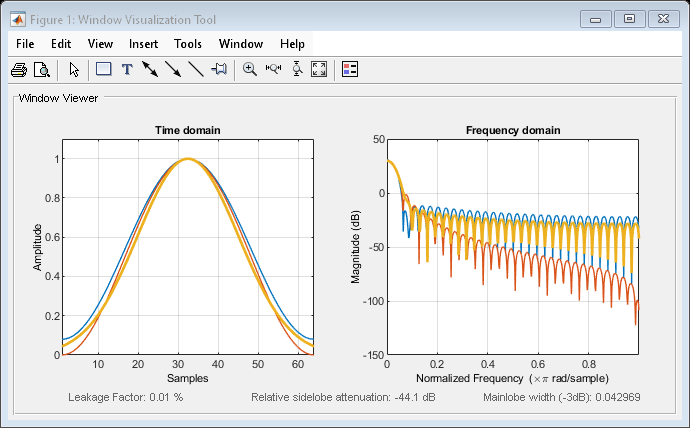
Display and Compare Windows
Use wvtool to display and compare 64-point Hamming, Hann, and Gaussian windows.
wvtool(hamming(64),hann(64),gausswin(64))
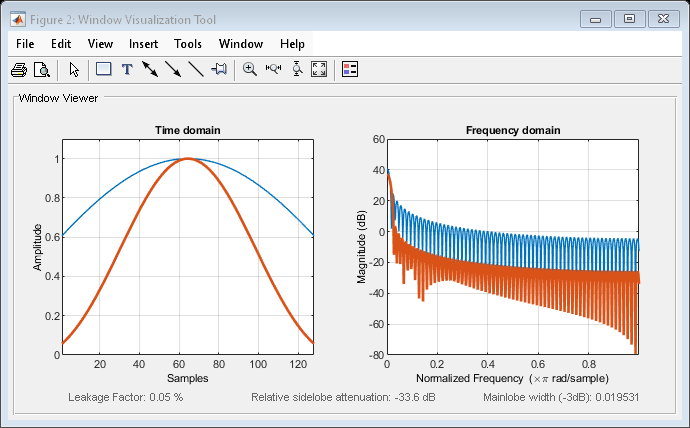
Compare 128-point Kaiser windows with different values of β.
wvtool(kaiser(128,1.5),kaiser(128,4.5))

 浙公网安备 33010602011771号