python matplotlib库找不到文件[Errno 2] No such file or directory: 'C:\\Users\\18136\\Anaconda3\\lib\\site-packages\\matplotlib\\mpl-data\\sample_data\\goog.npz'
Anaconda python matplotlib函数库找不到文件sample_data\\goog.npz类似问题解决方案
问题描述:
在运行matplotlib官网示例代码https://matplotlib.org/gallery/lines_bars_and_markers/scatter_demo2.html#sphx-glr-gallery-lines-bars-and-markers-scatter-demo2-py
代码如下:
import numpy as np
import matplotlib.pyplot as plt
import matplotlib.cbook as cbook

# Load a numpy record array from yahoo csv data with fields date, open, close,
# volume, adj_close from the mpl-data/example directory. The record array
# stores the date as an np.datetime64 with a day unit ('D') in the date column.
with cbook.get_sample_data('goog.npz') as datafile:
price_data = np.load(datafile)['price_data'].view(np.recarray)
price_data = price_data[-250:] # get the most recent 250 trading days

delta1 = np.diff(price_data.adj_close) / price_data.adj_close[:-1]

# Marker size in units of points^2
volume = (15 * price_data.volume[:-2] / price_data.volume[0])**2
close = 0.003 * price_data.close[:-2] / 0.003 * price_data.open[:-2]

fig, ax = plt.subplots()
ax.scatter(delta1[:-1], delta1[1:], c=close, s=volume, alpha=0.5)

ax.set_xlabel(r'$\Delta_i$', fontsize=15)
ax.set_ylabel(r'$\Delta_{i+1}$', fontsize=15)
ax.set_title('Volume and percent change')

ax.grid(True)
fig.tight_layout()

plt.show()
过程中产生报错信息如下
runfile('D:/python_matplotlib_charts/散点演示2.py', wdir='D:/python_matplotlib_charts')
Traceback (most recent call last):

File "D:\python_matplotlib_charts\散点演示2.py", line 15, in <module>
with cbook.get_sample_data('goog.npz') as datafile:

File "C:\Users\18136\Anaconda3\lib\site-packages\matplotlib\cbook\__init__.py", line 490, in get_sample_data
return open(path, mode)

FileNotFoundError: [Errno 2] No such file or directory: 'C:\\Users\\18136\\Anaconda3\\lib\\site-packages\\matplotlib\\mpl-data\\sample_data\\goog.npz'
报错信息翻译过来就是:找不到'C:\\Users\\18136\\Anaconda3\\lib\\site-packages\\matplotlib\\mpl-data\\sample_data路径下的goog.npz
经过检索该路径发现matplotlib\\mpl_data下没有sample_data文件夹
解决方案:
Windows下:
1.打开anaconda prompt 输入以下命令并执行:
conda install mpl_sample_data
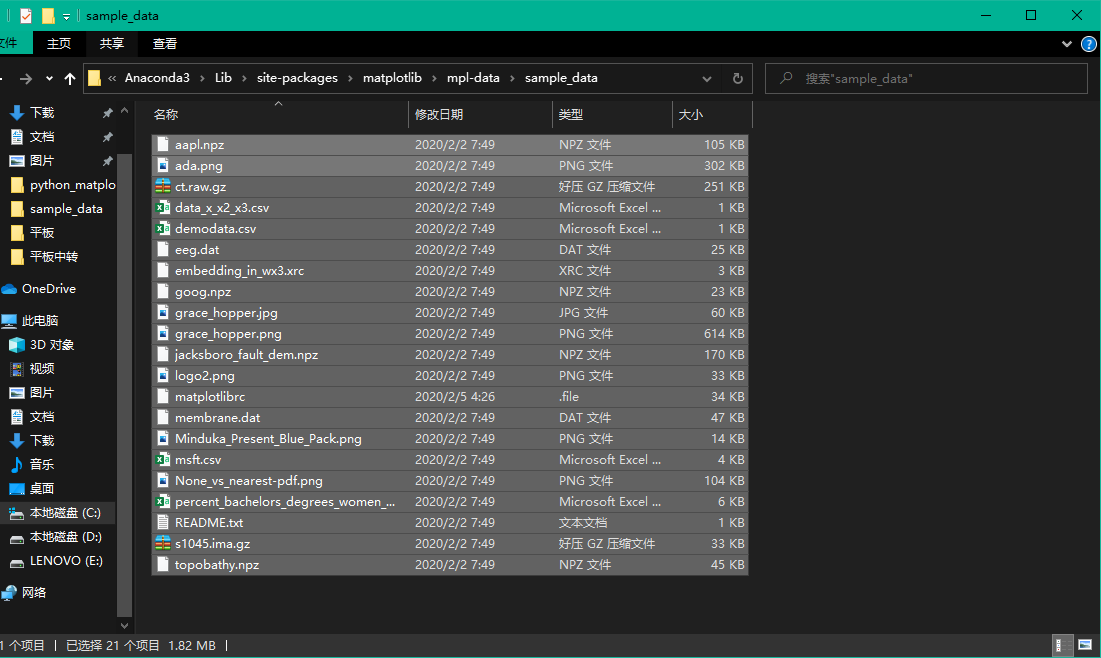
2.再次打开路径C:\\Users\\18136\\Anaconda3\\lib\\site-packages\\matplotlib\\mpl-data\\,创建一个文件夹命名为“sample_data“ 再将mpl_data路径下所有非文件夹文件,注意:非文件夹文件!(如下这些)移动到我们创建好的sample_data文件夹下。问题解决。
Linux下:
只需执行命令:
conda install mpl_sample_data
无需移动文件。问题解决。
遇到问题欢迎提问。

 浙公网安备 33010602011771号