Python爬取并分析全国新楼盘数据
Python爬取并分析全国新楼盘数据
一、选题背景
Q:为什么选择选择此题?
随着网络的迅速发展,万维网成为大量信息的载体,如何有效地提取并利用这些信息成为一个巨大的挑战
Q:达到什么预期目标?
未来发展前景广阔,人口流入将会增加对于房产的需求,获取更多的新楼盘数据,并分析人口流动。
Q:项目背景
十三届全国人大四次会议5日上午9时在人民大会堂开幕,其中住房政策:“房住不炒”,解决好大城市住房突出问题!进行可视化分析。
二、主题式网络爬虫设计
Q:主题是网络爬虫名称
爬取并分析全国新楼盘数据
Q:主题式网络爬虫的内容
爬取最新中国新楼盘数据,并实现数据可视化。
Q:设计方案描述
爬虫使用到的模块有requests_html、requests_cache、bs4.BeautifulSoup、re等
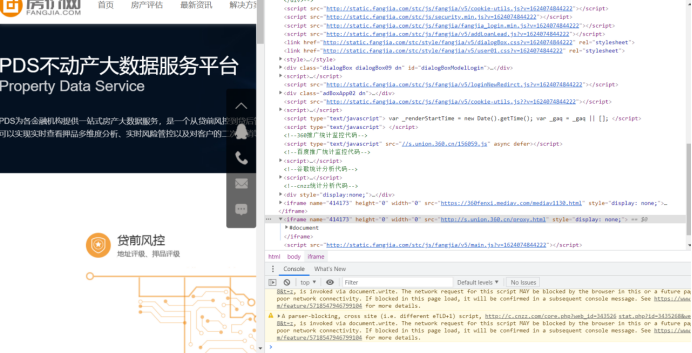
三、主页体面的结构特征分析
这是一个的首页界面

结构特征
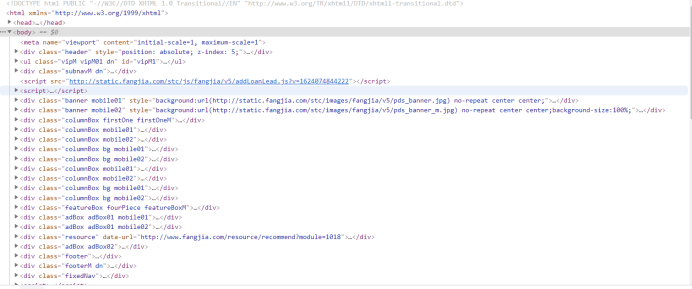
标签是div
结构分析
四、网络爬虫程序分析
定义函数
#定义好获取每个项目信息的函数。
 1 def get_house_status(soup):
 2   """
 3   获取房屋状态信息
 4   """
 5     house_status = []
 6     status = soup.find_all(attrs={'class': 'fangyuan'})
 7     for state in status:
 8         _status = state.span.text
 9         house_status.append(_status)
10     return house_status
11
12 def get_house_price(soup):
13   """
14   获取房屋价格信息
15   """
16     house_price = []
17     regex = re.compile('\s(\S+)\s')
18     prices = soup.find_all(attrs={'class': 'nhouse_price'})
19     for price in prices:
20         _prices = regex.findall(price.text)
21         _price = ''
22         if _prices[0] == '价格待定':
23             pass
24         else:
25             p = _prices[0].split('元')[0]
26             if '万' in p:
27                 _price = p + '元/套'
28             else:
29                 _price = p + '元/m2'
30         house_price.append(_price)
31     return house_price
32
33 def get_house_address(soup, c_city):
34   """
35   获取房屋地址信息
36   """
37     house_address = []
38     region = []
39     regex = re.compile('\s(\S+)\s')
40     addresses = soup.find_all(attrs={'class': 'address'})
41     for address in addresses:
42         _address = regex.findall(address.text)
43         if len(_address) > 1:
44             region.append(_address[0].split('[')[1].split(']')[0])
45         else:
46             region.append(c_city)
47         house_address.append(address.a['title'])
48     return region, house_address
49
50 def get_house_type(soup):
51   """
52   获取房屋类型信息
53   """
54     house_type = []
55     regex = re.compile('\s(\S+)\s')
56     house_types = soup.find_all(attrs={'class': 'house_type clearfix'})
57     for _house_type in house_types:
58         type_list = regex.findall(_house_type.text)
59         type_str = ''
60         for i in type_list:
61             type_str += i
62         house_type.append(type_str)
63     return house_type
64
65 def get_house_name(soup):
66   """
67   获取项目名称信息
68   """
69     house_name = []
70     regex = re.compile('\s(\S+)\s')
71     nlcd_names = soup.find_all(attrs={'class': 'nlcd_name'})
72     for nlcd_name in nlcd_names:
73         name = ''
74         names = regex.findall(nlcd_name.text)
75
76         if len(names) > 1:
77             for n in names:
78                 name += n
79             house_name.append(name)
80         else:
81             house_name.extend(names)
82     return house_name
获取数据的主函数
def get_data(c_city, city, start_page, cache):
  """
  获取数据
  """
    requests_cache.install_cache()
    requests_cache.clear()
    session = requests_cache.CachedSession()  # 创建缓存会话
    session.hooks = {'response': make_throttle_hook(np.random.randint(8, 12))}  # 配置钩子函数
    print(f'现在爬取{c_city}'.center(50, '*'))
    last_page = get_last_page(city)
    print(f'{c_city}共有{last_page}页')
    time.sleep(np.random.randint(15, 20))
    df_city = pd.DataFrame()
    user_agent = UserAgent().random
    for page in range(start_page, last_page):
        try:
            cache['start_page'] = page
            print(cache)
            cache_json = json.dumps(cache, ensure_ascii=False)
            with open('cache.txt', 'w', encoding='utf-8') as fout:
                fout.write(cache_json)
            print(f'现在爬取{c_city}的第{page + 1}页.')
            if page == 0:
                df_city = pd.DataFrame()
            else:
                df_city = pd.read_csv(f'df_{c_city}.csv', encoding='utf-8')
            url = html_url(city, page + 1)
            if page % 2 == 0:
                user_agent = UserAgent().random
                # 创建随机请求头
            header = {"User-Agent": user_agent}
            res = session.post(url, headers=header)
            if res.status_code == 200:
                res.encoding = 'gb18030'
                soup = BeautifulSoup(res.text, features='lxml')
                # 对html进行解析,完成初始化
                region, house_address = get_house_address(soup, c_city)
                house_name = get_house_name(soup)
                house_type = get_house_type(soup)
                house_price = get_house_price(soup)
                house_status = get_house_status(soup)
                df_page = to_df(c_city,
                                region,
                                house_name,
                                house_address,
                                house_type,
                                house_price,
                                house_status)
                df_city = pd.concat([df_city, df_page])
                df_city.head(2)
                time.sleep(np.random.randint(5, 10))
                df_city.to_csv(f'df_{c_city}.csv',
                               encoding='utf-8',
                               index=False)
        except:
           # 若报错则保存数据、以便继续
            df_city.to_csv(f'df_{c_city}.csv', encoding='utf-8', index=False)
            cache_json = json.dumps(cache, ensure_ascii=False)
            with open('cache.txt', 'w', encoding='utf-8') as fout:
                fout.write(cache_json)
return df_city
爬取过程中,将每个城市单独保存为一个csv文件。

合并数据
 1 import os
 2 import pandas as pd
 3 df_total = pd.DataFrame()
 4 for root, dirs, files in os.path.walk('./全国房价数据集'):
 5    for file in files:
 6        split_file = os.path.splitext(file)
 7         file_ext = split_file[1]
 8         if file_ext == '.csv':
 9            path = root + os.sep + file
10            df_city = pd.read_csv(path, encoding='utf-8')
11            df_total = pd.concat([df_total, df_city])
12     df_total.to_csv(root+os.sep+'全国新房202102.csv', encoding='utf-8', index=False)
数据清洗
导入需要用的模块
1 import pandas as pd
2 import numpy as np
3 import matplotlib.pyplot as plt
4 import seaborn as sns
5 import missingno as msno
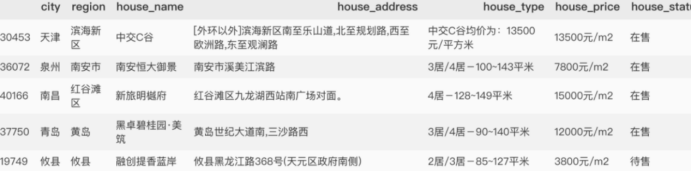
读取数据
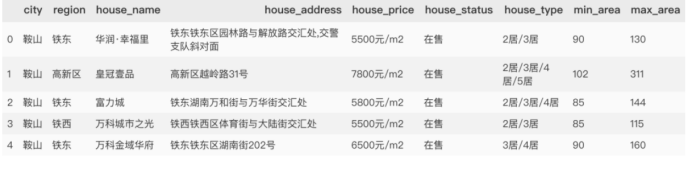
1 raw_data = pd.read_csv('全国新房202102.csv', encoding='utf-8') 2 raw_data.sample(5)
查看下数据基本情况
1 >>> raw_data.shape
2 (54733, 7)
3
4
5 >>> len(raw_data.city.drop_duplicates())
6 581
爬取了全国581个城市,共计54733个在售、预售房产项目。
由于获取到的数据存在缺失值、异常值以及不能直接使用的数据,因此在分析前需要先处理缺失值、异常值等,以便后续分析。
缺失值分析
1 msno.matrix(raw_data)

整体来看,处理house_price存在缺失值,这是因为这部分楼盘是预售状态,暂未公布售价。
house_type
再仔细分析,house_price有两种形式。
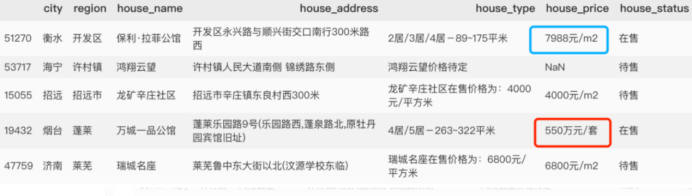
除了预售缺失值外,有单价和总价两种,为方便统计,需将总价除以面积,将价格统一为单均价。因此需要对户型house_type进行处理。
def deal_house_type(data):
    res = []
    if data is np.nan:
        return [np.nan, np.nan, np.nan]
    else:
        if '-'in data:
            types = data.split('-')[0]
            areas = data.split('-')[1]
            area = areas.split('~')
            if len(area) == 1:
                min_area = areas.split('~')[0][0:-2]
                max_area = areas.split('~')[0][0:-2]
            else:
                min_area = areas.split('~')[0]
                max_area = areas.split('~')[1][0:-2]

            res = [types, int(min_area), int(max_area)]
            return res
        else:
            return [np.nan, np.nan, np.nan]
1 series_type = raw_data.house_type.map(lambda x: deal_house_type(x))
2 df_type = pd.DataFrame(series_type.to_dict(), index=['house_type', 'min_area', 'max_area']).T
3 data_type = pd.concat([data_copy.drop(labels='house_type',axis=1), df_type], axis=1)
4 data_type.head()
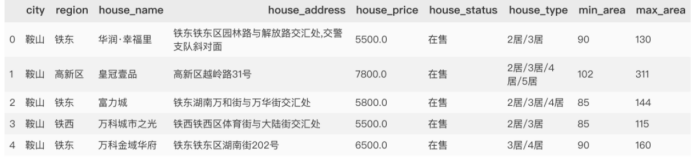
得到下表
house_price
得到户型面积后,接下来处理房屋价格。
 1 def deal_house_price(data):
 2     try:
 3         if data.house_price is np.nan:
 4             return np.nan
 5         else:
 6             if "价格待定" in data.house_price:
 7                 return np.nan
 8
 9             elif "万" not in data.house_price:
10                 price = int(data.house_price.split('元')[0])
11             else:
12                 price_total = int(float(data.house_price.split('万')[0])* 10000)
13                 if data.min_area is np.nan and data.max_area is np.nan:
14                     return np.nan
15                 elif data.min_area is np.nan:
16                     price = price_total/ data.max_area
17                 elif data.max_area is np.nan:
18                     price = price_total / data.min_area
19                 else:
20                     price = price_total / (data.min_area + data.max_area)
21         return int(price)
22     except:
23         return np.nan
1 series_price = data_type.apply(lambda x:deal_house_price(x), axis=1 )
2 data_type['house_price'] = series_price
3 data_type.head()
得到结果
缺失值处理
1 data = data_type.copy()
2 # 房价缺失值用0填充
3 data['house_price'] = data_type.house_price.fillna(0)
4 data['house_type'] = data_type.house_type.fillna('未知')
异常值分析
1 data.describe([.1, .25, .5, .75, .99]).T
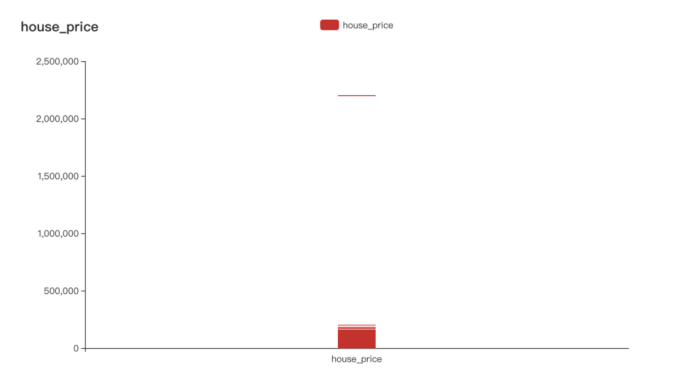
很明显有个缺失值,查看原网页,此数值因较特殊,清洗过程中多乘100000,因此直接将此值更改过来。

还可以通过可视化(箱图)的方式查看异常值。
1 from pyecharts import options as opts
2 from pyecharts.charts import Boxplot
3
4 v = [int(i) for i in data.house_price]
5 c = Boxplot()
6 c.add_xaxis(["house_price"])
7 c.add_yaxis("house_price", v)
8 c.set_global_opts(title_opts=opts.TitleOpts(title="house_price"))
9 c.render_notebook()
可视化分析
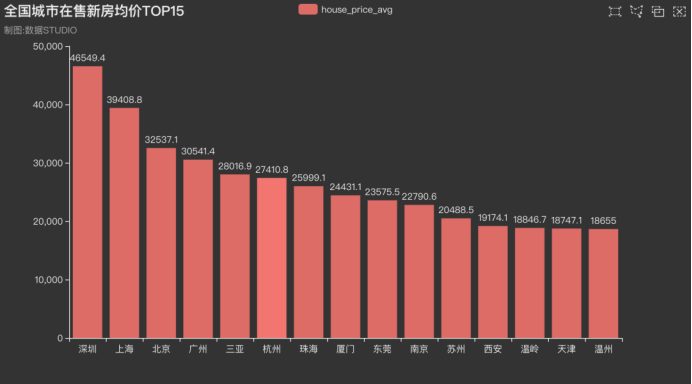
全国城市在售新房均价条形图
 1 from pyecharts.charts import Bar
 2 from pyecharts.globals import ThemeType
 3
 4 x_axis = [i for i in data_pivot.index[0:15]]
 5 y_axis = [round(float(i), 1) for i in data_pivot.house_price.values[0:15]]
 6
 7 c = (
 8     Bar({"theme": ThemeType.DARK})
 9     .add_xaxis(x_axis)
10     .add_yaxis("house_price_avg", y_axis)
11     .set_global_opts(
12         title_opts=opts.TitleOpts(title="全国城市在售新房均价TOP15", subtitle="数据: STUDIO"),
13         brush_opts=opts.BrushOpts(),
14     )
15 )
16 c.render_notebook()
结果如下,排名前面的一直都是深圳、北京、上海等一线城市。
全国房价地理位置图
 1 import pandas as pd
 2 from pyecharts.globals import ThemeType, CurrentConfig, GeoType
 3 from pyecharts import options as opts
 4 from pyecharts.charts import Geo
 5
 6 #自定义各城市的经纬度
 7 # geo_cities_coords = {df.iloc[i]['城市']:[df.iloc[i]['经度'],df.iloc[i]['纬度']] for i in range(len(df))}
 8
 9 datas = [(i, int(j)) for i, j in zip(data_pivot.index, data_pivot.values)]
10 # print(datas)
11
12 geo = (Geo(init_opts=opts.InitOpts(width='1000px',
13                                    height='600px',
14                                    theme=ThemeType.PURPLE_PASSION),
15            is_ignore_nonexistent_coord = True)
16        .add_schema(maptype='china',
17                    label_opts=opts.LabelOpts(is_show=True))   # 显示label  省名
18        .add('均价',
19             data_pair=datas,
20             type_=GeoType.EFFECT_SCATTER,
21             symbol_size=8,
22             # geo_cities_coords=geo_cities_coords
23            )
24        .set_series_opts(label_opts=opts.LabelOpts(is_show=False))
25        .set_global_opts(
26            title_opts=opts.TitleOpts(title='全国城市在售新房均价', subtitle="制图: 数据STUDIO"),
27            visualmap_opts=opts.VisualMapOpts(max_=550,
28                                              is_piecewise=True,
29                                              pieces=[
30                      {"max": 5000, "min": 1000, "label": "1000-5000", "color": "#708090"},
31                      {"max": 10000, "min": 5001, "label": "5001-10000", "color": "#00FFFF"},
32                      {"max": 20000, "min": 10001, "label": "10001-20000", "color": "#FF69B4"},
33                      {"max": 30000, "min": 20001, "label": "20001-30000", "color": "#FFD700"},
34                      {"max": 40000, "min": 30001, "label": "30001-40000", "color": "#FF0000"},
35                      {"max": 100000, "min": 40001, "label": "40000-100000", "color": "#228B22"},])
36        )
37       )
38
39 geo.render('全国城市在售新房均价.html')
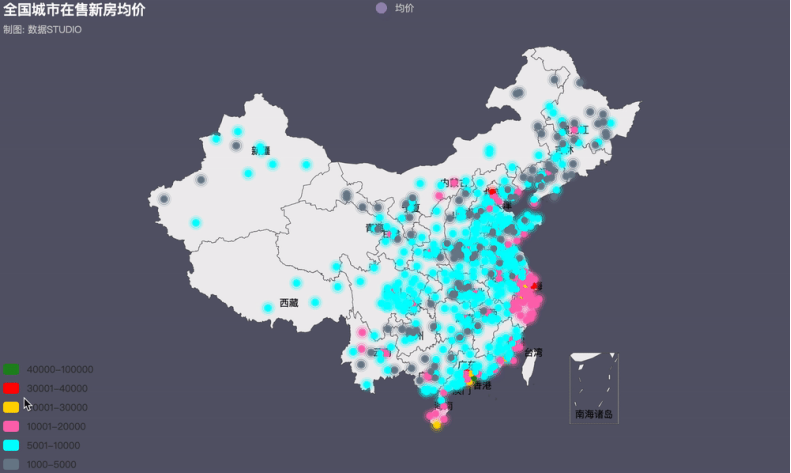
近年来,火热的楼市价格一路飙升,为了稳定房价,各地政府相继出台各项调控政策。据统计,今年内全国各地累计出台楼市调控政策次数已高达97次(近100次),其中,1月份单月全国各地楼市调控政策次数高达42次,2月份比1月份多3次,共计45次。
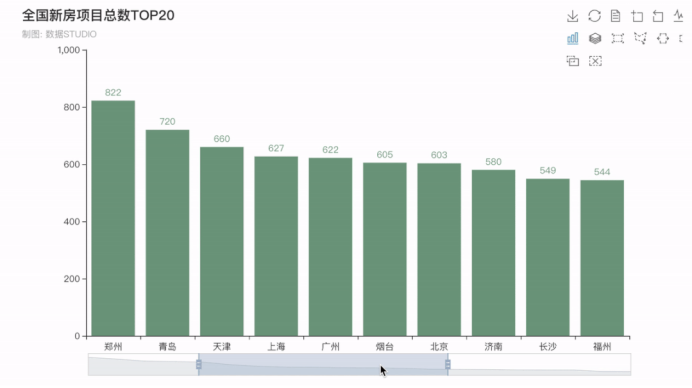
全国新房项目总数排行榜
接下来看看全国在售\预售新房项目总数排行TOP20,排在前五的分别是四川成都--1000个,重庆--938个,湖北武汉--859个,陕西西安--840个,河南郑州--822个,均是新一线城市(成都、杭州、重庆、武汉、苏州、西安、天津、南京、郑州、长沙、沈阳、青岛、宁波、东莞和无锡)。
现在的新一线城市经济发展速度较快,未来发展前景广阔,可以说是仅次于北上广深。人口都在持续流入,人口流入将会增加对于房产的需求,房产需求增长将会让房产价格稳步攀升。也是很值得投资的。
 1 from pyecharts import options as opts
 2 from pyecharts.charts import Bar
 3
 4 city_counts = data.city.value_counts()[0:20]
 5 x_values = city_counts.index.to_list()
 6 y_values = [int(i) for i in city_counts.values]
 7
 8 bar = (
 9     Bar()
10     .add_xaxis(x_values)
11     .add_yaxis("",y_values,itemstyle_opts=opts.ItemStyleOpts(color="#749f83"))
12     .set_global_opts(title_opts=opts.TitleOpts(title="全国新房项目总数TOP20"),
13                      toolbox_opts=opts.ToolboxOpts(),
14                      legend_opts=opts.LegendOpts(is_show=False),
15                     datazoom_opts=opts.DataZoomOpts(),)
16 )
17 bar.render_notebook()
五、总结
在学习python爬取并分析全国新楼盘数据,对爬取知识有了一个深的了解,虽然还有很多的不足,但是队python网络爬取的知识有了深刻的了解,而且在爬取的过程也是一个非常有趣的。

 浙公网安备 33010602011771号