Python-matplotlib学习笔记02-子图与多种图形绘制
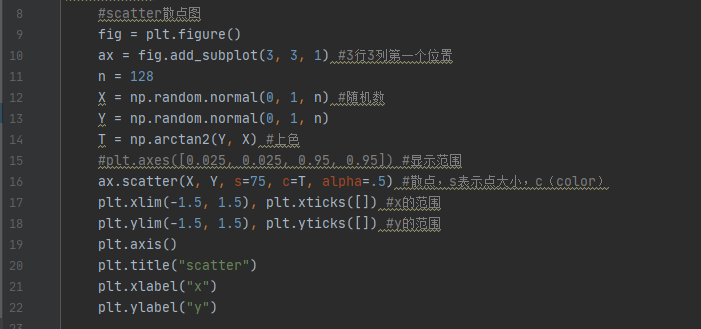
1. 散点图Scatter
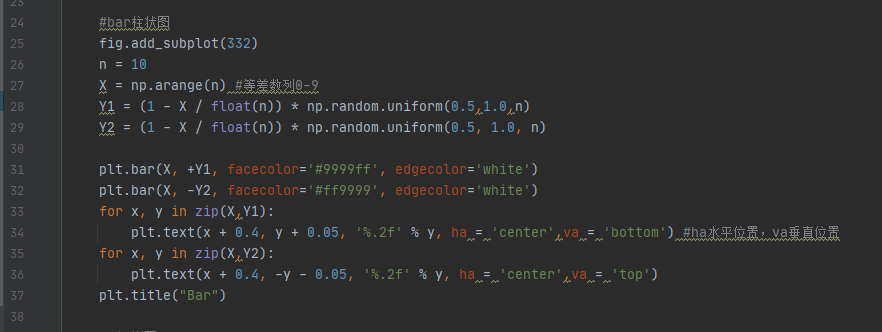
2. 柱状图Bar
3. 饼图Pie

4. 极坐标Polar

5.热图Heat map

6. 3D图

7. 热力图Hot map

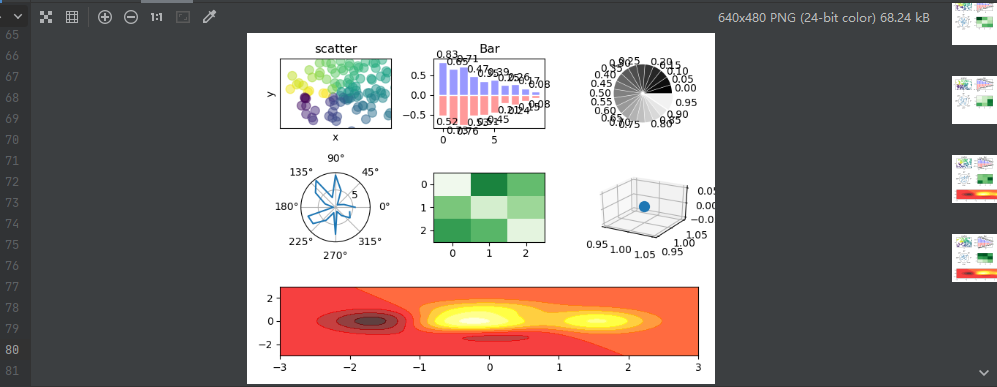
结果:
explode = Z *0.05 #每个扇形离中心的距离
1. 散点图Scatter
2. 柱状图Bar
3. 饼图Pie
4. 极坐标Polar
5.热图Heat map
6. 3D图
7. 热力图Hot map
结果:
explode = Z *0.05 #每个扇形离中心的距离

 浙公网安备 33010602011771号