day 18
nohup命令
nohup		默认情况下会输出到当前目录并在当前目录创建文件  nohup.txt
nohup   command  &     放到后台去运行
nohup   command    不加 &  还是在前台运行
直接用  nohup   command    :   就在前台运行,只不过把运行记录到了 nohup.txt
[root@yuanlai0224 ~]# nohup  ping  baidu.com
nohup: ignoring input and appending output to ‘nohup.out’


用  ctrl  +  z  暂停后台任务		可以看到在终端可以进行其他操作了,但是后台运行的任务被停止了

^Z
[2]+  Stopped                 nohup ping baidu.com
[root@yuanlai0224 ~]#

用 jobs  可以查看后台任务的情况

[root@yuanlai0224 ~]# jobs
[2]+  Stopped                 nohup ping baidu.com		#可以看到这个任务目前是停止的
[root@yuanlai0224 ~]#

用 bg + 任务号  可以继续在后台运行

[root@yuanlai0224 ~]# bg 2
[2]+ nohup ping baidu.com &
[root@yuanlai0224 ~]# jobs
[2]+  Running                 nohup ping baidu.com &		#此时是运行起来了,并且可以在终端进行其他操作
[root@yuanlai0224 ~]#


用  fg + 任务号  把任务拿到前台运行
[root@yuanlai0224 ~]# fg  2
nohup ping baidu.com


这个 nohup  命令来管理前台,后台任务。这样做的好处就是把一个任务放到后台进行,还不影响我们其他操作。
如果知识在前台运行,遇到故障,这个任务就会丢失。而放到后台运行,是不会丢失的。


如下
#此时这个任务在后台运行。把这个终端关掉再开一个终端来查看进程
[root@yuanlai0224 ~]# jobs
[2]+  Running                 nohup ping baidu.com &

[root@yuanlai0224 ~]# ps -ef | grep ping			#查看 ping 进程还是活着的
root       3278      1  0 16:12 ?        00:00:00 ping baidu.com
root       3380   3347  0 16:24 pts/3    00:00:00 grep --color=auto ping
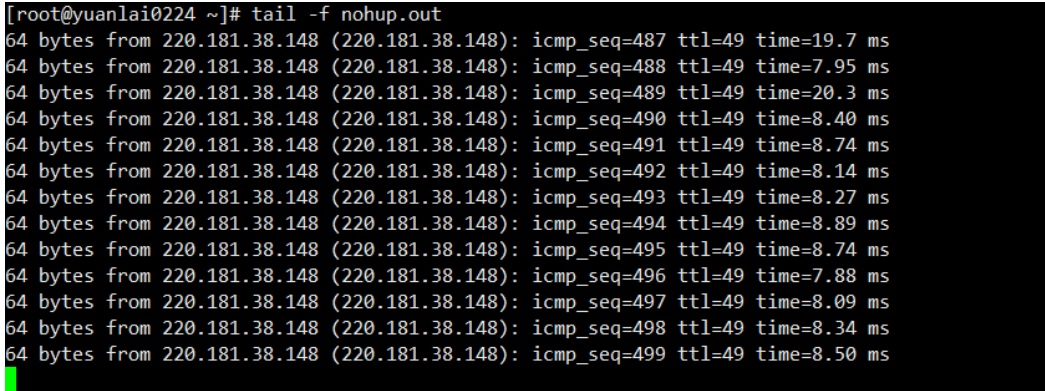
监测一下这个 nohup.txt 文件看它是否还在写入数据
可以从下图看到,这个程序还是在进行的。
理解linux的数据流
执行linux命令时,linux默认为用户进程提供了3种数据流
- stdin
- 标准输入、0
- 一般是键盘输入数据
- 比如cat命令等待用户输入
- stdout
- 标准输出、1
- 程序执行结果,输出到终端
- stderr
- 标准错误输出,2
- 程序执行结果,输出到终端
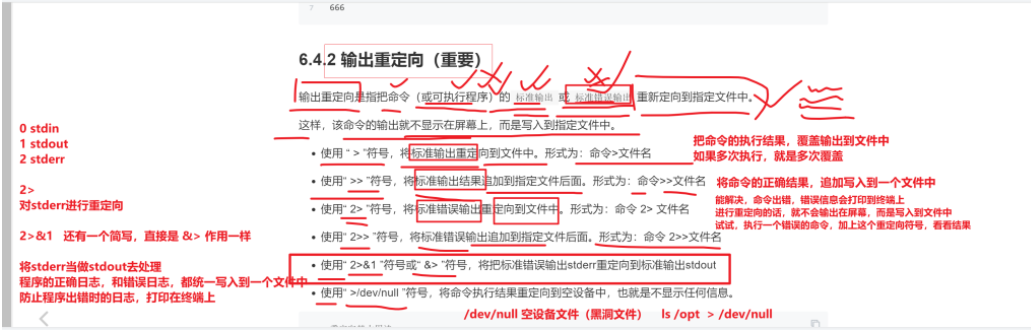
标准输入重定向
[root@167 opt]# cat   <   /etc/passwd   # 输入重定向,原本是来自于终端的键盘输入,改为了,可以是来自于文件的输入

# 比如用在数据库的,数据导入
mysql <  /opt/back.sql
理解重定向符号和数据流代号
练习数据流
练习数据流

[root@yuanlai0224 ~]# cat			#交互式的输出,你输入什么它就输出什么
你好
你好


我是Linux
我是Linux

# ctrl + d  没有提示退出
我似乎
我是Linux
我是Linux

[root@yuanlai0224 ~]#

ctrl  +  c 会出先 ^C  这样的一个中断 符号
[root@yuanlai0224 ~]# cat


nihao
nihao


linux
linux


^C
[root@yuanlai0224 ~]#


[root@yuanlai0224 ~]# llll  /opt				#输入错误的命令 会有一个报错
-bash: llll: command not found
[root@yuanlai0224 ~]#
[root@yuanlai0224 ~]# ls /oppp						#输入错误的文件目录,也会报错
ls: cannot access /oppp: No such file or directory
[root@yuanlai0224 ~]#

如何把这报错的信息不让他显示在终端呢?就需要借用重定向符号了。

>		覆盖写入内容到文件

[root@yuanlai0224 ~]# ls /opt > /tmp/opt.log		#当我们用了重定向符号后,就不会在终端显示出信息,把信息输入到了指定的文件内
[root@yuanlai0224 ~]#
[root@yuanlai0224 ~]# ls /opt > /tmp/opt.log
[root@yuanlai0224 ~]#
[root@yuanlai0224 ~]# cat /tmp/opt.log
jumpserver
log
messages
opt
tengine233
[root@yuanlai0224 ~]#


>>		追加内容写入到文件

[root@yuanlai0224 ~]# ls /opt >> /tmp/opt.log
[root@yuanlai0224 ~]# ls /opt >> /tmp/opt.log
[root@yuanlai0224 ~]# cat /tmp/opt.log
jumpserver
log
messages
opt
tengine233
jumpserver
log
messages
opt
tengine233
jumpserver
log
messages
opt
tengine233
[root@yuanlai0224 ~]#

2>		2是stderr的代号,也就是报错信息,覆盖内容到指定文件

[root@yuanlai0224 ~]# lllll   /opt 2>  /tmp/opt.log
[root@yuanlai0224 ~]# lllll   /opt 2>  /tmp/opt.log
[root@yuanlai0224 ~]# lllll   /opt 2>  /tmp/opt.log
[root@yuanlai0224 ~]# cat /tmp/opt.log
-bash: lllll: command not found
[root@yuanlai0224 ~]#

2>>		追加报错内容到指定文件

[root@yuanlai0224 ~]# lllll   /opt 2>>  /tmp/opt.log
[root@yuanlai0224 ~]# lllll   /opt 2>>  /tmp/opt.log
[root@yuanlai0224 ~]# cat /tmp/opt.log
-bash: lllll: command not found
-bash: lllll: command not found
-bash: lllll: command not found
[root@yuanlai0224 ~]#


2>&1	把stderr当作stdout去处理

[root@yuanlai0224 ~]# lllll   /opt  >  /tmp/opt.log   2>&1
[root@yuanlai0224 ~]# lllll   /opt  >  /tmp/opt.log   2>&1
[root@yuanlai0224 ~]# cat /tmp/opt.log
-bash: lllll: command not found
[root@yuanlai0224 ~]#

&>		跟2>&1一个原理

[root@yuanlai0224 ~]# ls  /oppppp  &>  /tmp/opt.log
[root@yuanlai0224 ~]# ls  /oppppp  &>  /tmp/opt.log
[root@yuanlai0224 ~]# cat /tmp/opt.log
ls: cannot access /oppppp: No such file or directory
[root@yuanlai0224 ~]# ls  /oppppp  &>>  /tmp/opt.log
[root@yuanlai0224 ~]# ls  /oppppp  &>>  /tmp/opt.log
[root@yuanlai0224 ~]# cat /tmp/opt.log
ls: cannot access /oppppp: No such file or directory
ls: cannot access /oppppp: No such file or directory
ls: cannot access /oppppp: No such file or directory
[root@yuanlai0224 ~]#
Linux资源管理篇
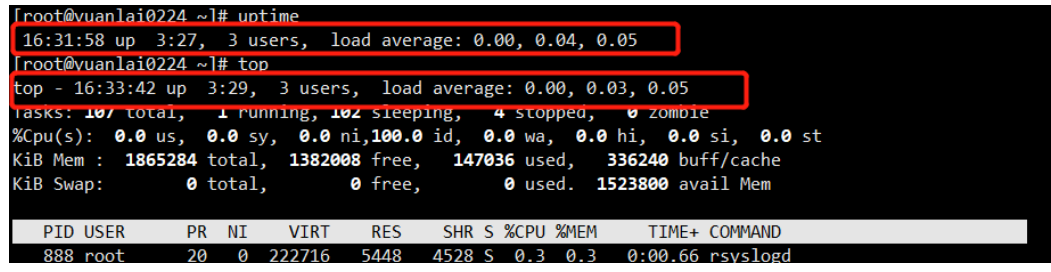
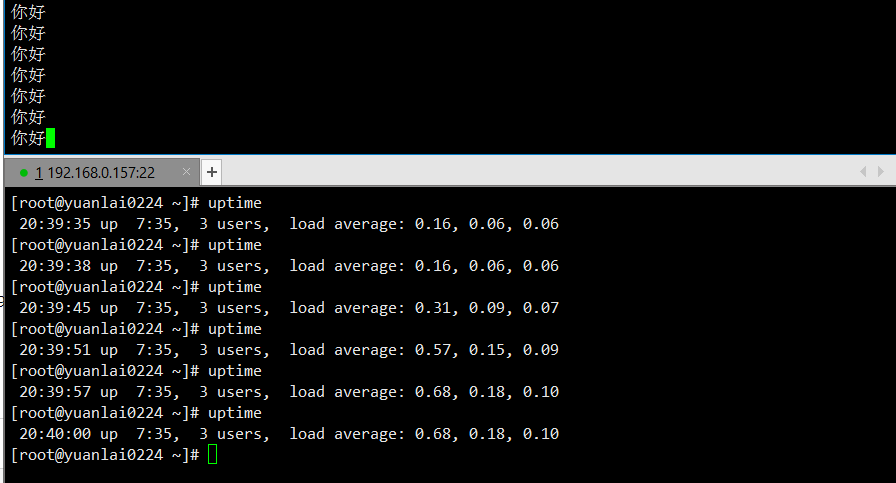
uptime
uptime  查看机器负载。系统在单位时间内的压力

等同于 top 查看资源管理的 第一行内容
只不过 top 查看到的是动态的,uptime 查看的是在某一时间的负载。
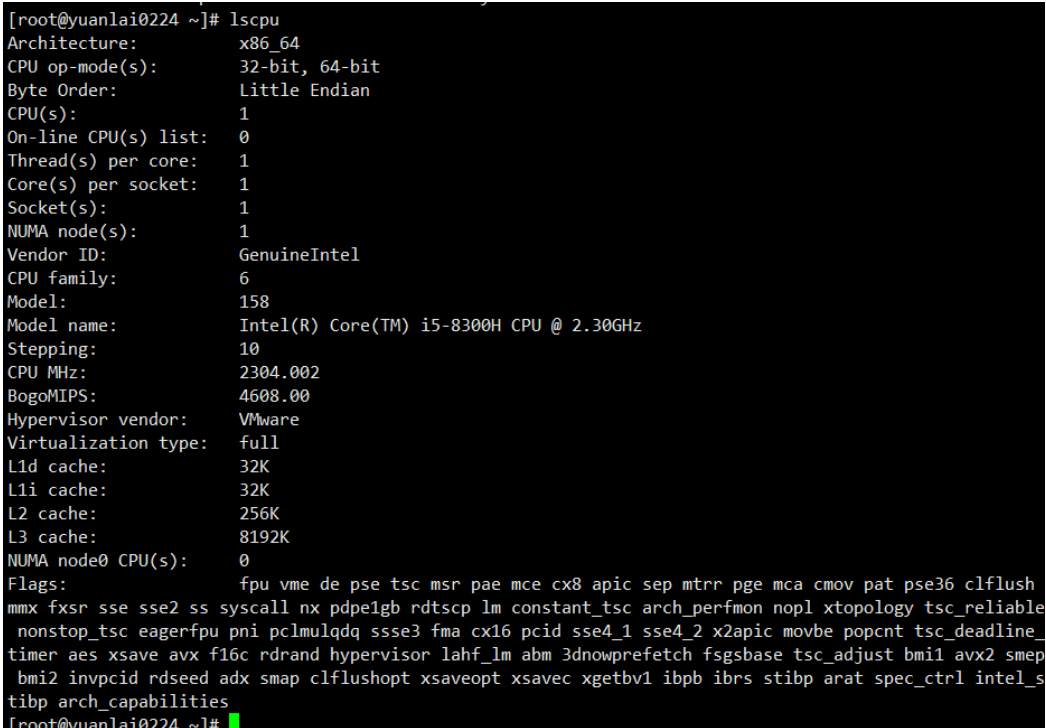
查看当前机器是几核的 cpu
lscpu
查看机器的cpu详细信息
仅查看 cpu 有几核

[root@yuanlai0224 ~]# lscpu |grep -i 'cpu(s)'
CPU(s):                1				# cpu 个数
On-line CPU(s) list:   0
NUMA node0 CPU(s):     0
[root@yuanlai0224 ~]#

查看 cpu 有几个

[root@yuanlai0224 ~]# cat /proc/cpuinfo  | grep 'core id'
core id		: 0						 #这里的 0 是 cpu 的 id


[root@yuanlai0224 ~]# cat /proc/cpuinfo  | grep 'process'
processor	: 0
stress压力测试命令
如何让机器上的每一核利用到最大化
CPU 压力测试
#安装 stress 命令
yum install stress -y
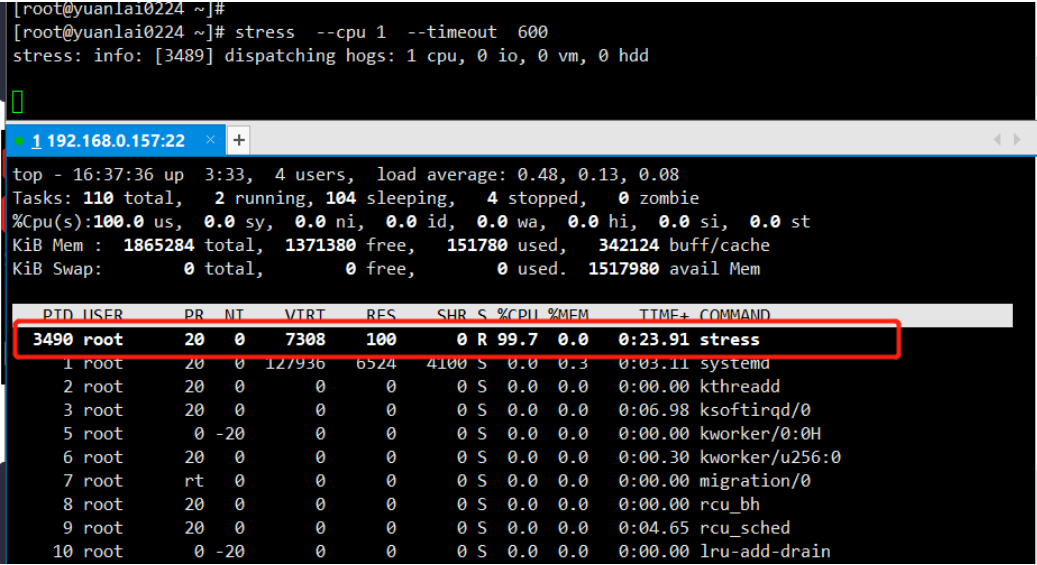
1. stress --cpu 1 --timeout 600 #让一个 cpu 完全跑起来
2.死循环打印nihao
while true ; do echo 'nihao' ; done
从下图可以看到, stress 的 CPU 使用率接近 100%。
为什么没有达到100%呢?
因为在机器上还有其它进程在使用 cpu 所有是没有达到100%,但是它是无限接近100%的。
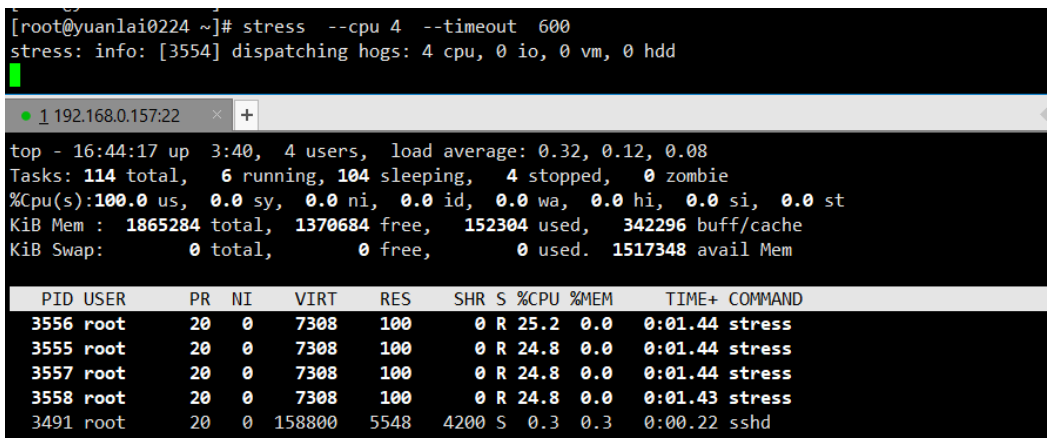
如果  stress  --cpu  这里的参数比机器中的 cpu 要多会出现什么情况呢?

stress  --cpu 4  --timeout 600
可以看到如果这个参数比机器中的 cpu 要多,他就会形成多个进程来平摊 cpu 使用率。
free命令
free	查看内存情况
参数
-m		显示内存单位为M
-h		以可读形式显示容量

[root@yuanlai0224 ~]# free
              total        used        free      shared  buff/cache   available
Mem:        1865284      148760     1374224        9892      342300     1521080
Swap:             0           0           0
[root@yuanlai0224 ~]#

[root@yuanlai0224 ~]# free  -m
              total        used        free      shared  buff/cache   available
Mem:           1821         142        1344           9         334        1487
Swap:             0           0           0


[root@yuanlai0224 ~]# free  -h
              total        used        free      shared  buff/cache   available
Mem:           1.8G        142M        1.3G        9.6M        334M        1.5G
Swap:            0B          0B          0B
[root@yuanlai0224 ~]#
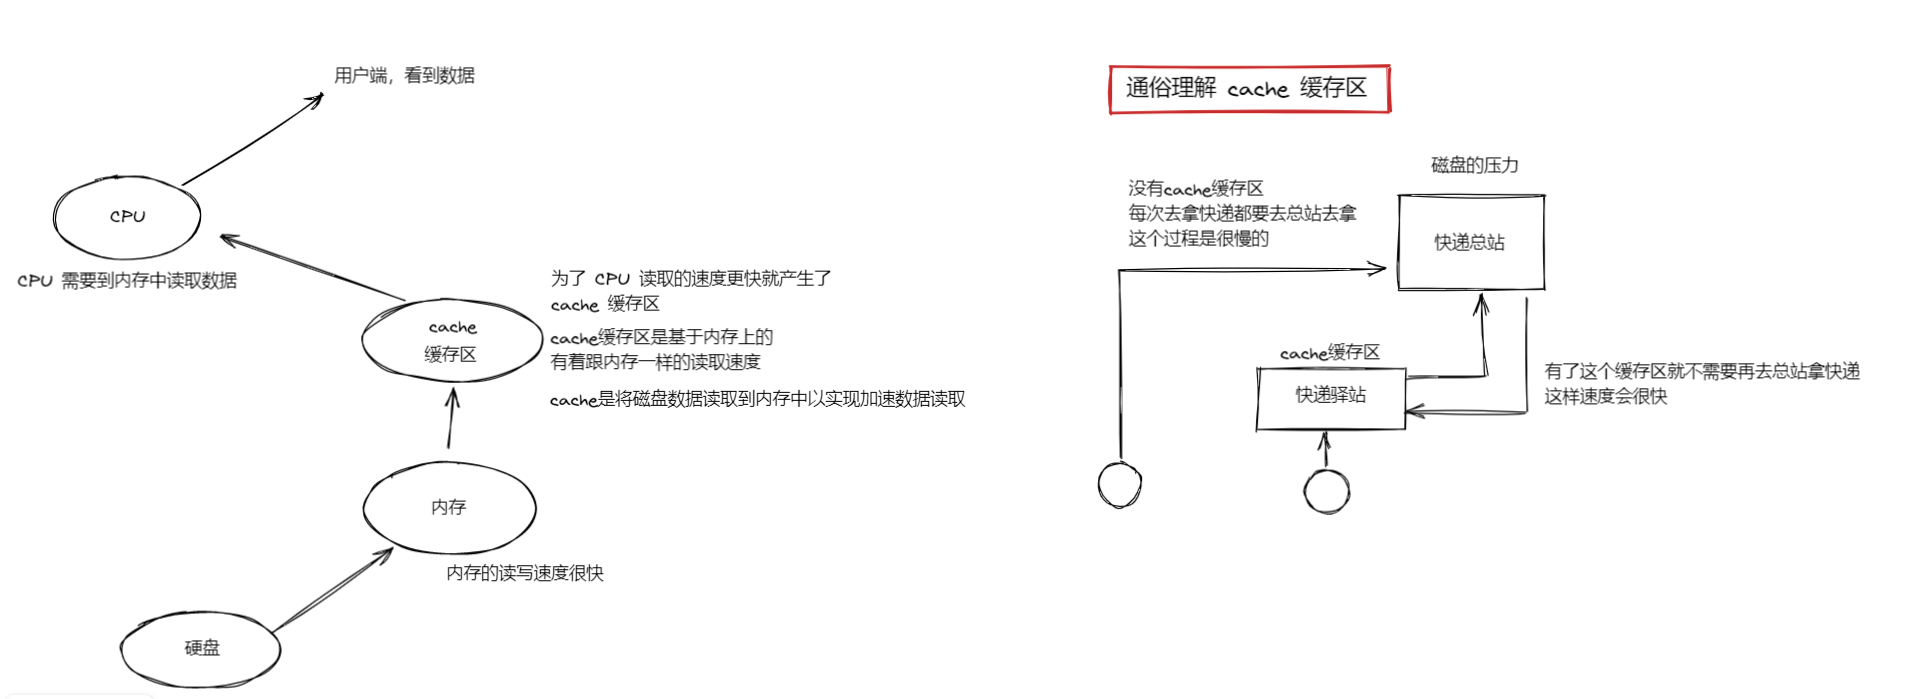
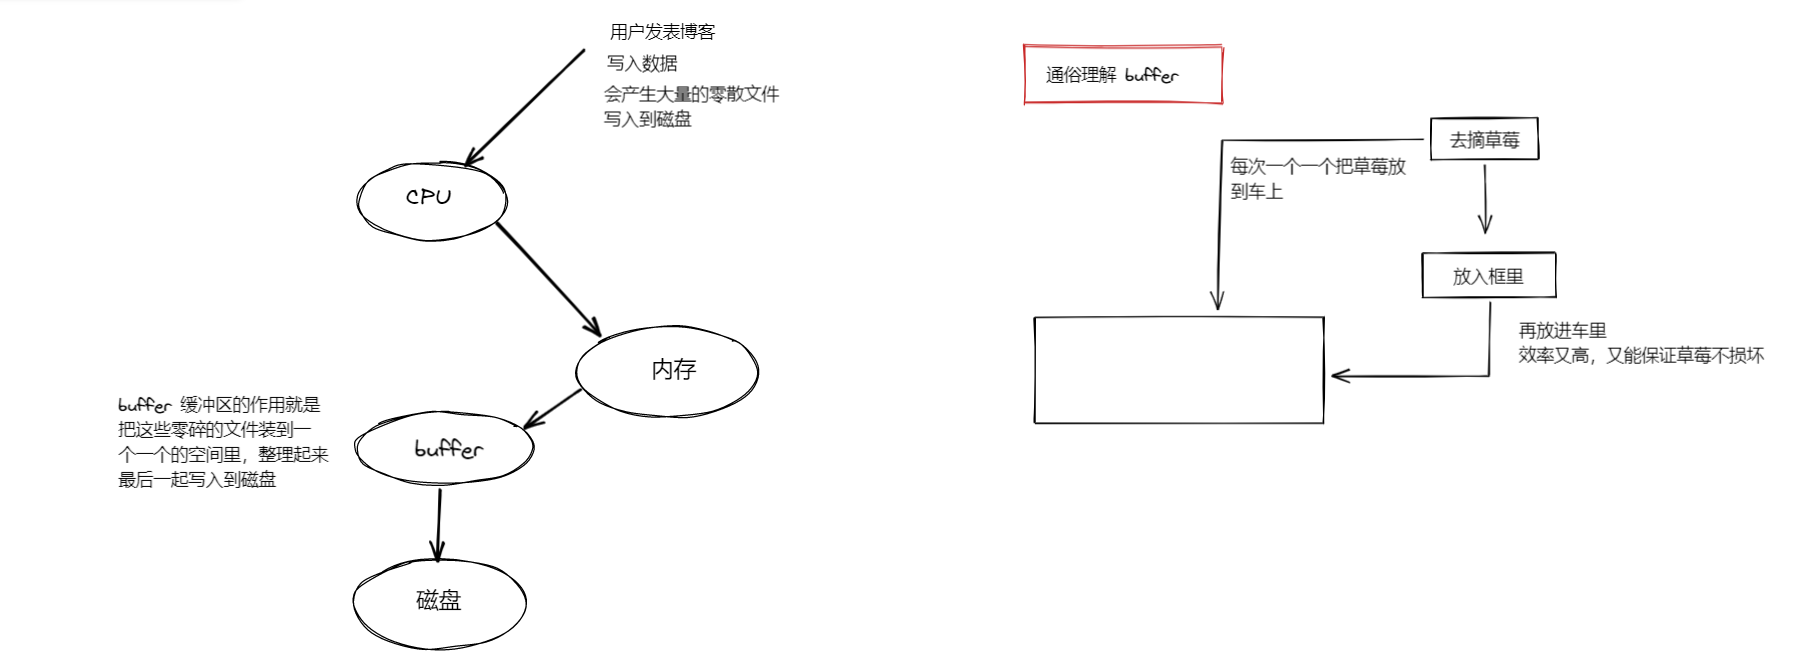
解释 cache 缓存的概念
解释buffer 缓冲区的概念
查看磁盘使用情况
df  -h  查看磁盘使用情况

磁盘io 监控
#安装 iostat命令	(input  output   stat) 		静态
yum install sysstat -y

#安装  iotop命令							动态
yum install iotop -y


[root@yuanlai0224 ~]# df -h

文件系统				容量	已用	可用	已用%	挂载点
Filesystem               Size  Used Avail Use% Mounted on
/dev/mapper/centos-root   19G  3.6G   16G  19% /
devtmpfs                 899M     0  899M   0% /dev
tmpfs                    911M     0  911M   0% /dev/shm
tmpfs                    911M  9.6M  902M   2% /run
tmpfs                    911M     0  911M   0% /sys/fs/cgroup
/dev/sda1               1014M  142M  873M  14% /boot
tmpfs                    183M     0  183M   0% /run/user/0
[root@yuanlai0224 ~]#
网络资源监控
网络端口查看
理解网络是什么
IP地址,对那个了 tcp/ip 协议的IP地址号
端口号,对应了应用层的  如 80 端口(伴随着 http协议的服务,如nginx这样的网站服务)
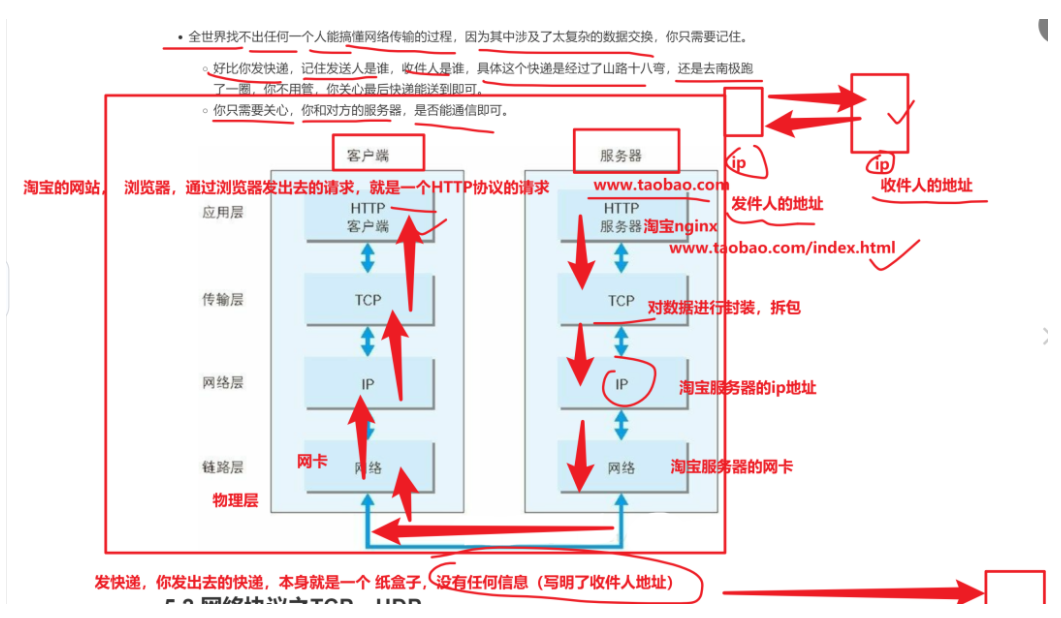
理解tcp和udp
tcp		用再网站的通信
是双方达成协议,速度慢,但是安全可靠

udp		(不管对方需不需要某个信息,还是疯狂输入给对面。  例如 刷视频就是通过 udp 发送的)
双发没有达成协议,速度快,不安全
netstat命令
network  status  网络状态命令
安装  yum install net-tools -y
命令   netstat
作用   查看网络连接状态
语法   netstat   -tunlp

参数
-t:表示只列出tcp 协议的连接;(你可以看到你的nginx的运行)

-n:表示将地址从字母组合转化成ip 地址,将协议转化成端口号来显示;(netsta默认会看到机器的主机名 -n 直接显示ip)

-l :表示过滤出"state(状态)"列中其值为LISTEN(监听)的连接;(你的nginx是否监听了0.0.0.0:80)确认端口在运行中,等待客户来访问

-p:表示显示发起连接的进程pid 和进程名称; (显示使用该端口的进程的id号)

-u  :查看udp连接  (ntpd服务)
ss命令
用法和netstat一模一样

ss -tunlp |grep nginx

在高并发场景, ss  比  netstat  性能要好
iftop
#安装  iftop命令
yum  install iftop  -y						动态


用起来和top命令很像,动态的掌握服务器的流量情况

能够看到你机器,有多少流量进来,有多少流量出去

 浙公网安备 33010602011771号