生产环境Linux常用命令【随时更新】
1. 查询文件中的关键字并高亮显示【查询当前目录关键字为elasticsearch的日志文件】
find ./ -name "my-elasticsearch.log" | xargs grep --color=auto "elasticsearch"
2. 查看日志文件后100行
tail -100f log_file.log
3. 另外一种查询关键字log的方法
grep -rn "二狗子" /logs/web.log --color
4. 查询并打印;匹配行之前和之后各2行
# 前2行
grep -rn '87419' web.log --color -A 2
# 后两行
grep -rn '87419' web.log --color -B 2
# 前后各两行
grep -rn '87419' web.log --color -C 2
5. 搜索压缩包里面的日志文件
zcat /logs/log.2019-11-26.log.gz | grep '430245187' --color
或者
zgrep --color '430245187' /logs/log.2019-11-26.log.gz
满足多个条件查询
# 同时满足多条件
zcat /logs/log.2019-11-26.log.gz | grep 'A' | grep 'B' --color
zgrep 'A' /logs/log.2019-11-26.log.gz | grep 'B' --color
满足任一条件
# 满足任一条件
zcat /logs/log.2019-11-26.log.gz | grep -E 'A|B|C' --color
zgrep --color -E 'A|B|C' /logs/log.2019-11-26.log.gz
6. 对接外部路由,用telnet查看地址通不通
# 目标地址是ip
$ telnet -b [本机地址] [目标地址] 8080

# 目标地址是url,不要带http://
$ telnet -b [本机地址] xxx.api.com 8888
Trying xxx.xx.xx.xxx...
Connected to xxx.api.com.
Escape character is '^]'.
7. 统计特定字符出现次数
grep 'key' app.log | wc -l
65
8. grep和zgrep定义
================grep================
Usage: grep [OPTION]... PATTERN [FILE]...
Search for PATTERN in each FILE or standard input.
PATTERN is, by default, a basic regular expression (BRE).
Example: grep -i 'hello world' menu.h main.c

Regexp selection and interpretation:
  -E, --extended-regexp     PATTERN is an extended regular expression (ERE)
  -F, --fixed-strings       PATTERN is a set of newline-separated fixed strings
  -G, --basic-regexp        PATTERN is a basic regular expression (BRE)
  -P, --perl-regexp         PATTERN is a Perl regular expression
  -e, --regexp=PATTERN      use PATTERN for matching
  -f, --file=FILE           obtain PATTERN from FILE
  -i, --ignore-case         ignore case distinctions
  -w, --word-regexp         force PATTERN to match only whole words
  -x, --line-regexp         force PATTERN to match only whole lines
  -z, --null-data           a data line ends in 0 byte, not newline

Miscellaneous:
  -s, --no-messages         suppress error messages
  -v, --invert-match        select non-matching lines
  -V, --version             print version information and exit
      --help                display this help and exit
      --mmap                ignored for backwards compatibility

Output control:
  -m, --max-count=NUM       stop after NUM matches
  -b, --byte-offset         print the byte offset with output lines
  -n, --line-number         print line number with output lines
      --line-buffered       flush output on every line
  -H, --with-filename       print the filename for each match
  -h, --no-filename         suppress the prefixing filename on output
      --label=LABEL         print LABEL as filename for standard input
  -o, --only-matching       show only the part of a line matching PATTERN
  -q, --quiet, --silent     suppress all normal output
      --binary-files=TYPE   assume that binary files are TYPE;
                            TYPE is `binary', `text', or `without-match'
  -a, --text                equivalent to --binary-files=text
  -I                        equivalent to --binary-files=without-match
  -d, --directories=ACTION  how to handle directories;
                            ACTION is `read', `recurse', or `skip'
  -D, --devices=ACTION      how to handle devices, FIFOs and sockets;
                            ACTION is `read' or `skip'
  -R, -r, --recursive       equivalent to --directories=recurse
      --include=FILE_PATTERN  search only files that match FILE_PATTERN
      --exclude=FILE_PATTERN  skip files and directories matching FILE_PATTERN
      --exclude-from=FILE   skip files matching any file pattern from FILE
      --exclude-dir=PATTERN  directories that match PATTERN will be skipped.
  -L, --files-without-match  print only names of FILEs containing no match
  -l, --files-with-matches  print only names of FILEs containing matches
  -c, --count               print only a count of matching lines per FILE
  -T, --initial-tab         make tabs line up (if needed)
  -Z, --null                print 0 byte after FILE name

Context control:
  -B, --before-context=NUM  print NUM lines of leading context
  -A, --after-context=NUM   print NUM lines of trailing context
  -C, --context=NUM         print NUM lines of output context
  -NUM                      same as --context=NUM
      --color[=WHEN],
      --colour[=WHEN]       use markers to highlight the matching strings;
                            WHEN is `always', `never', or `auto'
  -U, --binary              do not strip CR characters at EOL (MSDOS)
  -u, --unix-byte-offsets   report offsets as if CRs were not there (MSDOS)

`egrep' means `grep -E'.  `fgrep' means `grep -F'.
Direct invocation as either `egrep' or `fgrep' is deprecated.
With no FILE, or when FILE is -, read standard input.  If less than two FILEs
are given, assume -h.  Exit status is 0 if any line was selected, 1 otherwise;
if any error occurs and -q was not given, the exit status is 2.
================zgrep================
Usage: /usr/bin/zgrep [OPTION]... [-e] PATTERN [FILE]...
Look for instances of PATTERN in the input FILEs, using their
uncompressed contents if they are compressed.

OPTIONs are the same as for 'grep'.
9. 查看Java进程
ps -axl | grep java
0 1002 23094 1 20 0 7772196 57692 futex_ Sl ? 113:11 java -jar ljjjs.jar
每一列都代表什么
ps -axl
F   UID   PID  PPID PRI  NI    VSZ   RSS WCHAN  STAT TTY        TIME COMMAND
4     0     1     0  20   0 194128  4148 ep_pol Ss   ?        102:47 /usr/lib/systemd/systemd --switched-root --system --deserialize 22
1     0     2     0  20   0      0     0 kthrea S    ?          0:14 [kthreadd]
1     0     3     2  20   0      0     0 smpboo S    ?          1:45 [ksoftirqd/0]
1     0     5     2   0 -20      0     0 worker S<   ?          0:00 [kworker/0:0H]
解释:【来自网友】
- F 代表这个程序的旗标 (flag), 4 代表使用者为 superuser;
- S 代表这个程序的状态 (STAT);
- UID 代表执行者身份
- PID 进程的ID号!
- PPID 父进程的ID;
- C CPU使用的资源百分比
- PRI指进程的执行优先权(Priority的简写),其值越小越早被执行;
- NI 这个进程的nice值,其表示进程可被执行的优先级的修正数值。
- ADDR 这个是内核函数,指出该程序在内存的那个部分。如果是个执行 的程序,一般就是『 - 』
- SZ 使用掉的内存大小;
- WCHAN 目前这个程序是否正在运作当中,若为 - 表示正在运作;
- TTY 登入者的终端机位置;
- TIME 使用掉的 CPU 时间。
- CMD 所下达的指令名称
还有另外一种
ps -ef | grep java

oeeea   23094     1  0 May19 ?        01:53:13 java -jar ljjjs.jar
每一列
ps -ef
UID        PID  PPID  C STIME TTY          TIME CMD
root         1     0  0 Feb20 ?        01:42:49 /usr/lib/systemd/systemd --switched-root --system --deserialize 22
root         2     0  0 Feb20 ?        00:00:14 [kthreadd]
root         3     2  0 Feb20 ?        00:01:45 [ksoftirqd/0]
root         5     2  0 Feb20 ?        00:00:00 [kworker/0:0H]
10. 查看内存
$ free -h
              total        used        free      shared  buff/cache   available
Mem:            15G         14G        182M        213M        606M        158M
Swap:           15G         14G        1.9G
11. 查看端口
# 查看8019端口有没有占有
$ netstat -tunlp | grep 8019
(Not all processes could be identified, non-owned process info
 will not be shown, you would have to be root to see it all.)
tcp6       0      0 :::8019                 :::*                    LISTEN      -

# 查看所有端口
$ netstat -tunlp
或者
$ ps aux | head -1;ps aux | grep 6379
USER       PID %CPU %MEM    VSZ   RSS TTY      STAT START   TIME COMMAND
admin-+ 19791  0.0  0.0 112712   960 pts/13   S+   17:59   0:00 grep --color=auto 6379
root     27312  0.1  0.0 159652  1192 ?        Sl   Jun15 128:44 redis-server 10.20.26.49:6379
12. 给文件夹赋以最高权限
$ chmod -R 777 [/your_folder]
13. 查看CPU占用最高的进程/内存最高的进程
写法一:
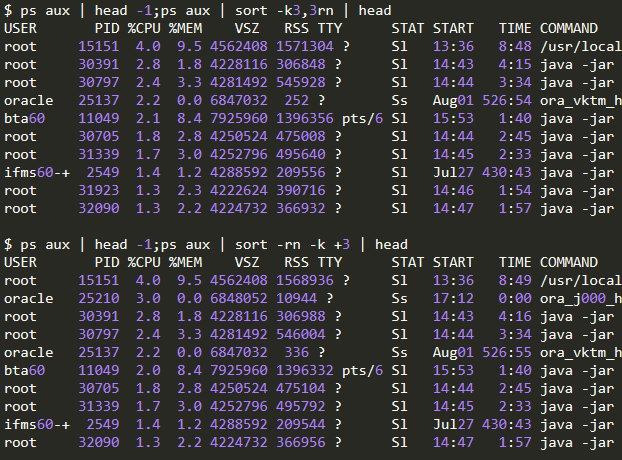
# CPU排序
ps aux | head -1;ps aux | sort -k3,3rn | head

# 内存排序
ps aux | head -1;ps aux | sort -k4,4rn | head
写法二:
# CPU排序
ps aux | head -1;ps aux | sort -rn -k +3 | head

# 内存排序
ps aux | head -1;ps aux | sort -rn -k +4 | head
解释:
1. 为了显示列标题:ps aux | head -1
2. $ ps -aux
USER PID %CPU %MEM VSZ RSS TTY STAT START TIME COMMAND注意:CPU在第三,MEM在第四
3. sort参数:
-n 依照数值的大小排序。
-r 以相反的顺序来排序。
-k 指定域。总结:-rn是倒序,-k是指定排序的列,后面的数字是第几列
实例:
7. 查看进程所在位置
有时候我们想知道某个应用在哪个目录,或者监听了某个端口的进程在哪个目录
ps aux | head -1;ps aux | grep redis
netstat -tunlp | grep 6379
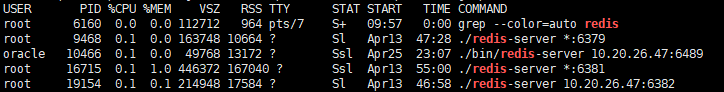

得到PID 9468
然后执行:ll /proc/9468
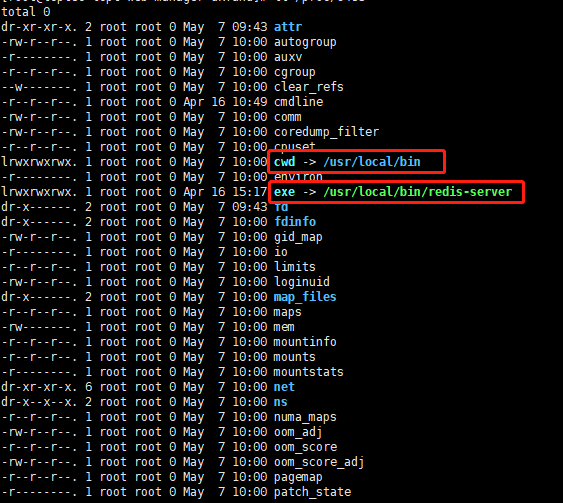
第一个是所在目录,第二个是可执行程序的绝对路径
8. 磁盘清理
# 查看磁盘使用
$df -h
# 查看大文件,指定目录
$du -s /home/admin/* | sort -nr
小LUA
面对敌人的严刑逼供,我一个字也没说,而是一五一十写了下来。

 浙公网安备 33010602011771号