![]()
%% ================================读取ECG信号=============================%%
clc;clear all;
addpath(genpath('D:\PLMS\ECGDataProcess\Mit-Bih-ECG-Signal'));
[TIME,M,Fs,siginfo]=rdmat('100m');
%% ===============================小波阈值去噪============================= %%
%应用db5作为小波函数进行三层分解
%利用无偏似然估计阈值
%对100.dat的单导联数据进行去噪
E1=M(:,1); % M为第二篇中对100.dat文件处理后得到的数据矩阵,M(:,1)指MLII导联数据,M(:,2)指V5导联数据
E1=E1';
n1=size(E1);
figure;
plot(E1)
% s1=E1(1:2000);
%小波分解
[C1 L1]=wavedec(E1,6,'db5');
%从C中提取尺度3下的近似小波系数
cA6_1=appcoef(C1,L1,'db5',6);
%从信号C中提取尺度1,2,3下的细节小波系数
cD1_1=detcoef(C1,L1,1);
cD2_1=detcoef(C1,L1,2);
cD3_1=detcoef(C1,L1,3);
cD4_1=detcoef(C1,L1,4);
cD5_1=detcoef(C1,L1,5);
cD6_1=detcoef(C1,L1,6);
figure;
subplot(711);plot(cA6_1);ylabel('近似信号a6'); %画出各层小波系数
title('小波分解示意图');
subplot(712);plot(cD6_1);ylabel('细节信号d6');
subplot(713);plot(cD5_1);ylabel('细节信号d5');
subplot(714);plot(cD4_1);ylabel('细节信号d4');
subplot(715);plot(cD3_1);ylabel('细节信号d3');
subplot(716);plot(cD2_1);ylabel('细节信号d2');
subplot(717);plot(cD1_1);ylabel('细节信号d1');
xlabel('采样点数');
%使用stein的无偏似然估计原理进行选择各层的阈值
%cD1_1,cD2_1,cD3_1为各层小波系数
%rigrsure为无偏似然估计的阈值类型
thr=thselect(E1,'rigrsure');
ysoft6=wthresh(cD6_1,'s',thr);
ysoft5=wthresh(cD5_1,'s',thr);
ysoft4=wthresh(cD4_1,'s',thr);
ysoft3=wthresh(cD3_1,'s',thr);
ysoft2=wthresh(cD2_1,'s',thr);
ysoft1 = wthresh(cD1_1,'s',thr);
cA6_1 = zeros(1,346);
C = [cA6_1,ysoft6,ysoft5,ysoft4,ysoft3,ysoft2,ysoft1];
XC1 = waverec(C,L1,'db5');
% thr2_1=thselect(cD2_1,'rigrsure');
% thr3_1=thselect(cD3_1,'rigrsure');
% thr4_1=thselect(cD4_1,'rigrsure');
% thr5_1=thselect(cD5_1,'rigrsure');
% thr6_1=thselect(cD6_1,'rigrsure');
%各层的阈值
TR1=[2,thr6_1,thr5_1,thr4_1,thr3_1,thr2_1];
%'s'为软阈值,'h'为硬阈值
SORH1='s';
% [thr,sorh,keepapp] = ddencmp('den','wv',E1);
% [XC1,CXC1,LXC1,PERF0_1,PERF2_1] = wdencmp('gbl',E1,'db5',6,thr,sorh,keepapp);
%----------去噪----------
% XC为去噪后信号
% [CXC,LXC]为小波分解结构
% PERF0和PERF2是恢复和压缩的范数百分比
% 'lvd'为允许设置各层的阈值
% 'gbl'为固定阈值
% 3为阈值的长度
% [XC1,CXC1,LXC1,PERF0_1,PERF2_1]=wdencmp('lvd',E1,'db5',6,TR1,SORH1);
%-----------利用waverec重构----------------
cD1_1 = zeros(1,10804);
cA6_1 = zeros(1,346);
C = [cA6_1,cD6_1,cD5_1,cD4_1,cD3_1,cD2_1,cD1_1];
XC1 = waverec(C,L1,'db5');
%画图
figure;
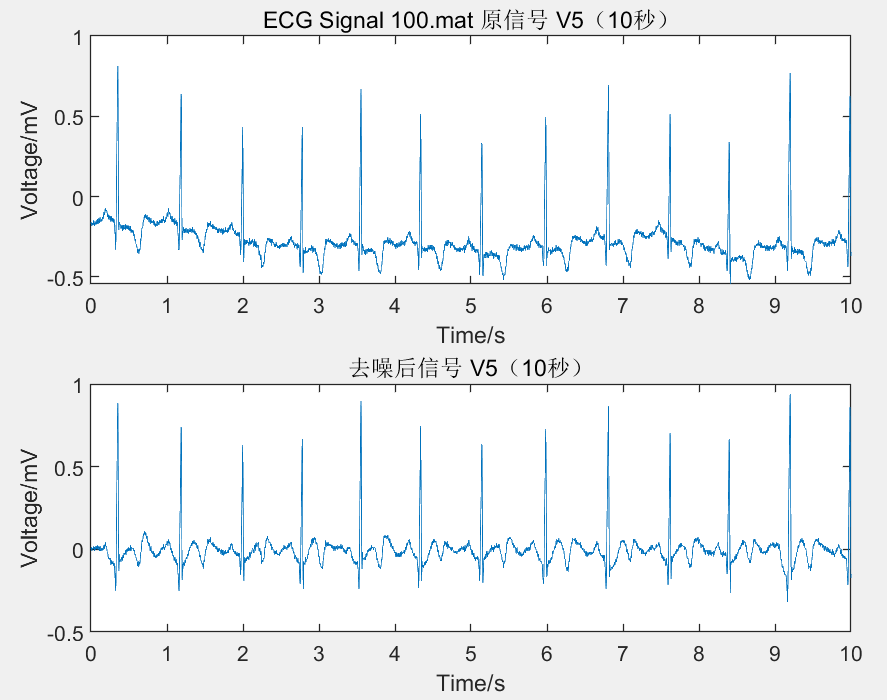
subplot(2,1,1);plot(TIME,E1);title('ECG Signal 100.mat 原信号 V5(10秒)');
xlabel('Time/s');ylabel('Voltage/mV');
xlim([0 10]);
subplot(2,1,2);plot(TIME,XC1);title('去噪后信号 V5(10秒)');
xlabel('Time/s');ylabel('Voltage/mV');
xlim([0 10]);
%----------去噪效果衡量----------
%SNR越大效果越好,MSE越小越好
%选取信号的长度
N1=n1(2);
x1=E1;
y1=XC1;
F1=0;
MM1=0;
for ii=1:N1
m1(ii)=(x1(ii)-y1(ii))^2;
t1(ii)=y1(ii)^2;
f1(ii)=t1(ii)/m1(ii);
F1=F1+f1(ii);
MM1=MM1+m1(ii);
end;
SNR1=10*log10(F1);
MSE1=MM1/N1;
SM1=SNR1/MSE1;
%打印结果
disp('****************信号2****************')
disp('** **')
disp(['**',' SNR1=',num2str(SNR1),' MSE1=',num2str(MSE1),' **']);
disp('** **')
disp('****************去噪效果****************')

 浙公网安备 33010602011771号