
Linux perf:周期性采样实现简析
1. 周期性采样实现
本文以 Linux 4.14.x 内核代码,简要分析 perf 子系统周期性采样实现扼要。
1.1 打开事件对象
以 PERF_COUNT_SW_TASK_CLOCK 事件为例,从用户空间代码开始:
static long perf_event_open(struct perf_event_attr *attr, pid_t pid,
                            int cpu, int group_fd, unsigned long flags)
{
	/* 系统调用 sys_perf_event_open() */
    return syscall(__NR_perf_event_open, attr, pid, cpu, group_fd, flags);
}
struct perf_event_attr attr;

memset(&attr, sizeof(attr), 0);
attr.type = PERF_TYPE_SOFTWARE;
attr.size = sizeof(attr);
attr.config = PERF_COUNT_SW_TASK_CLOCK;
attr.sample_period = 100000;
attr.sample_type = PERF_SAMPLE_IP | PERF_SAMPLE_TID | PERF_SAMPLE_TIME |
					PERF_SAMPLE_CPU | PERF_SAMPLE_PERIOD;
attr.read_format = PERF_FORMAT_TOTAL_TIME_ENABLED |
					PERF_FORMAT_TOTAL_TIME_RUNNING | PERF_FORMAT_ID;
attr.wakeup_events = 1;
attr.disabled = 1;
attr.exclude_kernel = 1;
attr.exclude_hv = 1;
fd = perf_event_open(&attr, 0, -1, -1, 0);
sys_perf_event_open() 使流程进入内核空间部分:
/* kernel/events/core.c */
SYSCALL_DEFINE5(perf_event_open,
struct perf_event_attr __user *, attr_uptr,
pid_t, pid, int, cpu, int, group_fd, unsigned long, flags)
{
...
struct perf_event *event, *sibling;
struct perf_event_attr attr;
struct perf_event_context *ctx, *uninitialized_var(gctx);
struct file *event_file = NULL;
...
struct pmu *pmu;
...
...
/* 拷贝 用户空间 attr 到 内核空间 */
err = perf_copy_attr(attr_uptr, &attr);
...
/* (1) 创建初始化 perf_event 对象 */
event = perf_event_alloc(&attr, cpu, task, group_leader, NULL,
NULL, NULL, cgroup_fd);
...
pmu = event->pmu;
...
if (pmu->task_ctx_nr == perf_sw_context)
event->event_caps |= PERF_EV_CAP_SOFTWARE;
...
/*
* Get the target context (task or percpu):
*/
/* (2) 获取 或 分配 perf_event_context */
ctx = find_get_context(pmu, task, event);
...
/* (3) 创建 perf 事件文件对象, 绑定 [perf_event + file + 文件操作接口 perf_fops] */
event_file = anon_inode_getfile("[perf_event]", &perf_fops, event,
f_flags);
...
if (!task) {
/*
* Check if the @cpu we're creating an event for is online.
*
* We use the perf_cpu_context::ctx::mutex to serialize against
* the hotplug notifiers. See perf_event_{init,exit}_cpu().
*/
struct perf_cpu_context *cpuctx =
container_of(ctx, struct perf_cpu_context, ctx);
...
}
...
/*
* Precalculate sample_data sizes; do while holding ctx::mutex such
* that we're serialized against further additions and before
* perf_install_in_context() which is the point the event is active and
* can use these values.
*/
/*
* 设定 perf_event @event 的:
* . 读数据大小: @perf_event::read_size
* . perf.data 头部大小: @perf_event::header_size
*/
perf_event__header_size(event);
/* 设定 perf_event @event 事件的 id header (perf_event::id_header_size) 大小 */
perf_event__id_header_size(event);
event->owner = current;
/* (4) 调度 perf_event */
perf_install_in_context(ctx, event, event->cpu);
...
/* 由当前进程发起的 perf_event, 添加到当前进程的 perf_event 列表 */
mutex_lock(¤t->perf_event_mutex);
list_add_tail(&event->owner_entry, ¤t->perf_event_list);
mutex_unlock(¤t->perf_event_mutex);
...
/*
* Drop the reference on the group_event after placing the
* new event on the sibling_list. This ensures destruction
* of the group leader will find the pointer to itself in
* perf_group_detach().
*/
...
fd_install(event_fd, event_file);
return event_fd; /* 返回指代 perf_event 的句柄 */
...
}
流程经系统调用 sys_perf_event_open() 进入内核空间后,创建 perf 事件对象的过程中,主要工作包括代码注释中 (1),(2),(3),(4) 这 4 处,下面来一一做简要分析。
- 创建
perf_event对象,按 perf_event 的类型,绑定初始化PMU
/*
 * Allocate and initialize a event structure
 */
static struct perf_event *
perf_event_alloc(struct perf_event_attr *attr, int cpu,
		 struct task_struct *task,
		 struct perf_event *group_leader,
		 struct perf_event *parent_event,
		 perf_overflow_handler_t overflow_handler,
		 void *context, int cgroup_fd)
{
	struct pmu *pmu;
	struct perf_event *event;
	struct hw_perf_event *hwc;
	long err = -EINVAL;

	...

	/* 创建 perf_event 对象, 初始为全 0 */
	event = kzalloc(sizeof(*event), GFP_KERNEL);
	...

	atomic_long_set(&event->refcount, 1);
	event->cpu		= cpu;
	event->attr		= *attr;
	...
	event->pmu		= NULL;
	event->oncpu		= -1;

	...

	event->state		= PERF_EVENT_STATE_INACTIVE; /* 初始为 INACTIVE 状态 */

	...

	/* 设置 event clock */
	event->clock = &local_clock;
	...

	/* 设置 event overflow handler */
	if (overflow_handler) {
		...
	} else if (is_write_backward(event)){
		..
	} else {
		event->overflow_handler = perf_event_output_forward;
		event->overflow_handler_context = NULL;
	}

	...

	pmu = NULL;

	/* event 是按 freq 或 period 进行采样, 这里设定 freq 或 period */
	hwc = &event->hw;
	hwc->sample_period = attr->sample_period;
	if (attr->freq && attr->sample_freq)
		hwc->sample_period = 1; /* 设置 freq 的情况下, period 设为 1 */
	hwc->last_period = hwc->sample_period;

	local64_set(&hwc->period_left, hwc->sample_period);

	...

	/* 按 perf_event 的类型匹配、并初始化 pmu, 然后绑定 perf_event 和 pmu */
	pmu = perf_init_event(event);
	...

	return event;

	...
}

static struct pmu *perf_init_event(struct perf_event *event)
{
	struct pmu *pmu;
	int idx;
	int ret;

	idx = srcu_read_lock(&pmus_srcu);

	/* Try parent's PMU first: */
	if (event->parent && event->parent->pmu) {
		pmu = event->parent->pmu;
		ret = perf_try_init_event(pmu, event);
		if (!ret)
			goto unlock;
	}

	/* 按 perf_event::attr::type 匹配 pmu:
	 * 从自动分配类型 ID (即 perf_pmu_register() 注册 pmu 时,
	 * 指定 @type < 0) 的 pmu 类型中寻找.
	 */
	rcu_read_lock();
	pmu = idr_find(&pmu_idr, event->attr.type);
	rcu_read_unlock();
	if (pmu) {
		ret = perf_try_init_event(pmu, event); /* 按 perf_event::attr::config 子类型匹配事件接口 */
		if (ret)
			pmu = ERR_PTR(ret);
		goto unlock;
	}

	/*
	 * 没能从自动分配类型 ID 的中找到匹配的 pmu,
	 * 则从系统中所有的 pmu 列表中进行匹配.
	 */
	list_for_each_entry_rcu(pmu, &pmus, entry) {
		ret = perf_try_init_event(pmu, event);
		if (!ret)
			goto unlock;

		if (ret != -ENOENT) {
			pmu = ERR_PTR(ret);
			goto unlock;
		}
	}
	pmu = ERR_PTR(-ENOENT);
unlock:
	srcu_read_unlock(&pmus_srcu, idx);

	return pmu; /* 返回匹配的 PMU,没匹配时返回错误码 -ENOENT */
}
通过 perf_try_init_event() 尝试匹配 perf_event 的 PMU,这些被匹配的 PMU 来自 perf_pmu_register() 注册的对象。 看看 perf_try_init_event() 的细节:
static int perf_try_init_event(struct pmu *pmu, struct perf_event *event)
{
	struct perf_event_context *ctx = NULL;
	int ret;

	...

	event->pmu = pmu; /* 设定 perf_event 关联的 PMU 对象 */
	/*
	 * kernel/events/core.c, perf_task_clock: task_clock_event_init()
	 * 返回 ENOENT 表示初始化的 type 不匹配, 需尝试其它类型的 pmu.
	 */
	ret = pmu->event_init(event);

	...

	return ret;
}
在 perf_try_init_event() 中调用 PMU 的 event_init 接口,如果 PMU 的 event_init 接口不返回 -ENOENT,则表示匹配成功,否则匹配失败。我们的场景会匹配到 perf_task_clock PMU 对象:
static struct pmu perf_task_clock = {
	.task_ctx_nr	= perf_sw_context,

	.capabilities	= PERF_PMU_CAP_NO_NMI,

	.event_init	= task_clock_event_init,
	.add		= task_clock_event_add,
	.del		= task_clock_event_del,
	.start		= task_clock_event_start,
	.stop		= task_clock_event_stop,
	.read		= task_clock_event_read,
};
perf_task_clock PMU 对象的 event_init 接口 task_clock_event_init() 中做如下工作:
static int task_clock_event_init(struct perf_event *event)
{
	if (event->attr.type != PERF_TYPE_SOFTWARE)
		return -ENOENT;

	if (event->attr.config != PERF_COUNT_SW_TASK_CLOCK)
		return -ENOENT;

	...

	perf_swevent_init_hrtimer(event);

	return 0;
}

static void perf_swevent_init_hrtimer(struct perf_event *event)
{
	struct hw_perf_event *hwc = &event->hw;

	if (!is_sampling_event(event)) /* 非 sample 类型 event, 无需 hrtimer 做 period sample */
		return;

	hrtimer_init(&hwc->hrtimer, CLOCK_MONOTONIC, HRTIMER_MODE_REL);
	hwc->hrtimer.function = perf_swevent_hrtimer;

	...
}
在 task_clock_event_init() 中,按 perf_event_attr::type 和 perf_event_attr::config 匹配 PMU,然后初始化了一个周期性进行数据采样的 hrtimer,该定时器的回调接口为 perf_swevent_hrtimer()。perf_swevent_hrtimer() 的细节在下一小节进行分析。那这个 hrtimer 什么时候启动呢?这里暂时按下不表,后续会对此做出分析。这里继续看 perf_event 绑定匹配的 PMU 之后的流程。
- 创建
perf_event运行的上下文对象perf_event_context
sys_perf_event_open()
	//perf_event_alloc()
	ctx = find_get_context(pmu, task, event);

/*
 * Returns a matching context with refcount and pincount.
 */
static struct perf_event_context *
find_get_context(struct pmu *pmu, struct task_struct *task,
		struct perf_event *event)
{
	struct perf_event_context *ctx, *clone_ctx = NULL;
	struct perf_cpu_context *cpuctx;
	void *task_ctx_data = NULL;
	unsigned long flags;
	int ctxn, err;
	int cpu = event->cpu;

	/* 非 进程 perf event, 针对整个系统, 使用 per-cpu 的 context */
	if (!task) {
		...

		cpuctx = per_cpu_ptr(pmu->pmu_cpu_context, cpu);
		ctx = &cpuctx->ctx;
		get_ctx(ctx);
		++ctx->pin_count;

		return ctx;
	}

	...
}
- 为 perf_event 创建文件对象并初始化
static const struct file_operations perf_fops = {
	.llseek			= no_llseek,
	.release		= perf_release,
	.read			= perf_read,
	.poll			= perf_poll,
	.unlocked_ioctl		= perf_ioctl,
	.compat_ioctl		= perf_compat_ioctl,
	.mmap			= perf_mmap,
	.fasync			= perf_fasync,
};

sys_perf_event_open()
	//perf_event_alloc()
	//ctx = find_get_context(pmu, task, event);
	event_file = anon_inode_getfile("[perf_event]", &perf_fops, event,
					f_flags);
- 调度 perf_event 启动执行
sys_perf_event_open()
	//perf_event_alloc()
	//ctx = find_get_context(pmu, task, event);
	//event_file = anon_inode_getfile("[perf_event]", &perf_fops, event,
	//				f_flags);
	perf_install_in_context(ctx, event, event->cpu);
		...
		ctx_sched_in()
			...
			group_sched_in()
				event_sched_in()

static int
event_sched_in(struct perf_event *event,
		 struct perf_cpu_context *cpuctx,
		 struct perf_event_context *ctx)
{
	u64 tstamp = perf_event_time(event);
	int ret = 0;

	...

	WRITE_ONCE(event->oncpu, smp_processor_id()); /* 标记 event 所在的 event */
	/*
	 * Order event::oncpu write to happen before the ACTIVE state
	 * is visible.
	 */
	smp_wmb();
	WRITE_ONCE(event->state, PERF_EVENT_STATE_ACTIVE); /* 标记 event 为 ACTIVE 状态 */

	...

	/* kernel/events/core.c,  perf_task_clock: task_clock_event_add() [启动 event hrtimer] */
	if (event->pmu->add(event, PERF_EF_START)) {
		/* 失败 */
		event->state = PERF_EVENT_STATE_INACTIVE;
		event->oncpu = -1;
		ret = -EAGAIN;
		goto out;
	}

	...

out:
	perf_pmu_enable(event->pmu); /* 启用 PMU */

	return ret;
}
我们测试例子的上下文,触发 task_clock_event_add() 回调,期间会启动采样 hrtimer:
static int task_clock_event_add(struct perf_event *event, int flags)
{
	if (flags & PERF_EF_START)
		task_clock_event_start(event, flags);
	perf_event_update_userpage(event);

	return 0;
}

static void task_clock_event_start(struct perf_event *event, int flags)
{
	local64_set(&event->hw.prev_count, event->ctx->time);
	perf_swevent_start_hrtimer(event);
}

static void perf_swevent_start_hrtimer(struct perf_event *event)
{
	struct hw_perf_event *hwc = &event->hw;
	s64 period;

	/*
	 * 非采样类型事件: 即 perf_event::attr.sample_period == 0,
	 * 不启动 hrtimer.
	 */
	if (!is_sampling_event(event))
		return;

	/* 启动/重启 event sample hrtimer */
	period = local64_read(&hwc->period_left);
	if (period) {
		if (period < 0)
			period = 10000;

		local64_set(&hwc->period_left, 0);
	} else {
		period = max_t(u64, 10000, hwc->sample_period);
	}
	/* perf_swevent_hrtimer() */
	hrtimer_start(&hwc->hrtimer, ns_to_ktime(period),
		      HRTIMER_MODE_REL_PINNED);
}
到此,对于 perf_event 的创建过程已经完成,sys_perf_event_open() 会返回一个文件句柄指代该 perf_event 对象。另外,这里已经回答了前面提到的 hrtimer 什么时候启动的问题:在 perf_install_in_context() 调用链中启动了 hrtimer。
1.2 创建事件数据 ring buffer
perf_event 事件采样数据,使用 ring_buffer 来存储,接下来简要分析其建立过程。先看用户空间部分:
#define BUFFER_SIZE (1 << 18)  // 256KB
#define PAGE_SIZE 4096

size_t mmap_size = PAGE_SIZE + BUFFER_SIZE;
char *buffer = mmap(NULL, mmap_size, PROT_READ | PROT_WRITE, MAP_SHARED, fd, 0);
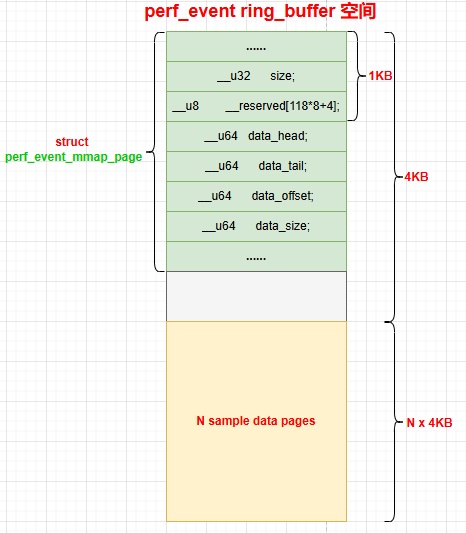
为什么 mmap_size 设置为 PAGE_SIZE + BUFFER_SIZE 这么个尺寸?首先,perf 的采样数据头部有一个管理数据 perf_event_mmap_page,使用一个 page,在第一个 page 之后紧跟的才是采样数据,后面再说其细节。另外,perf 要求数据缓冲大小对齐到 page。
继续看内核空间的细节:
sys_mmap()
	...
	perf_mmap()

static int perf_mmap(struct file *file, struct vm_area_struct *vma)
{
	struct perf_event *event = file->private_data;
	unsigned long user_locked, user_lock_limit;
	struct user_struct *user = current_user();
	unsigned long locked, lock_limit;
	struct ring_buffer *rb = NULL;
	unsigned long vma_size;
	unsigned long nr_pages;
	long user_extra = 0, extra = 0;
	int ret = 0, flags = 0;

	vma_size = vma->vm_end - vma->vm_start; /* mmap() 空间大小 */

	if (vma->vm_pgoff == 0) {
		nr_pages = (vma_size / PAGE_SIZE) - 1; /* 计算页面数: 减 1 个页面是 ring_buffer::user_page */
	} else {
		...
	}

	...

	user_extra = nr_pages + 1;

	...

	if (!rb) {
		/* 创建事件 @event 的 mmap 的 ring_buffer */
		rb = rb_alloc(nr_pages,
			      event->attr.watermark ? event->attr.wakeup_watermark : 0,
			      event->cpu, flags);
		...

		/* 设定 @event 的 ring_buffer 为 @rb */
		ring_buffer_attach(event, rb);

		perf_event_init_userpage(event);
		perf_event_update_userpage(event);
	} else {
		...
	}

	...

	/*
	 * Since pinned accounting is per vm we cannot allow fork() to copy our
	 * vma.
	 */
	vma->vm_flags |= VM_DONTCOPY | VM_DONTEXPAND | VM_DONTDUMP;
	vma->vm_ops = &perf_mmap_vmops;

	...
}

struct ring_buffer *rb_alloc(int nr_pages, long watermark, int cpu, int flags)
{
	struct ring_buffer *rb;
	unsigned long size;
	void *all_buf;

	size = sizeof(struct ring_buffer);
	size += sizeof(void *); /* ring_buffer::data_pages[0] 指针空间 */

	/* 创建 ring_buffer 对象, 初始化为 0 */
	rb = kzalloc(size, GFP_KERNEL);
	if (!rb)
		goto fail;

	INIT_WORK(&rb->work, rb_free_work);

	/* 分配 nr_pages + 1 个 page */
	all_buf = vmalloc_user((nr_pages + 1) * PAGE_SIZE);
	if (!all_buf)
		goto fail_all_buf;

	rb->user_page = all_buf;
	rb->data_pages[0] = all_buf + PAGE_SIZE;
	if (nr_pages) {
		rb->nr_pages = 1;
		rb->page_order = ilog2(nr_pages);
	}

	ring_buffer_init(rb, watermark, flags);

	return rb;

	...
}

static void ring_buffer_attach(struct perf_event *event,
			       struct ring_buffer *rb)
{
	struct ring_buffer *old_rb = NULL;
	unsigned long flags;

	...

	if (rb) {
		if (event->rcu_pending) {
			cond_synchronize_rcu(event->rcu_batches);
			event->rcu_pending = 0;
		}

		spin_lock_irqsave(&rb->event_lock, flags);
		list_add_rcu(&event->rb_entry, &rb->event_list); /* 添加到 ring_buffer 的 perf_event 事件列表 */
		spin_unlock_irqrestore(&rb->event_lock, flags);
	}

	...

	rcu_assign_pointer(event->rb, rb); /* 设定 perf_event @event 的 ring_buffer 为 @rb */

	...
}
从上面的分析知道,perf_event 采样数据使用 ring_buffer 存储,其空间构成如下:
1.3 更新事件数据
在我们示例的场景中,启动 hrtimer 来采集数据,具体是在 perf_swevent_hrtimer() 回调中,看看细节:
static enum hrtimer_restart perf_swevent_hrtimer(struct hrtimer *hrtimer)
{
	enum hrtimer_restart ret = HRTIMER_RESTART;
	struct perf_sample_data data;
	struct pt_regs *regs;
	struct perf_event *event;
	u64 period;

	event = container_of(hrtimer, struct perf_event, hw.hrtimer);

	if (event->state != PERF_EVENT_STATE_ACTIVE) /* 事件未激活, 不再重启 hrtimer */
		return HRTIMER_NORESTART;

	/*
	 * (1) PMU 数据读取
	 * perf_task_clock: task_clock_event_read()
	 */
	event->pmu->read(event);

	perf_sample_data_init(&data, 0, event->hw.last_period);
	regs = get_irq_regs();

	if (regs/*中断上下文*/ && !perf_exclude_event(event, regs)/*不是 exclude event*/) {
		if (!(event->attr.exclude_idle && is_idle_task(current)))
			/* (2) 更新采样数据到 perf_event 的 ring_buffer */
			if (__perf_event_overflow(event, 1, &data, regs))
				ret = HRTIMER_NORESTART;
	}

	/* 重启 hrtimer, 进行下一采样 */
	period = max_t(u64, 10000, event->hw.sample_period);
	hrtimer_forward_now(hrtimer, ns_to_ktime(period));

	return ret;
}
首先在上面代码 (1) 处是做 PMU 数据的读取,具体到我们的场景是更新任务消耗的时间:
static void task_clock_event_read(struct perf_event *event)
{
	u64 now = perf_clock(); /* 读取当前时间 */
	u64 delta = now - event->ctx->timestamp; /* 自从上次读取后流逝的时间 */
	u64 time = event->ctx->time + delta; /* 当前时间 */

	task_clock_event_update(event, time);
}

static void task_clock_event_update(struct perf_event *event, u64 now)
{
	u64 prev;
	s64 delta;

	prev = local64_xchg(&event->hw.prev_count, now);
	delta = now - prev;
	local64_add(delta, &event->count);
}
然后在上面代码 (2) 处将 (1) 处读取的 PMU 数据,更新写入到 perf_event 的 ring_buffer 中:
__perf_event_overflow()
	perf_event_output_forward()
		__perf_event_output(event, data, regs, perf_output_begin_forward);

static void __always_inline
__perf_event_output(struct perf_event *event,
		    struct perf_sample_data *data,
		    struct pt_regs *regs,
		    int (*output_begin)(struct perf_output_handle *,
					struct perf_event *,
					unsigned int))
{
	struct perf_output_handle handle;
	struct perf_event_header header;

	/* protect the callchain buffers */
	rcu_read_lock();

	/* 准备好采样数据 */
	perf_prepare_sample(&header, data, event, regs);

	/*
	 * 做采样数据 ring_buffer 写入的准备工作:
	 * - 包括移动写入位置指针 `ring_buffer::head`,
	 * - 选定当前写入内存页面, 以及当前写入内存页面写入偏移位置的设定
	 */
	if (output_begin(&handle, event, header.size)) /* perf_output_begin_forward() */
		goto exit;

	/* 将 event 采样数据写入到 event 的 ring buffer @event->rb */
	perf_output_sample(&handle, &header, data, event);

	/* 将 ring_buffer 当前可读数据位置 ring_buffer::head 同步到 用户空间,然后唤醒数据读取等待进程 */
	perf_output_end(&handle);

exit:
	rcu_read_unlock();
}
首先,perf_prepare_sample() 准备好采样数据 perf_sample_data:
struct perf_sample_data {
	/*
	 * Fields set by perf_sample_data_init(), group so as to
	 * minimize the cachelines touched.
	 */
	u64				addr;
	struct perf_raw_record		*raw;
	struct perf_branch_stack	*br_stack;
	u64				period;
	u64				weight;
	u64				txn;
	union  perf_mem_data_src	data_src;

	/*
	 * The other fields, optionally {set,used} by
	 * perf_{prepare,output}_sample().
	 */
	/*
	 * 采样的所有数据类型掩码:
	 * PERF_SAMPLE_IDENTIFIER, PERF_SAMPLE_IP, ...
	 * PERF_SAMPLE_PERIOD, PERF_SAMPLE_READ, ...
	 * 如:
	 * PERF_SAMPLE_IP | PERF_SAMPLE_TID | PERF_SAMPLE_TIME |
	 * PERF_SAMPLE_CPU | PERF_SAMPLE_PERIOD | ...
	 */
	u64				type;
	u64				ip;
	struct {
		u32	pid;
		u32	tid;
	}				tid_entry;
	u64				time;
	u64				id;
	u64				stream_id;
	struct {
		u32	cpu;
		u32	reserved;
	}				cpu_entry;
	struct perf_callchain_entry	*callchain;

	/*
	 * regs_user may point to task_pt_regs or to regs_user_copy, depending
	 * on arch details.
	 */
	struct perf_regs		regs_user;
	struct pt_regs			regs_user_copy;

	struct perf_regs		regs_intr;
	u64				stack_user_size;

	u64				phys_addr;
} ____cacheline_aligned;
void perf_prepare_sample(struct perf_event_header *header,
			 struct perf_sample_data *data,
			 struct perf_event *event,
			 struct pt_regs *regs)
{
	u64 sample_type = event->attr.sample_type;

	header->type = PERF_RECORD_SAMPLE; /* 标记为采样数据类型 */
	header->size = sizeof(*header) + event->header_size; /* 一个 sample 的数据总长度,包括 perf_event_header 和 sample 数据 */

	...

	/* 填充 ID 类型采样数据 */
	__perf_event_header__init_id(header, data, event);

	/* PC 指针采样数据 */
	if (sample_type & PERF_SAMPLE_IP)
		data->ip = perf_instruction_pointer(regs);

	/* 其它采样数据填充 */
	...
}

static void __perf_event_header__init_id(struct perf_event_header *header,
					 struct perf_sample_data *data,
					 struct perf_event *event)
{
	u64 sample_type = event->attr.sample_type;

	data->type = sample_type;
	header->size += event->id_header_size;

	if (sample_type & PERF_SAMPLE_TID) {
		/* namespace issues */
		data->tid_entry.pid = perf_event_pid(event, current);
		data->tid_entry.tid = perf_event_tid(event, current);
	}

	if (sample_type & PERF_SAMPLE_TIME)
		data->time = perf_event_clock(event);

	if (sample_type & (PERF_SAMPLE_ID | PERF_SAMPLE_IDENTIFIER))
		data->id = primary_event_id(event);

	if (sample_type & PERF_SAMPLE_STREAM_ID)
		data->stream_id = event->id;

	if (sample_type & PERF_SAMPLE_CPU) {
		data->cpu_entry.cpu	 = raw_smp_processor_id();
		data->cpu_entry.reserved = 0;
	}
}
然后,perf_output_begin_forward() 做采样数据 ring_buffer 写入的准备工作:包括移动写入位置指针 ring_buffer::head,以及写入内存页面位置的选定。
perf_output_begin_forward()
	__perf_output_begin(handle, event, size, false)

static int __always_inline
__perf_output_begin(struct perf_output_handle *handle,
		    struct perf_event *event, unsigned int size,
		    bool backward)
{
	struct ring_buffer *rb;
	unsigned long tail, offset, head;
	int have_lost, page_shift;
	struct {
		struct perf_event_header header;
		u64			 id;
		u64			 lost;
	} lost_event;

	rcu_read_lock();
	...

	rb = rcu_dereference(event->rb);
	...

	handle->rb    = rb;
	handle->event = event;
	...

	/* 移动 rb->head 指针 */
	do {
		tail = READ_ONCE(rb->user_page->data_tail);
		offset = head = local_read(&rb->head);

		...

		if (!backward)
			head += size;
		else
			...
	}  while (local_cmpxchg(&rb->head, offset, head) != offset); /* 更新 ring_buffer 写入位置 rb->head */

	...

	page_shift = PAGE_SHIFT + page_order(rb);

	handle->page = (offset >> page_shift) & (rb->nr_pages - 1); /* 选定数据写入 page */
	offset &= (1UL << page_shift) - 1;
	handle->addr = rb->data_pages[handle->page] + offset; /* 确定相对于选定写入 page 偏移地址 */
	handle->size = (1UL << page_shift) - offset;

	...

	return 0;

	...
}
接着,perf_output_sample() 将 perf_prepare_sample() 准备好的采样数据写入到 ring_buffer:
void perf_output_sample(struct perf_output_handle *handle,
			struct perf_event_header *header,
			struct perf_sample_data *data,
			struct perf_event *event)
{
	u64 sample_type = data->type;

	perf_output_put(handle, *header); /* 写入数据 perf_event_header */


	if (sample_type & PERF_SAMPLE_IDENTIFIER)
		perf_output_put(handle, data->id);

	if (sample_type & PERF_SAMPLE_IP)
		perf_output_put(handle, data->ip);

	if (sample_type & PERF_SAMPLE_TID)
		perf_output_put(handle, data->tid_entry);

	if (sample_type & PERF_SAMPLE_TIME)
		perf_output_put(handle, data->time);

	...

	if (sample_type & PERF_SAMPLE_CPU)
		perf_output_put(handle, data->cpu_entry);

	if (sample_type & PERF_SAMPLE_PERIOD)
		perf_output_put(handle, data->period);

	...
}

/* 数据拷贝: handle->addr <= x */
#define perf_output_put(handle, x) perf_output_copy((handle), &(x), sizeof(x))
最后,perf_output_end() 将 ring_buffer 当前可读数据位置 ring_buffer::head 同步到用户空间,并唤醒数据读取等待进程:
void perf_output_end(struct perf_output_handle *handle)
{
	perf_output_put_handle(handle);
	rcu_read_unlock();
}

static void perf_output_put_handle(struct perf_output_handle *handle)
{
	struct ring_buffer *rb = handle->rb;
	unsigned long head;

again:
	head = local_read(&rb->head);

	/*
	 * IRQ/NMI can happen here, which means we can miss a head update.
	 */

	if (!local_dec_and_test(&rb->nest))
		goto out;

	/*
	 * Since the mmap() consumer (userspace) can run on a different CPU:
	 *
	 *   kernel				user
	 *
	 *   if (LOAD ->data_tail) {		LOAD ->data_head
	 *			(A)		smp_rmb()	(C)
	 *	STORE $data			LOAD $data
	 *	smp_wmb()	(B)		smp_mb()	(D)
	 *	STORE ->data_head		STORE ->data_tail
	 *   }
	 *
	 * Where A pairs with D, and B pairs with C.
	 *
	 * In our case (A) is a control dependency that separates the load of
	 * the ->data_tail and the stores of $data. In case ->data_tail
	 * indicates there is no room in the buffer to store $data we do not.
	 *
	 * D needs to be a full barrier since it separates the data READ
	 * from the tail WRITE.
	 *
	 * For B a WMB is sufficient since it separates two WRITEs, and for C
	 * an RMB is sufficient since it separates two READs.
	 *
	 * See perf_output_begin().
	 */
	smp_wmb(); /* B, matches C */
	rb->user_page->data_head = head; /* 更新 用户空间 可读数据位置 结尾 (head = rb->head)*/

	/*
	 * Now check if we missed an update -- rely on previous implied
	 * compiler barriers to force a re-read.
	 */
	if (unlikely(head != local_read(&rb->head))) {
		local_inc(&rb->nest);
		goto again;
	}

	if (handle->wakeup != local_read(&rb->wakeup))
		perf_output_wakeup(handle); /* 唤醒数据读取等待进程 */

out:
	preempt_enable();
}
1.4 读取事件数据
#define BUFFER_SIZE (1 << 18)  // 256KB
#define PAGE_SIZE 4096

size_t mmap_size = PAGE_SIZE + BUFFER_SIZE;
char *buffer = mmap(NULL, mmap_size, PROT_READ | PROT_WRITE, MAP_SHARED, fd, 0);

struct perf_event_mmap_page *header = buffer;
char *data_buffer = (char *)buffer + PAGE_SIZE;
unsigned long data_head = ACCESS_ONCE(header->data_head);
unsigned long data_tail = header->data_tail;

if (data_head != data_tail) { // 有新的数据可读
	while (data_tail < data_head) {
		size_t offset = data_tail % BUFFER_SIZE; // 计算当前记录位置(处理环形缓冲区回绕)
		struct perf_event_header *event_header =
                    (struct perf_event_header *)(data_buffer + offset);

		printf("事件头信息:\n");
		printf("  类型: %u\n", event_header->type);
		printf("  杂项: %u\n", event_header->misc);
		printf("  大小: %u bytes\n", event_header->size);

		switch (event_header->type) { // 处理不同类型的记录:这里只关注采样类型 (PERF_RECORD_SAMPLE)
		case PERF_RECORD_SAMPLE: {
			// 解析样本数据
			char *sample_data = (char *)(event_header + 1);

			// 根据 sample_type 解析数据
			u64 *sample_ptr = (u64 *)sample_data;
			int idx = 0;

			if (pe.sample_type & PERF_SAMPLE_IP)
				printf("指令指针: 0x%llx\n", sample_ptr[idx++]);

			if (pe.sample_type & PERF_SAMPLE_TID) {
				u32 pid = sample_ptr[idx] & 0xFFFFFFFF;
				u32 tid = sample_ptr[idx] >> 32;
				printf("PID/TID: %u/%u\n", pid, tid);
				idx++;
			}

			if (pe.sample_type & PERF_SAMPLE_TIME)
				printf("时间戳: %llu\n", sample_ptr[idx++]);

			if (pe.sample_type & PERF_SAMPLE_CPU) {
				u32 cpu = sample_ptr[idx] & 0xFFFFFFFF;
				u32 res = sample_ptr[idx] >> 32;
				printf("  CPU: %u (reserved: %u)\n", cpu, res);
				idx++;
			}

			if (pe.sample_type & PERF_SAMPLE_PERIOD)
				printf("采样周期: %llu\n", sample_ptr[idx++]);

			 break;
		 }
		 ...
		}

		// 移动到下一个记录
		data_tail += event_header->size;
	}

	// 更新数据尾部指针
	header->data_tail = data_tail;
}
1.5 采样数据格式小结
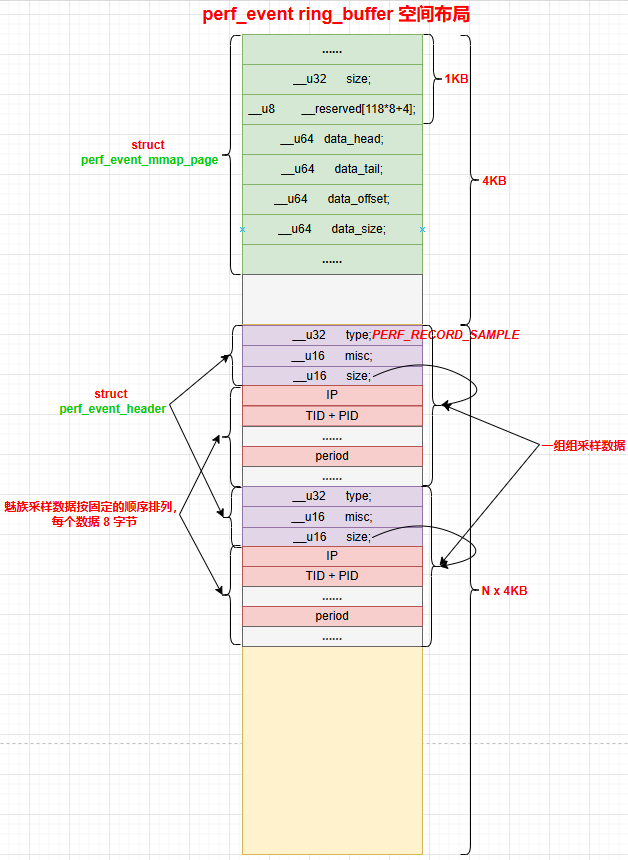
- mmap 映射的 ring_buffer 空间的第 1 个 page,存放
perf_event_mmap_page,后续 page 存放采样数据。 - 每组采样数据总是以一个 8 字节的
perf_event_header开头,标记采样数据的类型和 size,然后每个采样数据按 ID 决定排列顺序,每个数据大小为 8 字节。

 浙公网安备 33010602011771号