
ELK 日志采集 实战教程
概要
带着问题去看教程:
-
不是用logstash来监听我们的日志,我们可以使用logback配置来使用TCP appender通过TCP协议将日志发送到远程Logstash实例。
-
我们可以使用Logstash指向多个日志文件。
-
我们可以在logstash配置文件中使用更复杂的过滤器,以根据需要执行更多操作。
-
我们可以使用远程ELK集群指向我们的日志文件,或者将日志推入,这在将所有应用程序部署到云中时基本上是必需的。
-
在logstash中创建不同的索引模式。
通过使用微服务,我们已经能够克服许多遗留问题,并且它允许我们创建稳定的分布式应用程序,并对代码,团队规模,维护,发布周期,云计算等进行所需的控制。但它也引入了一些挑战。其他领域,例如分布式日志管理和查看在许多服务中分布的完整事务的日志和一般的分布式调试的能力。
实际上,挑战在于微服务是相互隔离的,它们不共享公共数据库和日志文件。随着微服务数量的增加以及我们使用自动化持续集成工具实现云部署,当我们遇到任何问题时,非常有必要对组件进行一些调试。
感谢开源运动。我们已经拥有了一系列工具,如果一起使用可以发挥魔力。一组如此受欢迎的工具是Elastic Search,Logstash和Kibana - 一起称为ELK Stack 。它们用于实时搜索,分析和可视化日志数据。
ELK Stack
-
Elasticsearch是一个基于JSON的分布式搜索和分析引擎,专为水平可扩展性,最高可靠性和易管理性而设计。
-
Logstash是一个动态数据收集管道,具有可扩展的插件生态系统和强大的Elasticsearch协同作用。
-
Kibana通过UI 提供数据可视化。
ELK Stack架构
Logstash根据我们设置的过滤条件处理应用程序日志文件,并将这些日志发送到Elasticsearch。通过Kibana,我们可以在需要时查看和分析这些日志。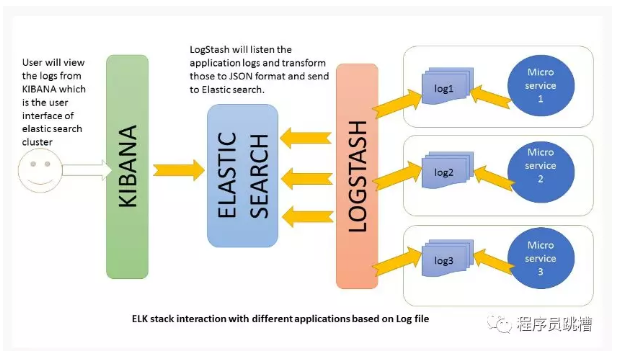
ELK配置
所有这三个工具都基于JVM,在开始安装之前,请验证JDK是否已正确配置。检查标准JDK 1.8安装,JAVA_HOME并且PATH已经完成设置。
Elasticsearch
-
从此下载页面下载最新版本的Elasticsearch 并将其解压缩到任何文件夹中。
-
bin\elasticsearch.bat从命令提示符运行。 -
默认情况下,它将从http:// localhost:9200
Kibana
-
从下载页面下载最新的发行版并解压缩到任何文件夹中。
-
config/kibana.yml在编辑器中打开并设置elasticsearch.url为指向您的Elasticsearch实例。在我们的例子中,我们将使用本地实例取消注释elasticsearch.url: "http://localhost:9200" -
bin\kibana.bat从命令提示符运行。 -
成功启动后,Kibana将启动默认端口
5601,Kibana UI将在http:// localhost:5601上提供
Logstash
-
从下载页面下载最新的发行版并解压缩到任何文件夹中。
-
logstash.conf根据配置说明创建一个文件。在实际演示时间内,我们将再次进行精确配置。现在运行
bin/logstash -f logstash.conf以启动logstash
ELK堆栈未启动并正在运行。现在我们需要创建一些微服务并指向API日志路径的logstash。
创建微服务
创建Spring Boot项目
让我们使用spring boot创建一个应用程序,以缩短开发时间。请按照这些步骤启动此服务。
添加REST端点
添加一个RestController类会暴露一些端点一样/elk,/elkdemo,/exception。实际上我们只会测试几个日志语句,因此可以根据您的选择随意添加/修改日志。
package com.example.howtodoinjava.elkexamplespringboot;import java.io.PrintWriter;import java.io.StringWriter;import java.util.Date;import org.apache.log4j.Level;import org.apache.log4j.Logger;import org.springframework.beans.factory.annotation.Autowired;import org.springframework.boot.SpringApplication;import org.springframework.boot.autoconfigure.SpringBootApplication;import org.springframework.context.annotation.Bean;import org.springframework.core.ParameterizedTypeReference;import org.springframework.http.HttpMethod;import org.springframework.web.bind.annotation.RequestMapping;import org.springframework.web.bind.annotation.RestController;import org.springframework.web.client.RestTemplate;@SpringBootApplicationpublic class ElkExampleSpringBootApplication { public static void main(String[] args) { SpringApplication.run(ElkExampleSpringBootApplication.class, args); }}@RestControllerclass ELKController { private static final Logger LOG = Logger.getLogger(ELKController.class.getName()); @Autowired RestTemplate restTemplete; @Bean RestTemplate restTemplate() { return new RestTemplate(); } @RequestMapping(value = "/elkdemo") public String helloWorld() { String response = "Hello user ! " + new Date(); LOG.log(Level.INFO, "/elkdemo - > " + response); return response; } @RequestMapping(value = "/elk") public String helloWorld1() { String response = restTemplete.exchange("http://localhost:8080/elkdemo", HttpMethod.GET, null, newParameterizedTypeReference() { }).getBody(); LOG.log(Level.INFO, "/elk - > " + response); try { String exceptionrsp = restTemplete.exchange("http://localhost:8080/exception", HttpMethod.GET, null,new ParameterizedTypeReference() { }).getBody(); LOG.log(Level.INFO, "/elk trying to print exception - > " + exceptionrsp); response = response + " === " + exceptionrsp; } catch (Exception e) { // exception should not reach here. Really bad practice :) } return response; } @RequestMapping(value = "/exception") public String exception() { String rsp = ""; try { int i = 1 / 0; // should get exception } catch (Exception e) { e.printStackTrace(); LOG.error(e); StringWriter sw = new StringWriter(); PrintWriter pw = new PrintWriter(sw); e.printStackTrace(pw); String sStackTrace = sw.toString(); // stack trace as a string LOG.error("Exception As String :: - > "+sStackTrace); rsp = sStackTrace; } return rsp; }} |
配置Spring引导记录
application.properties在resources文件夹下打开并添加以下配置条目。
logging.file=elk-example.logspring.application.name = elk-example |
验证微服务生成的日志
通过浏览http:// localhost:8080 / elk,mvn clean install使用命令java -jar target\elk-example-spring-boot-0.0.1-SNAPSHOT.jar和测试来执行最终的maven构建并启动应用程序。
不要害怕看到屏幕上的大堆栈跟踪,因为有意识地看看ELK如何处理异常消息。
转到应用程序根目录并验证是否elk-example.log已创建日志文件,并对端点执行几次访问,并验证日志文件中是否添加了日志。
Logstash配置
我们需要创建一个logstash配置文件,以便它监听日志文件并将日志消息推送到弹性搜索。以下是示例中使用的logstash 配置,请根据您的设置更改日志路径。
input { file { type => "java" path => "F:/Study/eclipse_workspace_mars/elk-example-spring-boot/elk-example.log" codec => multiline { pattern => "^%{YEAR}-%{MONTHNUM}-%{MONTHDAY} %{TIME}.*" negate => "true" what => "previous" } }}filter { #If log line contains tab character followed by 'at' then we will tag that entry as stacktrace if [message] =~ "\tat" { grok { match => ["message", "^(\tat)"] add_tag => ["stacktrace"] } } grok { match => [ "message", "(?<timestamp>%{YEAR}-%{MONTHNUM}-%{MONTHDAY} %{TIME}) %{LOGLEVEL:level} %{NUMBER:pid} --- \[(?<thread>[A-Za-z0-9-]+)\] [A-Za-z0-9.]*\.(?<class>[A-Za-z0-9#_]+)\s*:\s+(?<logmessage>.*)", "message", "(?<timestamp>%{YEAR}-%{MONTHNUM}-%{MONTHDAY} %{TIME}) %{LOGLEVEL:level} %{NUMBER:pid} --- .+? :\s+(?<logmessage>.*)" ] } date { match => [ "timestamp" , "yyyy-MM-dd HH:mm:ss.SSS" ] }}output { stdout { codec => rubydebug } # Sending properly parsed log events to elasticsearch elasticsearch { hosts => ["localhost:9200"] }} |
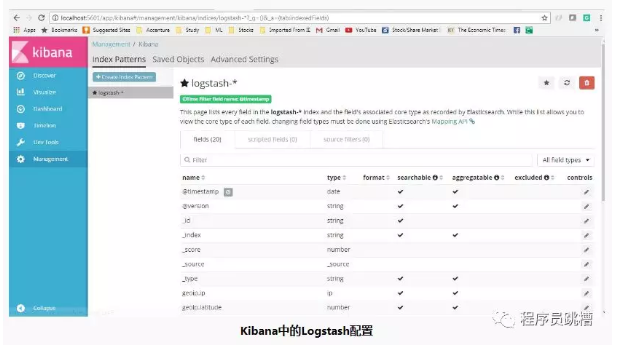
Kibana配置
在查看Kibana中的日志之前,我们需要配置索引模式。我们可以配置logstash-*为默认配置。我们总是可以在logstash端更改此索引模式并在Kibana中进行配置。为简单起见,我们将使用默认配置。
索引模式管理页面如下所示。通过这种配置,我们将Kibana指向您选择的Elasticsearch索引。Logstash使用名称模式创建索引。logstash-YYYY.MM.DD我们可以在Kibana控制台http:// localhost:5601 / app / kibana中执行所有这些配置,然后转到左侧面板中的Management链接。
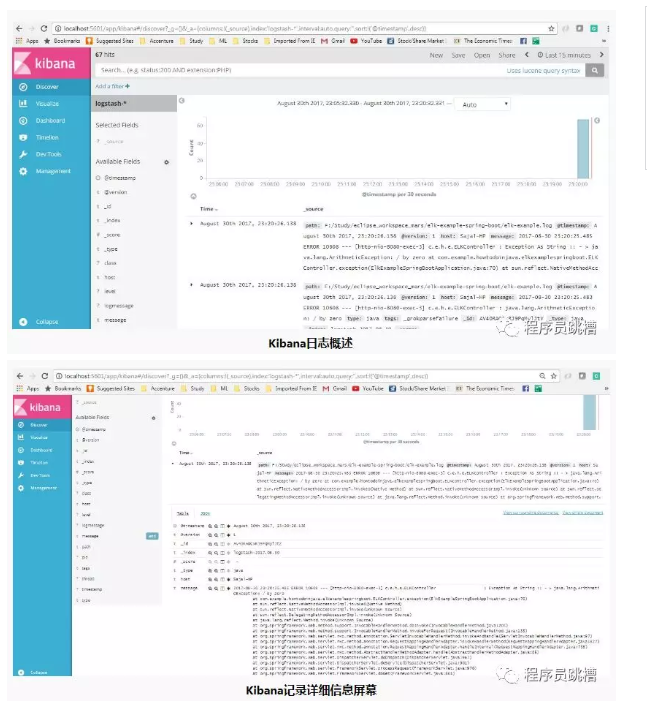
验证ELK
现在,当所有组件都启动并运行时,让我们验证整个生态系统。
转到应用程序并测试端点几次以便生成日志,然后转到Kibana控制台,看看日志是否正确堆叠在Kibana中,还有许多额外的功能,比如我们可以过滤,查看内置的不同图表等。
以下是Kibana中生成的日志的视图。
加微信:wonter 发送:技术Q
医疗微信群:
加微信:wonter 发送:医疗Q
更多文章关注公众号:


 浙公网安备 33010602011771号