


一:配置
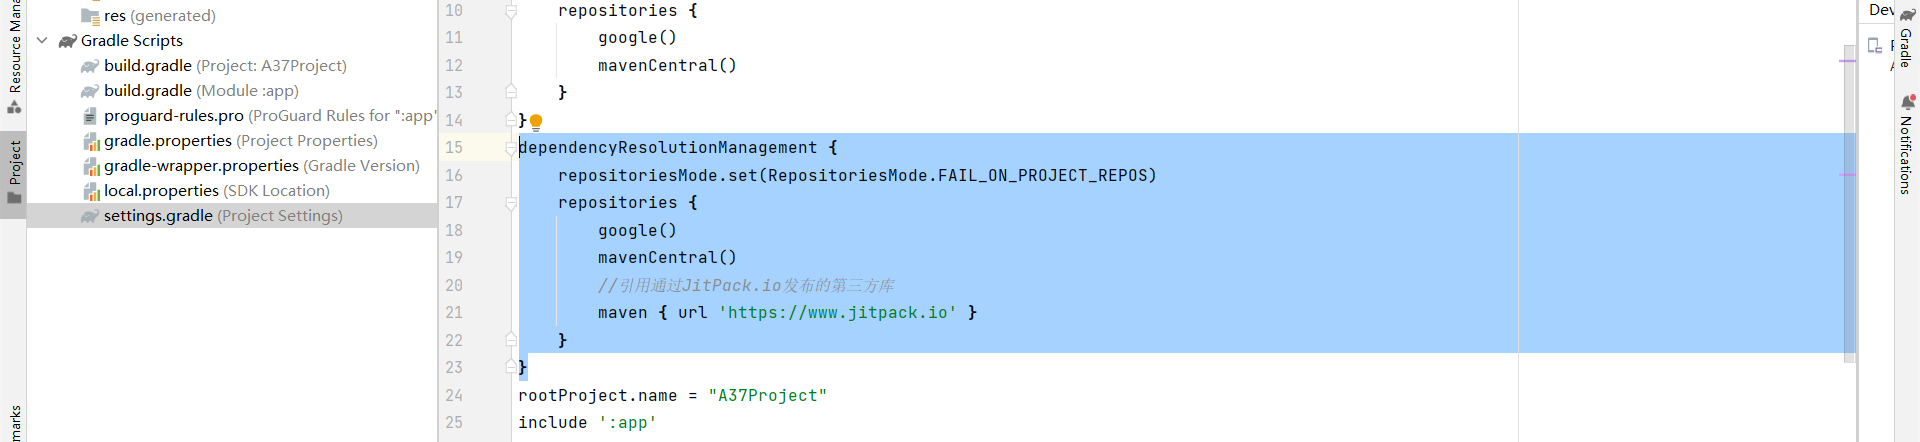
1.在settings.gradle上加入maven配置
dependencyResolutionManagement {
    repositoriesMode.set(RepositoriesMode.FAIL_ON_PROJECT_REPOS)
    repositories {
        google()
        mavenCentral()
        //引用通过JitPack.io发布的第三方库
        maven { url 'https://www.jitpack.io' }
    }
}
2.在bulid.gradle上加入代码,
implementation 'com.github.PhilJay:MPAndroidChart:v3.1.0'
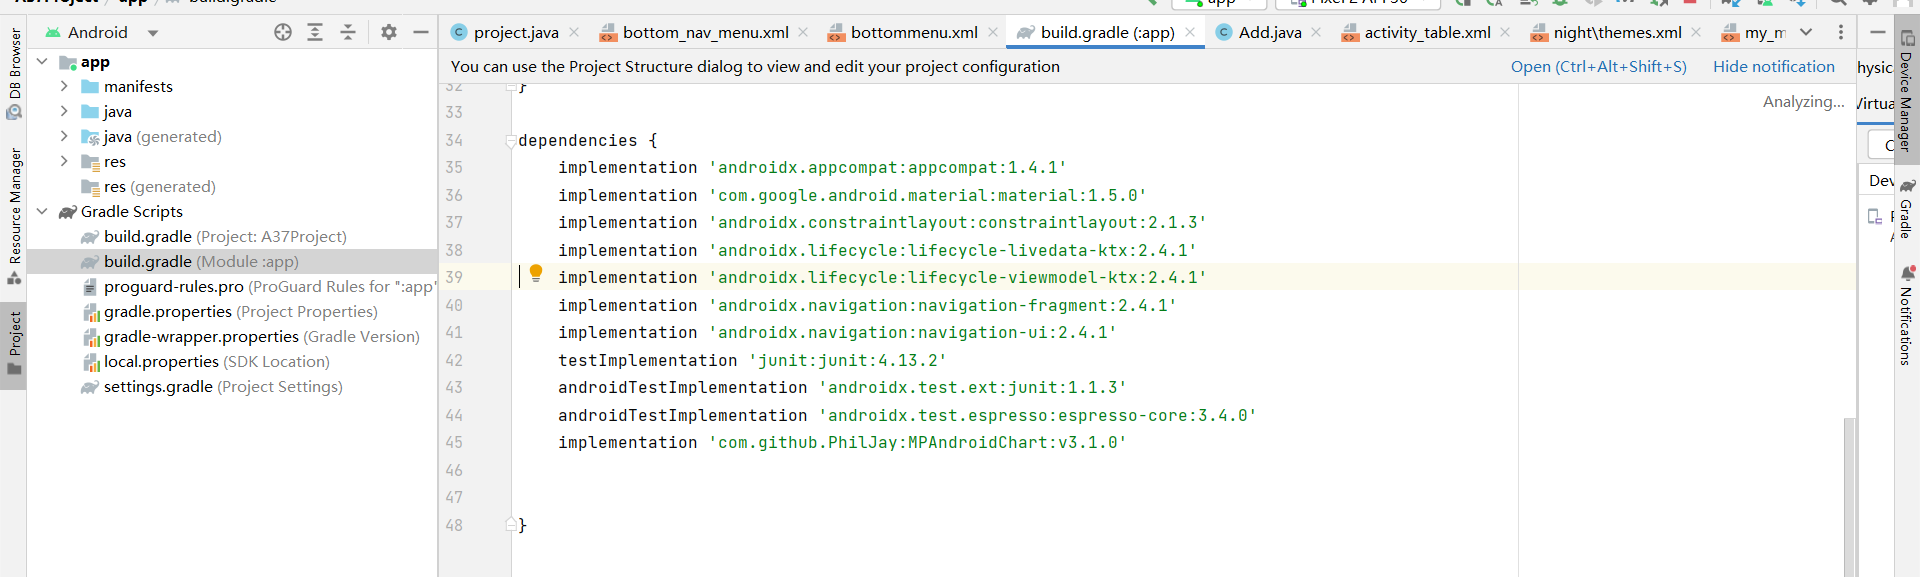
点击syno什么的进行加载,在右上角
二:模板(调用别人的代码进行实现)
类:PieChartUtil
public class PieChartUtil {

    public  final int[]  PIE_COLORS={
            Color.rgb(181, 194, 202), Color.rgb(129, 216, 200), Color.rgb(241, 214, 145),
            Color.rgb(108, 176, 223), Color.rgb(195, 221, 155), Color.rgb(251, 215, 191),
            Color.rgb(237, 189, 189), Color.rgb(172, 217, 243)
    };
    private static PieChartUtil pieChartUtil;
    private List<PieEntry> entries;

    public static  PieChartUtil getPitChart(){
        if( pieChartUtil==null){
            pieChartUtil=new PieChartUtil();
        }
        return  pieChartUtil;
    }


    public void setPieChart(PieChart pieChart, Map<String, Float> pieValues, String title, boolean showLegend) {
        pieChart.setUsePercentValues(true);//设置使用百分比(后续有详细介绍)
        pieChart.getDescription().setEnabled(false);//设置描述
        pieChart.setRotationEnabled(true);//是否可以旋转
        pieChart.setHighlightPerTapEnabled(true);//点击是否放大
        pieChart.setDrawCenterText(true);//设置绘制环中文字
        pieChart.setDrawEntryLabels(true);
        //这个方法为true就是环形图,为false就是饼图
        pieChart.setDrawHoleEnabled(true);//环形

        pieChart.setExtraOffsets(0, 0, 0, 0); //设置边距
        // 0表示摩擦最大,基本上一滑就停
        // 1表示没有摩擦,会自动转化为0.9999,及其顺滑
        pieChart.setDragDecelerationFrictionCoef(0.35f);//设置滑动时的摩擦系数(值越小摩擦系数越大)
        pieChart.setCenterText(title);//设置环中的文字
        pieChart.setCenterTextSize(15f);//设置环中文字的大小
        pieChart.setCenterTextColor(PIE_COLORS[2]);
        pieChart.setRotationAngle(120f);//设置旋转角度

        pieChart.setTransparentCircleRadius(61f);//设置半透明圆环的半径,看着就有一种立体的感觉
        //设置环形中间空白颜色是白色
        pieChart.setHoleColor(Color.TRANSPARENT);
        //设置半透明圆环的颜色
        pieChart.setTransparentCircleColor(Color.WHITE);
        //设置半透明圆环的透明度
        pieChart.setTransparentCircleAlpha(110);

        //图例设置
        Legend legend = pieChart.getLegend();
        if (showLegend) {
            legend.setEnabled(true);//是否显示图例
            legend.setHorizontalAlignment(Legend.LegendHorizontalAlignment.CENTER);//图例相对于图表横向的位置
            legend.setVerticalAlignment(Legend.LegendVerticalAlignment.TOP);//图例相对于图表纵向的位置
            legend.setOrientation(Legend.LegendOrientation.HORIZONTAL);//图例显示的方向
            legend.setDrawInside(false);
            legend.setDirection(Legend.LegendDirection.LEFT_TO_RIGHT);//方向
        } else {
            legend.setEnabled(false);
        }

        //设置饼图数据
        setPieChartData(pieChart, pieValues);


    }
    //设置饼图数据
    private void setPieChartData(PieChart pieChart, Map<String, Float> pieValues) {
        //遍历HashMap
        Set set = pieValues.entrySet();
        Iterator it = set.iterator();//得到适配器
        entries=new ArrayList<>();
        while (it.hasNext()) {
            Map.Entry entry = (Map.Entry) it.next();
            entries.add(new PieEntry(Float.valueOf(entry.getValue().toString()), entry.getKey().toString()));
        }

        PieDataSet dataSet = new PieDataSet(entries, "");
        dataSet.setSliceSpace(3f);//设置饼块之间的间隔
        dataSet.setSelectionShift(6f);//设置饼块选中时偏离饼图中心的距离
        dataSet.setColors(PIE_COLORS);//设置饼块的颜色
        dataSet.setValueTextSize(5f);
        //设置数据显示方式有见图
        dataSet.setValueLinePart1OffsetPercentage(80f);//数据连接线距图形片内部边界的距离,为百分数
        dataSet.setValueLinePart1Length(0.3f);
        dataSet.setValueLinePart2Length(0.4f);
        dataSet.setValueLineColor( PIE_COLORS[3]);//设置连接线的颜色
        dataSet.setYValuePosition(PieDataSet.ValuePosition.OUTSIDE_SLICE);//y轴数据显示在饼图内/外
        dataSet.setXValuePosition(PieDataSet.ValuePosition.OUTSIDE_SLICE);//x轴数据显示在饼图内/外

        PieData pieData = new PieData(dataSet);
        pieData.setValueFormatter(new PercentFormatter());
        pieData.setValueTextSize(11f);
        pieData.setValueTextColor(Color.DKGRAY);

        pieChart.setData(pieData);
        pieChart.highlightValues(null);
        pieChart.invalidate();
    }

}
MainActivity:
public class MainActivity extends AppCompatActivity {
    private PieChart pieChart;
    private HashMap dataMap;
    @Override
    protected void onCreate(Bundle savedInstanceState) {
        super.onCreate(savedInstanceState);
        setContentView(R.layout.activity_main);
        dataMap=new HashMap();
        dataMap.put("Ⅰ类水","8");
        dataMap.put("Ⅱ类水","12");
        dataMap.put("Ⅲ类水","31");
        dataMap.put("Ⅳ类水","24");
        dataMap.put("Ⅴ类水","10");
        dataMap.put("劣Ⅴ类水","15");
        pieChart=(PieChart)findViewById(R.id.pie_chart);
        PieChartUtil.getPitChart().setPieChart(pieChart,dataMap,"水质",true);

        //点击事件
        pieChart.setOnChartValueSelectedListener(new OnChartValueSelectedListener() {
            @Override
            public void onValueSelected(Entry e, Highlight h) {
                PieEntry pieEntry=(PieEntry)e;
                pieChart.setCenterText(pieEntry.getLabel());
            }

            @Override
            public void onNothingSelected() {

            }
        });

    }
}
xml布局:
<?xml version="1.0" encoding="utf-8"?>
<LinearLayout xmlns:android="http://schemas.android.com/apk/res/android"
    xmlns:app="http://schemas.android.com/apk/res-auto"
    xmlns:tools="http://schemas.android.com/tools"
    android:layout_width="match_parent"
    android:layout_height="match_parent"
    android:gravity="center"
    tools:context=".MainActivity">

    <com.github.mikephil.charting.charts.PieChart
        android:id="@+id/pie_chart"
        android:padding="20dp"
        android:layout_width="match_parent"
        android:layout_height="300dp"/>
</LinearLayout>
这个模板的好处是不要数据库的内容,可以进行直接调用,然后注释齐全,可以自己定义
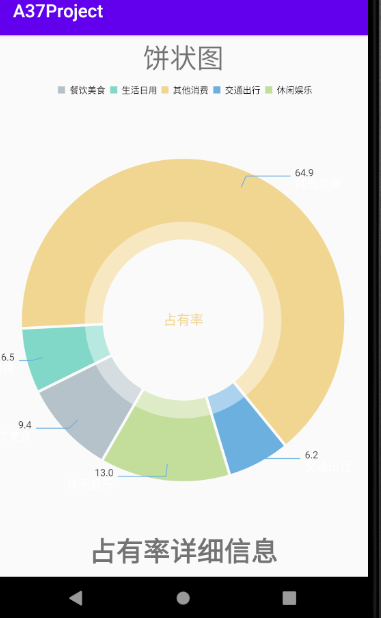
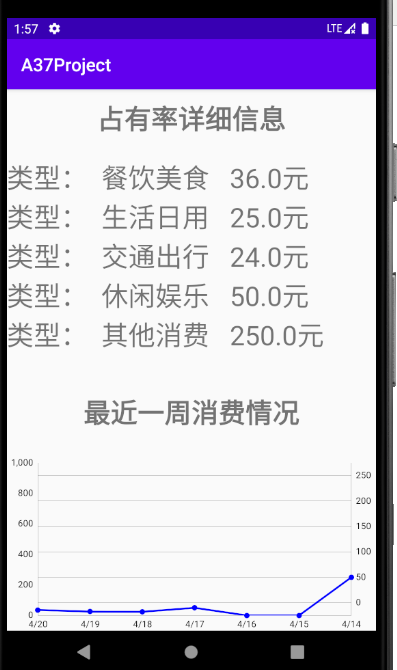
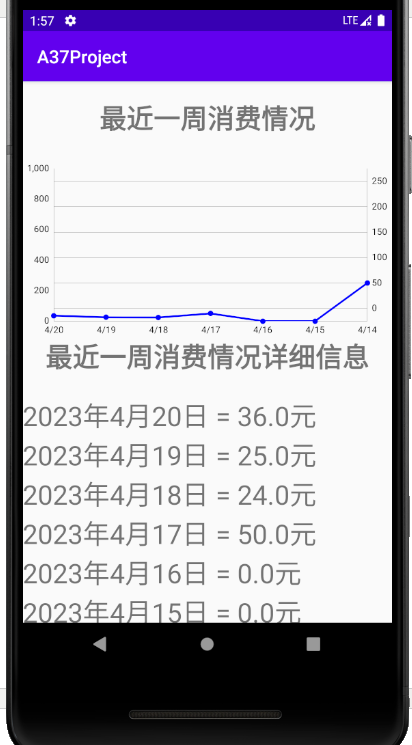
三:我的饼状图
这里包含了数据库,折线图等等的实现
public class Table extends AppCompatActivity {
    private PieChart pieChart;
    //折线图
    private LineChart mChart;
    private HashMap dataMap;
    private int icount;
    private int sum;
   private String ArrayType[] = new String[]{"餐饮美食","生活日用","交通出行","休闲娱乐","医疗保健","投资理财","其他消费"};
   private float MoneyType[] = new float[]{0,0,0,0,0,0,0};
   private TextView textView;
   //数据库命名
   private project helper;
   private SQLiteDatabase sqLiteDatabase;
    @SuppressLint("MissingInflatedId")
    @Override
    protected void onCreate(Bundle savedInstanceState) {
        super.onCreate(savedInstanceState);
        setContentView(R.layout.activity_table);
        pieChart = findViewById(R.id.pie_ch);
        //条状图初始化控件
        mChart = findViewById(R.id.line_chart);

        //
        textView = findViewById(R.id.Datashow);
        initDate();
        //设置数据
        Setdata();
        dataMap=new HashMap();
        for (int i = 0;i < 7;i++)
        {    if(MoneyType[i]!= 0)
            dataMap.put(ArrayType[i],MoneyType[i]/sum);
        }

        PieChartUtil.getPitChart().setPieChart(pieChart,dataMap,"占有率",true);

        //点击事件
        pieChart.setOnChartValueSelectedListener(new OnChartValueSelectedListener() {
            @Override
            public void onValueSelected(Entry e, Highlight h) {
                PieEntry pieEntry=(PieEntry)e;
                pieChart.setCenterText(pieEntry.getLabel());
            }

            @Override
            public void onNothingSelected() {

            }
        });
        mChart.setTouchEnabled(false);
        mChart.setDragEnabled(false);
        mChart.setScaleEnabled(false);
        mChart.setPinchZoom(false);
        mChart.setDrawGridBackground(false);
        mChart.getDescription().setEnabled(false);

        Legend legend = mChart.getLegend();
        legend.setEnabled(false);

        XAxis xAxis = mChart.getXAxis();
        xAxis.setPosition(XAxis.XAxisPosition.BOTTOM);
        xAxis.setDrawGridLines(false);
        xAxis.setGranularity(1f);
        xAxis.setAxisMinimum(0f);
        xAxis.setAxisMaximum(6f);
        final String[] labels = new String[7];
        for (int i = 0; i <7; i++) {
            labels[i] = getPastDate(i);
        }
        xAxis.setValueFormatter(new IndexAxisValueFormatter(labels));

        YAxis yAxis = mChart.getAxisLeft();
        yAxis.setDrawGridLines(false);
        yAxis.setGranularity(1f);
        yAxis.setAxisMinimum(0);
        yAxis.setAxisMaximum(1000);
        //插入数据
        Calendar calendar = Calendar.getInstance();
        String nowyear = String.valueOf(calendar.get(Calendar.YEAR));
        // 获取当前月
        String nowmonth = String.valueOf(calendar.get(Calendar.MONTH) + 1);
        // 获取当前日
        String nowday = String.valueOf(calendar.get(Calendar.DATE));
        //时间
        //
        int nowdayInt = Integer.parseInt(nowday);
        int day7 = nowdayInt;
        int day6 = nowdayInt - 1;
        int day5 = nowdayInt - 2;
        int day4 = nowdayInt - 3;
        int day3 = nowdayInt - 4;
        int day2 = nowdayInt - 5;
        int day1 = nowdayInt - 6;
        //
        float OneMoneySum[] = new float[]{0,0,0,0,0,0,0};
        String [] Week = new String[7];
        Week[0] = nowyear + "年" + nowmonth + "月" + day7 + "日";
        Week[1] = nowyear + "年" + nowmonth + "月" + day6 + "日";
        Week[2] = nowyear + "年" + nowmonth + "月" + day5 + "日";
        Week[3] = nowyear + "年" + nowmonth + "月" + day4 + "日";
        Week[4] = nowyear + "年" + nowmonth + "月" + day3 + "日";
        Week[5] = nowyear + "年" + nowmonth + "月" + day2 + "日";
        Week[6] = nowyear + "年" + nowmonth + "月" + day1 + "日";

        //调用数据库
        helper = new project(Table.this);
        sqLiteDatabase = helper.getReadableDatabase();
        for(int i =0 ;i < 7 ;i ++)
        {
            OneMoneySum[i]= helper.CheckMoneyByday(sqLiteDatabase,Week[i]);
        }
        for (int i = 0; i < 7 ;i ++)
        {
            System.out.println(Week[i] + MoneyType[i]);
        }
        ArrayList<Entry> values = new ArrayList<>();
        values.add(new Entry(0, MoneyType[0]));
        values.add(new Entry(1, MoneyType[1]));
        values.add(new Entry(2, MoneyType[2]));
        values.add(new Entry(3, MoneyType[3]));
        values.add(new Entry(4, MoneyType[4]));
        values.add(new Entry(5, MoneyType[5]));
        values.add(new Entry(6, MoneyType[6]));
//        for (int i = 0;i < 7;i++)
//        {
//            values.add(new Entry(i, 500));
//        };
        //显示具体数据
        TextView Money_textView = findViewById(R.id.WeekMoney);
        String ZXData = "";
        for (int i =0;i < 7; i++ )
        {
            ZXData += Week[i] + " = " + MoneyType[i]+"元\n";
            System.out.println(Week[i] + " = " + MoneyType[i]+"元");
        }
        System.out.println("ZXData = " + ZXData);
        Money_textView.setText(ZXData);


        //结束
        LineDataSet dataSet = new LineDataSet(values, "");
        dataSet.setLineWidth(2f);
        dataSet.setColor(Color.BLUE);
        dataSet.setCircleColor(Color.BLUE);
        dataSet.setDrawCircleHole(false);
        dataSet.setDrawValues(false);

        ArrayList<ILineDataSet> dataSets = new ArrayList<>();
        dataSets.add(dataSet);

        LineData data = new LineData(dataSets);
        mChart.setData(data);
        mChart.invalidate();
      }

    private void Setdata()
    {
        int sizeCount = 0;
        String data = "";
        for (int i = 0;i < 7;i++)
        {
            if(MoneyType[i]!= 0)
            {
            data  += "类型:  "+ArrayType[i] + "   " + MoneyType[i] +"元\n";
            sizeCount++;
            }

        }
        final ViewGroup.LayoutParams lp = textView.getLayoutParams();
        lp.height= (int) (sizeCount * 130);//lp.height=LayoutParams.WRAP_CONTENT;
        textView.setLayoutParams(lp);
        textView.setText(data);
    }

    private void initDate()
    {
        helper = new project(Table.this);
        sqLiteDatabase = helper.getReadableDatabase();
        List<Consume> consumes = helper.FindAll(sqLiteDatabase);
        icount = 0;
        for ( Consume item: consumes)
        {
            System.out.println("type = " + item.getComsumer_type());
            System.out.println("money = " + item.getComsumer_type());
            icount++;
        }
        System.out.println("icount = "+ icount);
        int count = 0;
        String [] type = new String[icount];
        float [] money=new float[icount];
        for ( Consume item: consumes)
        {
            type[count] = item.getComsumer_type();
            //System.out.println("type1 = " + item.getComsumer_type());
            money[count] = item.getComsumer_money();
            //System.out.println("money1 = " + item.getComsumer_type());
            count++;
        }
        for (int i =0;i < 7; i++ )
        {
          for(int j = 0 ; j < icount ;j++)
          {
             if(ArrayType[i].equals(type[j]))
             {
                 MoneyType[i] += money[j];
             }
          }
        }
        for (int i =0;i < 7; i++ )
        {
            System.out.println(ArrayType[i] + " = " + MoneyType[i] );
            sum +=MoneyType[i];
        }

    }
    private String getPastDate(int daysAgo)
    {
        DateFormat dateFormat = new SimpleDateFormat("M/d", Locale.ENGLISH);
        Calendar calendar = Calendar.getInstance();
        calendar.add(Calendar.DAY_OF_YEAR, -daysAgo);
        Date date = calendar.getTime();
        return dateFormat.format(date);
    }
    }
四:参考博客:
以下是我筛选参考的博客:包括折线图
https://www.jianshu.com/p/ccf19e292ee7
https://blog.csdn.net/qq_33235287/article/details/104812758
https://blog.csdn.net/hanweipeng1010/article/details/44217467
https://blog.csdn.net/le9406/article/details/103390472

 浙公网安备 33010602011771号