
1.Lab-2 system calls
Lab: system calls
1.Using gdb (easy)
打开两个shell,都进入xv6文件夹
第一个shell输入
make qemu-gdb
第二个shell输入
riscv64-unknown-elf-gdb
-
Looking at the backtrace output, which function called
syscall?(gdb) backtrace #0 syscall () at kernel/syscall.c:138 #1 0x0000000080001d74 in usertrap () at kernel/trap.c:67 #2 0x0505050505050505 in ?? ()所在的函数是
kernel/trap.c --> usertrap() -
What is the value of
p->trapframe->a7and what does that value represent? (Hint: lookuser/initcode.S, the first user program xv6 starts.)(gdb) p /x p->trapframe->a7 $3 = 0x7xv6使用a7寄存器存储系统调用编号,查看
kernel/syscall.h#define SYS_exec 77号系统调用是SYS_exec
-
What was the previous mode that the CPU was in?
(gdb) p /x $sstatus
$4 = 0x200000022
查看riscv-privileged.pdf 文档
sstatus的SPP位,即Supervisor Previous Privilege,指示在进入监督者模式之前的机器模式
SPP在第8位,
0x200000022从右往左第8位为0,根据文档,0代表用户模式所以是用户模式
-
Write down the assembly instruction the kernel is panicing at. Which register corresponds to the variable
num?运行xv6,出错信息如下
make qemu
qemu-system-riscv64 -machine virt -bios none -kernel kernel/kernel -m 128M -smp 3 -nographic -global virtio-mmio.force-legacy=false -drive file=fs.img,if=none,format=raw,id=x0 -device virtio-blk-device,drive=x0,bus=virtio-mmio-bus.0

xv6 kernel is booting

hart 2 starting
hart 1 starting
scause 0x000000000000000d
sepc=0x0000000080002054 stval=0x0000000000000000
panic: kerneltrap
QEMU: Terminated
80002054对应的汇编代码是
num = *(int *)0;
	80002054:	00002683          	lw	a3,0(zero) # 0 <_entry-0x80000000>
num对应的寄存器是
a3 -
Why does the kernel crash? Hint: look at figure 3-3 in the text; is address 0 mapped in the kernel address space? Is that confirmed by the value in
scauseabove? (See description ofscausein RISC-V privileged instructions)-
运行gdb,打断点到
0x0000000080002054b *0x0000000080002054 -
scause的值是:13,访问的目标地址是0
-
查看xv6 book的内存分布图
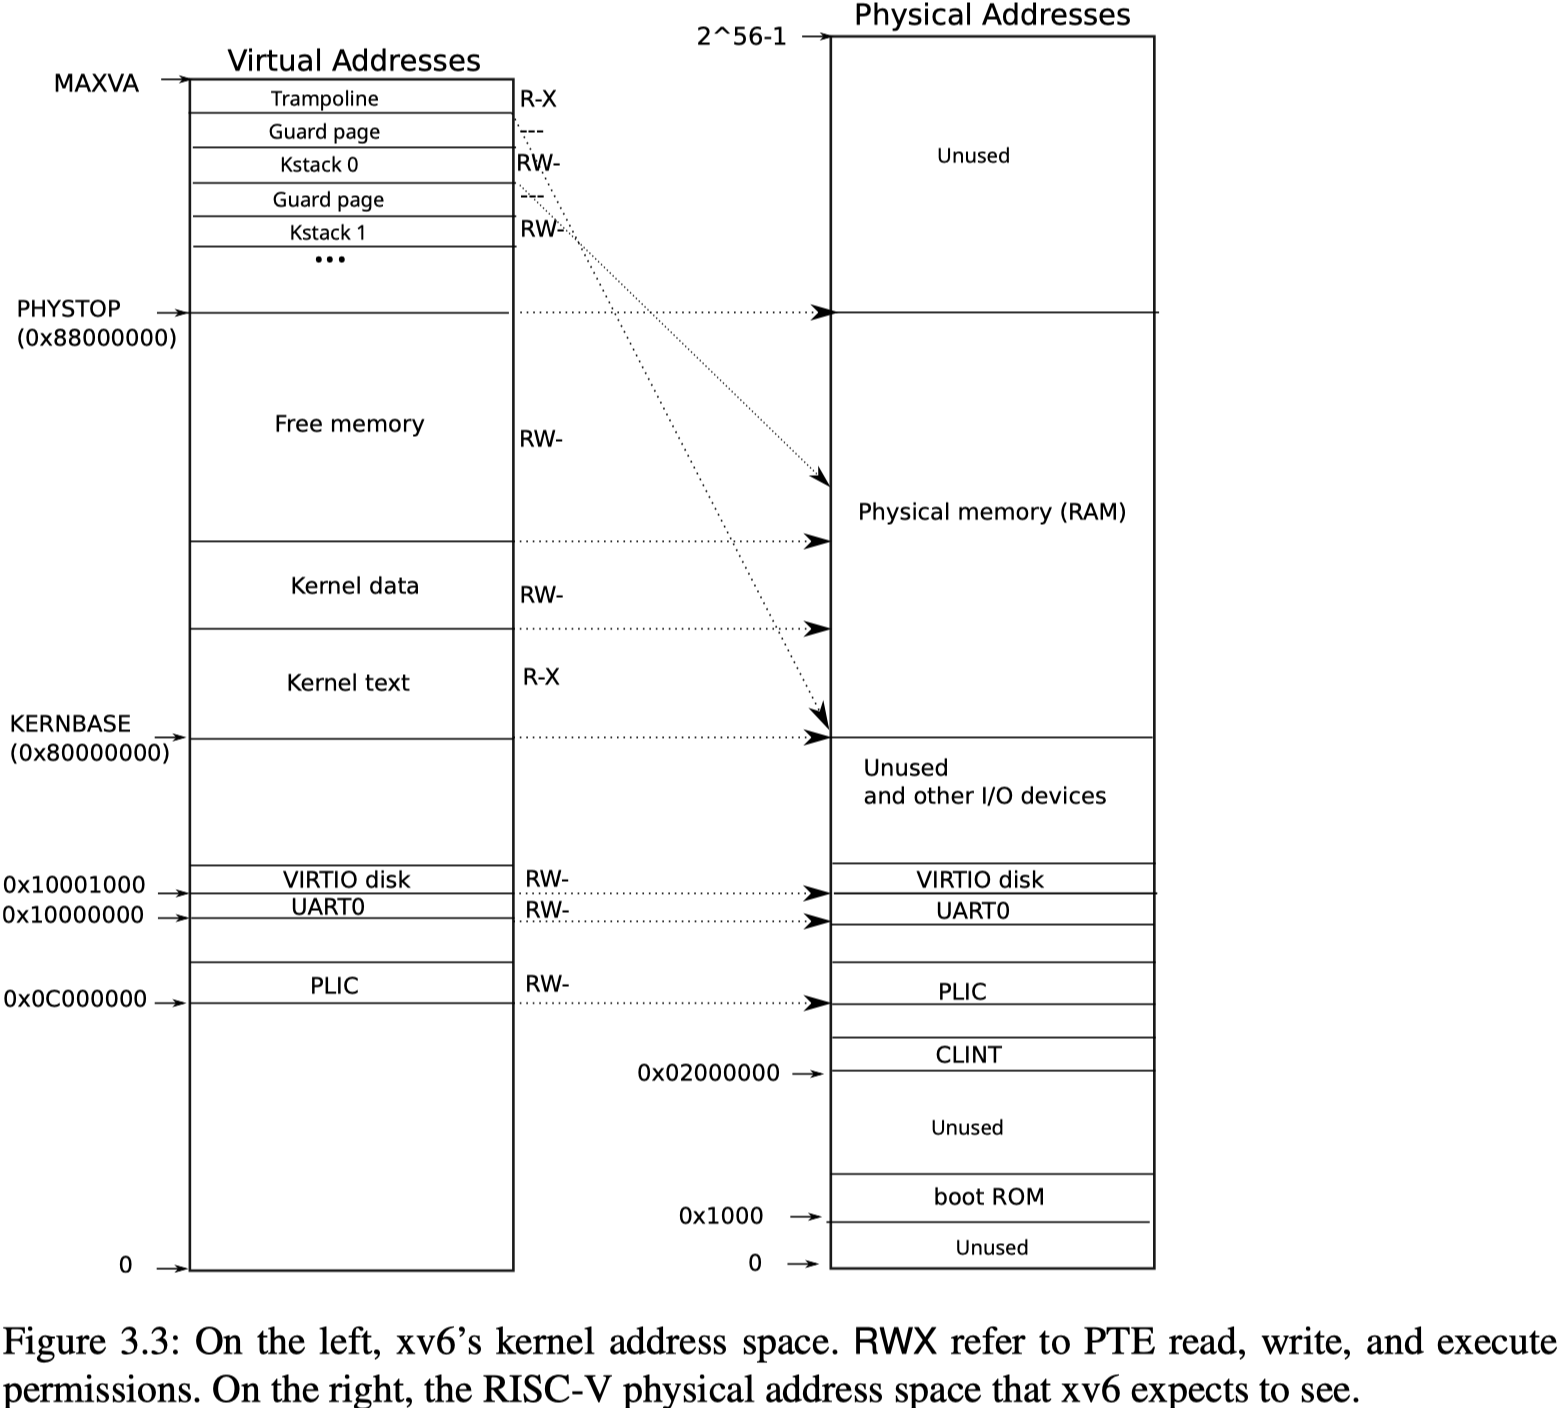
0对应的是Unused的地址,不是内核地址
查看RISC-V privileged instructions文档,图4.2,scause等于13时,对应的错误是
Load page fault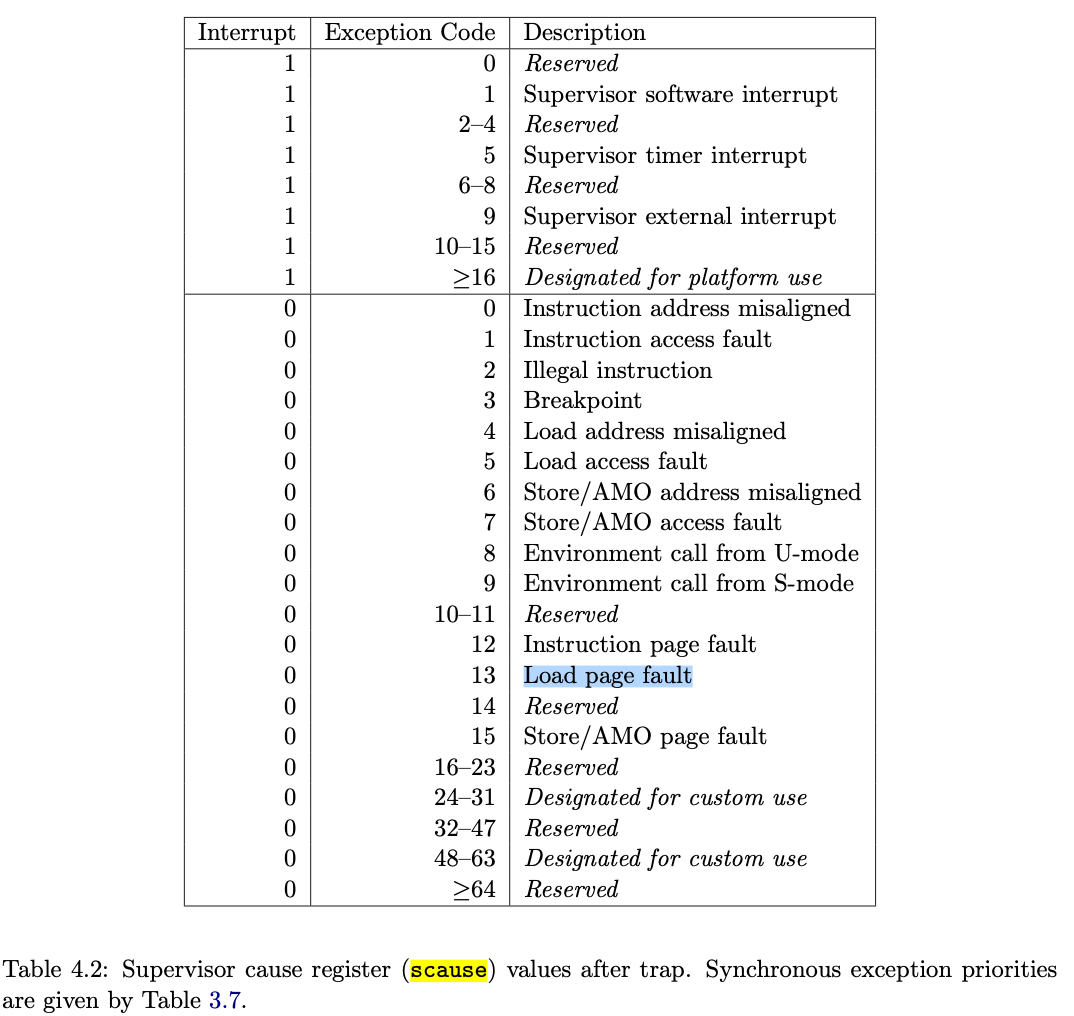
-
-
What is the name of the binary that was running when the kernel paniced? What is its process id (
pid)?出错时,运行的是
kernel/syscall.c文件,编译在kernel二进制文件中(gdb) p p->pid $2 = 1pid是1
2.System call tracing (moderate)
代码:github
-
添加
trace到Makefile的UPROGS -
添加
trace函数定义到user/user.h -
添加
trace到user/usys.pl -
添加
SYS_trace到kernel/syscall.h#define SYS_trace 22 -
添加
trace_mask到kernel/proc.h的struct proc中,记录当前线程的trace_mask -
修改
kernel/syscall.c,使的SYS_trace和trace函数能连接到添加一个函数调用到系统调用名的映射
syscall_names,用于获取系统调用名 -
修改
kernel/proc.c/fork函数,将trace_mask复制给子进程
3.Sysinfo (moderate)
代码:github

 浙公网安备 33010602011771号