数据分析day01——matplotlib绘制折线图
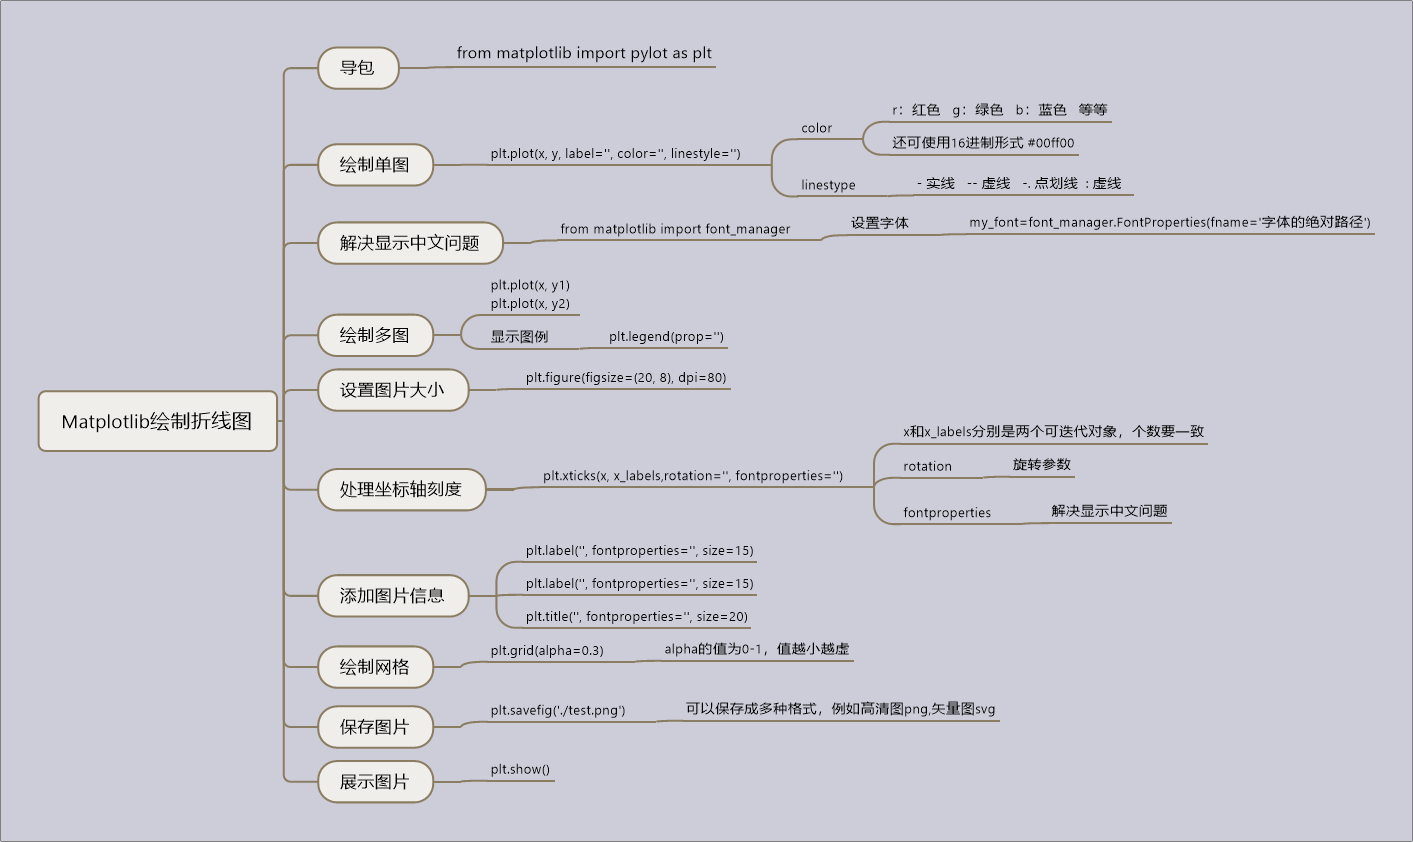
今天学习了使用matplotlib绘制简单的折线图,思维导图如下:
代码如下:


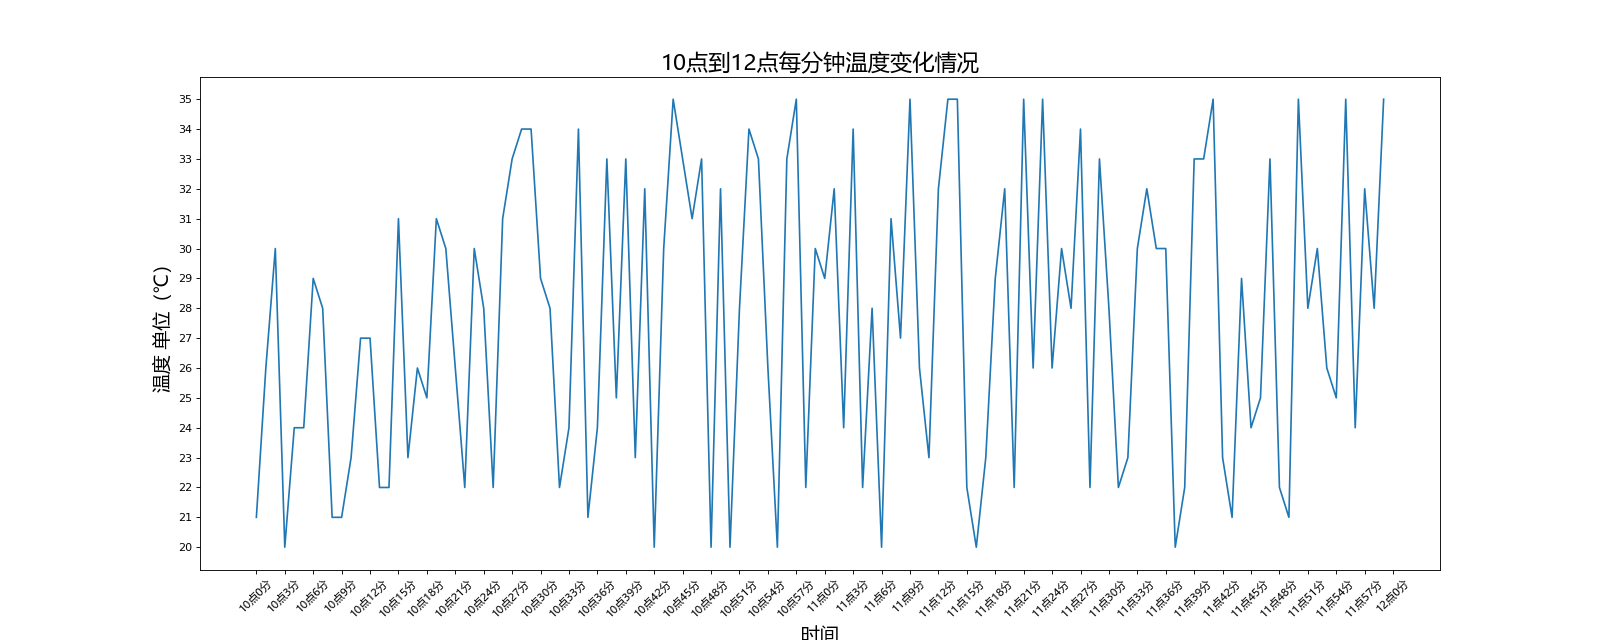
 1 # Author:K
 2 """
 3     绘制10点到12点每分钟温度变化情况
 4 """
 5
 6 from matplotlib import pyplot as plt
 7 import random
 8 from matplotlib import font_manager
 9
10 # 设置字体
11 my_font = font_manager.FontProperties(fname=r'C:\Windows\Fonts\msyh.ttc')
12
13 a = [random.randint(20, 35) for i in range(120)]
14 x = range(120)
15 # 设置长宽,DPI
16 plt.figure(figsize=(20, 8), dpi=80)
17
18 # 设置x,y轴刻度
19 x_labels = ['10点%s分' % x for x in range(60)]
20 x_labels += ['11点%s分' % x for x in range(60)]
21 x_labels += ['12点0分']
22
23 x_labels = x_labels[::3]  # x_labels有41个
24 _x = list(range(121))[::3]  # 为了显示12点0分,所以range里面写121,正好41个
25 plt.xticks(_x, x_labels, rotation=45, fontproperties=my_font)
26 plt.yticks(range(20, 36))
27
28 # 添加描述信息
29 plt.xlabel('时间', fontproperties=my_font, size=17)
30 plt.ylabel('温度 单位(℃)', fontproperties=my_font, size=17)
31 plt.title('10点到12点每分钟温度变化情况', fontproperties=my_font, size=20)
32
33 # 绘图
34 plt.plot(x, a)
35
36
37 # 保存图片
38 plt.savefig('./weather.png')
39 plt.show()
运行结果如下:
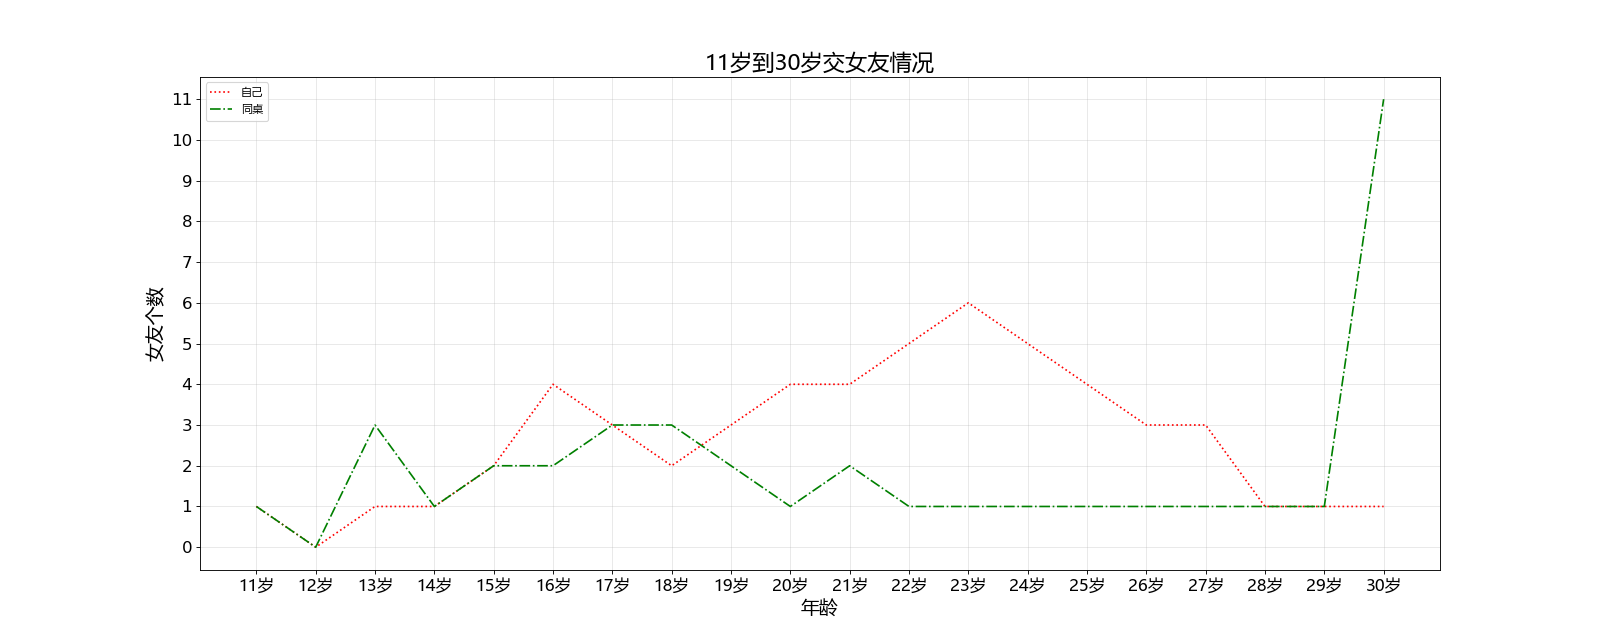
 1 # Author:K
 2 """
 3     统计11岁到30岁交女友情况
 4 """
 5
 6 from matplotlib import pyplot as plt
 7 from matplotlib import font_manager
 8
 9 # 设置字体
10 my_font = font_manager.FontProperties(fname=r'C:\Windows\Fonts\msyh.ttc')
11
12 y1 = [1, 0, 1, 1, 2, 4, 3, 2, 3, 4, 4, 5, 6, 5, 4, 3, 3, 1, 1, 1]
13 y2 = [1, 0, 3, 1, 2, 2, 3, 3, 2, 1, 2, 1, 1, 1, 1, 1, 1, 1, 1, 11]
14 x = range(11, 31)
15
16 # 设置图片大小,DPI
17 plt.figure(figsize=(20, 8), dpi=80)
18
19 # 绘图
20 plt.plot(x, y1, label='自己', color='r', linestyle=':')
21 plt.plot(x, y2, label='同桌', color='g', linestyle='-.')
22
23 # 设置x,y轴刻度
24 plt.xticks(x, ['%s岁' % s for s in x], fontproperties=my_font, size=15)
25 plt.yticks(range(min(min(y1), min(y2)), max(max(y1), max(y2))+1), size=15)
26
27 # 添加图片信息
28 plt.xlabel('年龄', fontproperties=my_font, size=17)
29 plt.ylabel('女友个数', fontproperties=my_font, size=17)
30 plt.title('11岁到30岁交女友情况', fontproperties=my_font, size=20)
31
32 # 显示图例
33 plt.legend(prop=my_font)
34
35 # 绘制网格alpha参数为透明度,1为最大值,是实线
36 plt.grid(alpha=0.3)
37
38 # 保存图片
39 plt.savefig('./gf.png')
40
41 # 显示图片
42 plt.show()
运行结果如下:

 浙公网安备 33010602011771号