20个linux命令行工具监视性能(下)
昨天晚上第一次翻译了《20 Command Line Tools to Monitor Linux Performance》中的前十个命令,翻译得不是很好,今天晚上继续把后面的十个也翻译给大家吧,第一次写博客,写的不是特别的好,希望大家不要介意,也希望大家觉得有什么不对的地方能够多多指教,毕竟小弟还是初学者。下面我们开始学习下面十个命令吧!

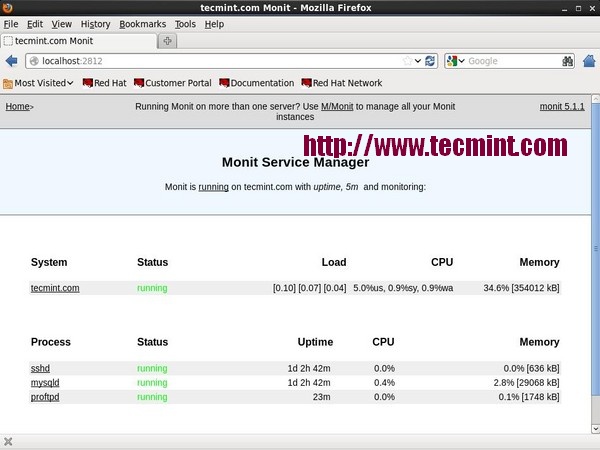
11,Monit –- Linux Process and Services Monitoring
Monit 是一个免费开源并且基于web的进程监督实用程序,自动监控和管理系统进程,应用程序,文件,目录,权限,校验和和文件系统。
它监视的服务有 Apache, MySQL, Mail, FTP, ProFTP, Nginx, SSH 等等。系统状态能被浏览通过命令行或者使用Monit 自己的用户界面。
想要了解Monit的更多的命令请参考Linux Process Monitoring with Monit 。
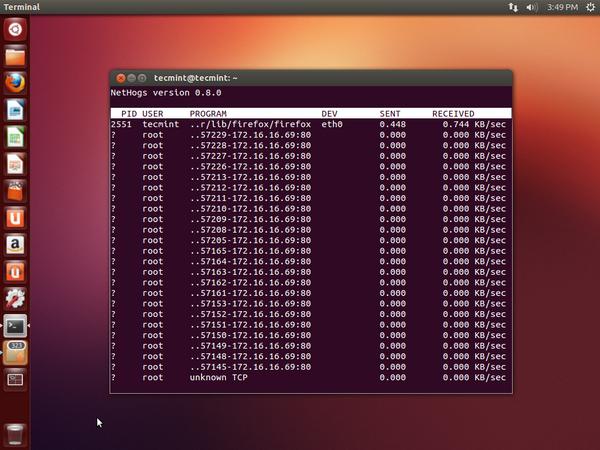
12,NetHogs –- Monitor Per Process Network Bandwidth
NetHogs is 是一个类似于top命令的开源的更好的更小的程序,它能够监视系统上的任何一个活动网络进程。它也能够记录实时网络流量带宽使用的每个程序或应用程序。
想要了解该命令的更多用法请参考Monitor Linux Network Bandwidth Using NetHogs 。
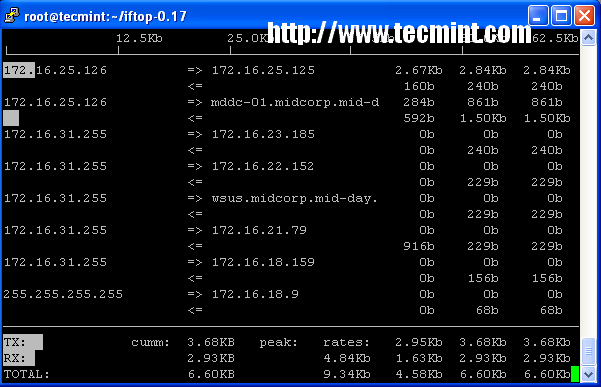
13,iftop -- Network Bandwidth Monitoring
iftop 是另一个基于终端的免费开源的系统监控实用工具。它通过系统连接的网络接口来显示频繁更新的网络(源主机到目的主机)带宽利用率。 iftop 被用作监视网络使用率,而‘top‘则被用来监视cpu的使用率。 iftop工具被用来监视被选择的网络接口并且显示两个主机之间的网络带宽使用情况。具体用法如下
该命令的更多使用方法请参考iftop – Monitor Network Bandwidth Utilization 。
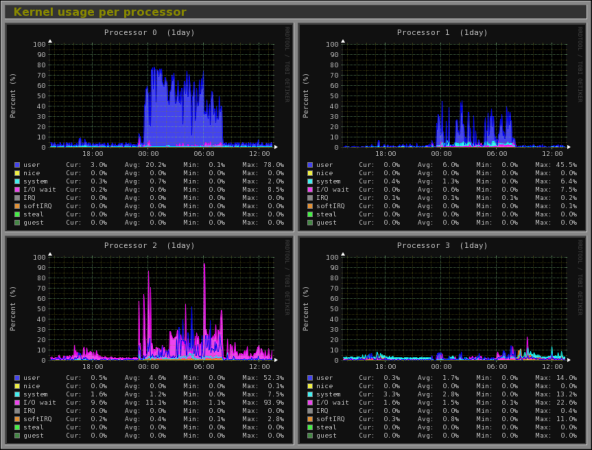
14,Monitorix -- System and Network Monitoring
Monitorix is 是一个免费的轻量级的实用工具,它主要被设计用来运行和监视系统和网络资源尽可能多的运用在Linux/Unix服务器上。它有一个内置的web服务器能够定期的收集系统和网络的信息并且通过图像显示它们。 它监视 system load average and usage, memory allocation(内存分配), disk driver health(磁盘驱动的健康状态), system services(系统服务), network ports(网络端口), mail statistics (Sendmail, Postfix, Dovecot, etc)邮件统计, MySQL statistics (mysql统计)等等. 它旨在监控系统整体性能和有助于检测失败,瓶颈,异常活动等.
了解该命令的更多使用方法请参考:Monitorix a System and Network Monitoring Tool for Linux 。
15,Arpwatch -- Ethernet Activity Monitor
Arpwatch is 是一种被设计用来监视以太网的地址解析(MAC and IP address changes)的程序。 它持续保持监视以太网流量和产生一个IP和MAC地址对变化的以及网络上的时间戳的日志。当有一个地址对发生变化时它通过发送一个电子邮件界面告示管理员。它是非常的有用对于检查网络中ARP 攻击。
# arpwatch -i eth0
# tail -f /var/log/messageseth0
Apr 15 12:45:17 tecmint arpwatch: new station 172.16.16.64 d0:67:e5:c:9:67
Apr 15 12:45:19 tecmint arpwatch: new station 172.16.25.86 0:d0:b7:23:72:45
Apr 15 12:45:19 tecmint arpwatch: new station 172.16.25.86 0:d0:b7:23:72:45
Apr 15 12:45:19 tecmint arpwatch: new station 172.16.25.86 0:d0:b7:23:72:45
Apr 15 12:45:19 tecmint arpwatch: new station 172.16.25.86 0:d0:b7:23:72:45
想要了解更多该命令的使用方法请参考:Arpwatch to Monitor Ethernet Activity
16,Suricata --Network Security Monitoring
Suricata 是一个高性能的开源网络安全和入侵检测和预防监测系统, FreeBSD 和 Windows.它由一个非盈利基金会OISF设计和使用。
# suricata -c /etc/suricata/suricata.yaml -i eth0
23/7/2013 -- 12:22:45 -  - This is Suricata version 1.4.4 RELEASE
23/7/2013 -- 12:22:45 -  - CPUs/cores online: 2
23/7/2013 -- 12:22:45 -  - Found an MTU of 1500 for 'eth0'
23/7/2013 -- 12:22:45 -  - allocated 2097152 bytes of memory for the defrag hash... 65536 buckets of size 32
23/7/2013 -- 12:22:45 -  - preallocated 65535 defrag trackers of size 104
23/7/2013 -- 12:22:45 -  - defrag memory usage: 8912792 bytes, maximum: 33554432
23/7/2013 -- 12:22:45 -  - AutoFP mode using default "Active Packets" flow load balancer
23/7/2013 -- 12:22:45 -  - preallocated 1024 packets. Total memory 3170304
23/7/2013 -- 12:22:45 -  - allocated 131072 bytes of memory for the host hash... 4096 buckets of size 32
23/7/2013 -- 12:22:45 -  - preallocated 1000 hosts of size 76
23/7/2013 -- 12:22:45 -  - host memory usage: 207072 bytes, maximum: 16777216
23/7/2013 -- 12:22:45 -  - allocated 2097152 bytes of memory for the flow hash... 65536 buckets of size 32
23/7/2013 -- 12:22:45 -  - preallocated 10000 flows of size 176
23/7/2013 -- 12:22:45 -  - flow memory usage: 3857152 bytes, maximum: 33554432
23/7/2013 -- 12:22:45 -  - IP reputation disabled
23/7/2013 -- 12:22:45 -  - using magic-file /usr/share/file/magic
了解该命令的更多使用方法请参考:Suricata – A Network Intrusion Detection and Prevention System。
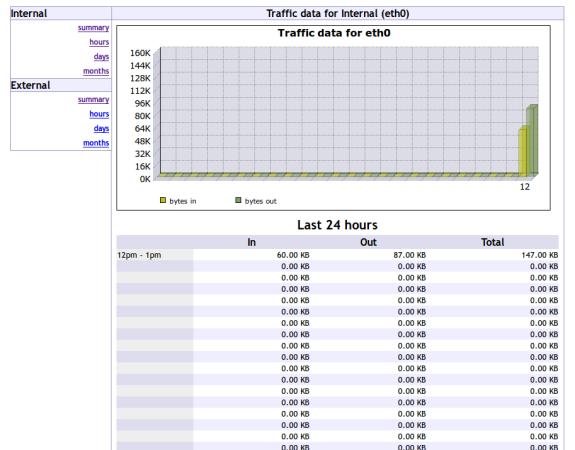
17,VnStat PHP – Monitoring Network Bandwidth
VnStat PHP 一个基于web的前端应用程序最受欢迎的网络工具叫 “vnstat“. VnStat PHP 使用漂亮的图形界面监控网络流量. 它显示了发送和接收的网络流量使用率在每小时,每周,每月的统计报告中。
该命令的更多用法参考:VnStat PHP – Monitoring Network Bandwidth 。
18,Nagios -- Network/Server Monitoring
Nagios是一个领先的开源强大的监控系统,让网络/系统管理员识别并解决服务器相关问题在影响主要业务流程之前。通过Nagios系统, 管理员能够远程监控系统,交换机,路由器和打印机通过单一的窗口。 它显示关键的警告和指示如果运行错误在你的网络/服务器,它能够间接地帮助你开始补救之前发生的错误。
具体使用方法请参考:: Install Nagios Monitoring System to Monitor Remote Linux/Windows Hosts 。
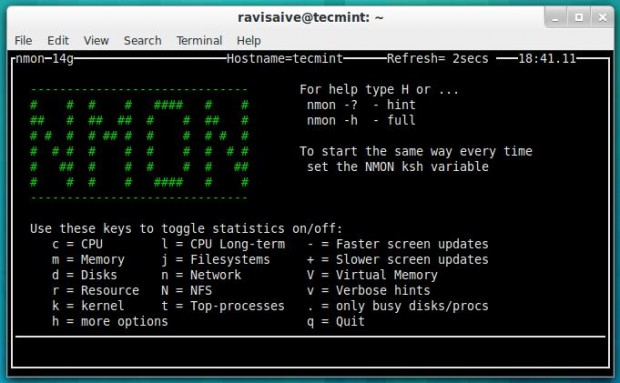
19, Nmon --Monitor Linux Performance
Nmon (stands for Nigel’s performance Monitor) 代表奈杰尔性能监视器工具, 它被用来见识Linux资源例如 CPU, Memory, Disk Usage, Network, Top processes, NFS, Kernel 等等. 这个工具带有两种模式: Online Mode(在线模式) 和 Capture(捕获模式) Mode.
在线模式,被用来实时监控。抓包模式,被用来存储那个包到格式为csv的文件中。
更多命令请参考:Install Nmon (Performance Monitoring) Tool in Linux 。
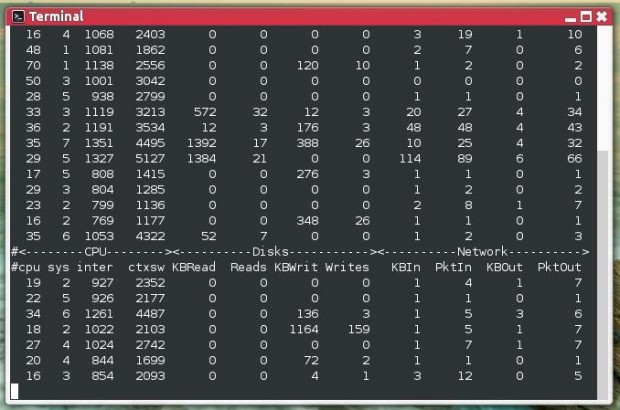
20,Collectl -- All-in-One Performance Monitoring Tool
Collectl is也是另外一个强大并且基于的丰富的命令行界面的实用工具。它能用来搜集linux的系统信息例如CPU usage(cpu使用率), memory(内存), network(网络), inodes(节点), processes(进程), nfs, tcp, sockets 等等.
更多命令参考:Install Collectl (All-in-One Performance Monitoring) Tool in Linux 。
前十个命令行工具请看前一篇文章《20个linux命令行工具监视性能(上)》 。
终于翻译完了20个linux命令行工具监视性能。也让我体会到了学习英语的重要性。本人的英语水平有限,有什么错误的地方还望大家多多指教。

出处:http://www.cnblogs.com/Hackerman/

 浙公网安备 33010602011771号