Prometheus -- 07 -- Prometheus+Grafana搭建SpringBoot监控
相关文章:
SpringBoot 2.X 在 spring-boot-actuator 中引入了 micrometer,并对 1.X 的 metrics 进行了重构,此外支持对接的监控系统也更加丰富了 (Atlas、Datadog、Ganglia、Graphite、Influx、JMX、NewRelic、Prometheus、SignalFx、StatsD、Wavefront),这里我们以 Prometheus 为例,来看看如何使用 Prometheus+Grafana 来监控 SpringBoot 项目
-
SpringBoot 版本
- 2.2.6.RELEASE
-
micrometer-registry-prometheus 版本
- 1.4.1
一、项目搭建
-
pom.xml
<dependency> <groupId>org.springframework.boot</groupId> <artifactId>spring-boot-starter-actuator</artifactId> </dependency> <dependency> <groupId>io.micrometer</groupId> <artifactId>micrometer-registry-prometheus</artifactId> <version>1.4.1</version> </dependency>-
如上所示,这里我们引用了 micrometer-registry-prometheus 的依赖,如果想对接其他的监控系统,只要引入对应的依赖即可,如:想对接 Influx 监控系统,引入 micrometer-registry-influx 依赖即可
-
micrometer 相关依赖地址:https://mvnrepository.com/artifact/io.micrometer
-
-
application.yml
server: port: 10000 management: endpoints: web: exposure: include: "prometheus" metrics: export: datadog: host-tag: "springboot"-
如上所示,在配置中我们指定端口为 10000,并将 Actuator 的
/actuator/prometheus端点暴露出来 -
host-tag: "springboot"的作用是设置一个名为 “springboot” 的标签,用于供 Prometheus 进行筛选
-
二、配置项目
-
将项目打包好后上传至服务器并启动项目,然后在 Prometheus 中对其进行集成
-
修改 Prometheus 的配置文件 (prometheus.yml),添加 SpringBoot 服务 (在 scrape_configs 属性下添加)
-
cd /usr/local/prometheus/prometheus-2.17.1.linux-amd64
-
vim prometheus.yml
scrape_configs: # The job name is added as a label `job=<job_name>` to any timeseries scraped from this config. - job_name: 'prometheus' # metrics_path defaults to '/metrics' # scheme defaults to 'http'. static_configs: - targets: ['localhost:9090'] - job_name: 'springboot' # 采集数据时间间隔 scrape_interval: 15s # 采集超时时间 scrape_timeout: 10s # 采集路径 metrics_path: '/actuator/prometheus' # 采集服务地址 static_configs: - targets: ['localhost:10000'] -
:wq
-
-
重启 prometheus 服务
- systemctl restart prometheus.service
三、添加 Dashboard
-
这里我使用的 Dashboard 是 Grafana 官网 Dashboard 库中的 JVM (Micrometer)
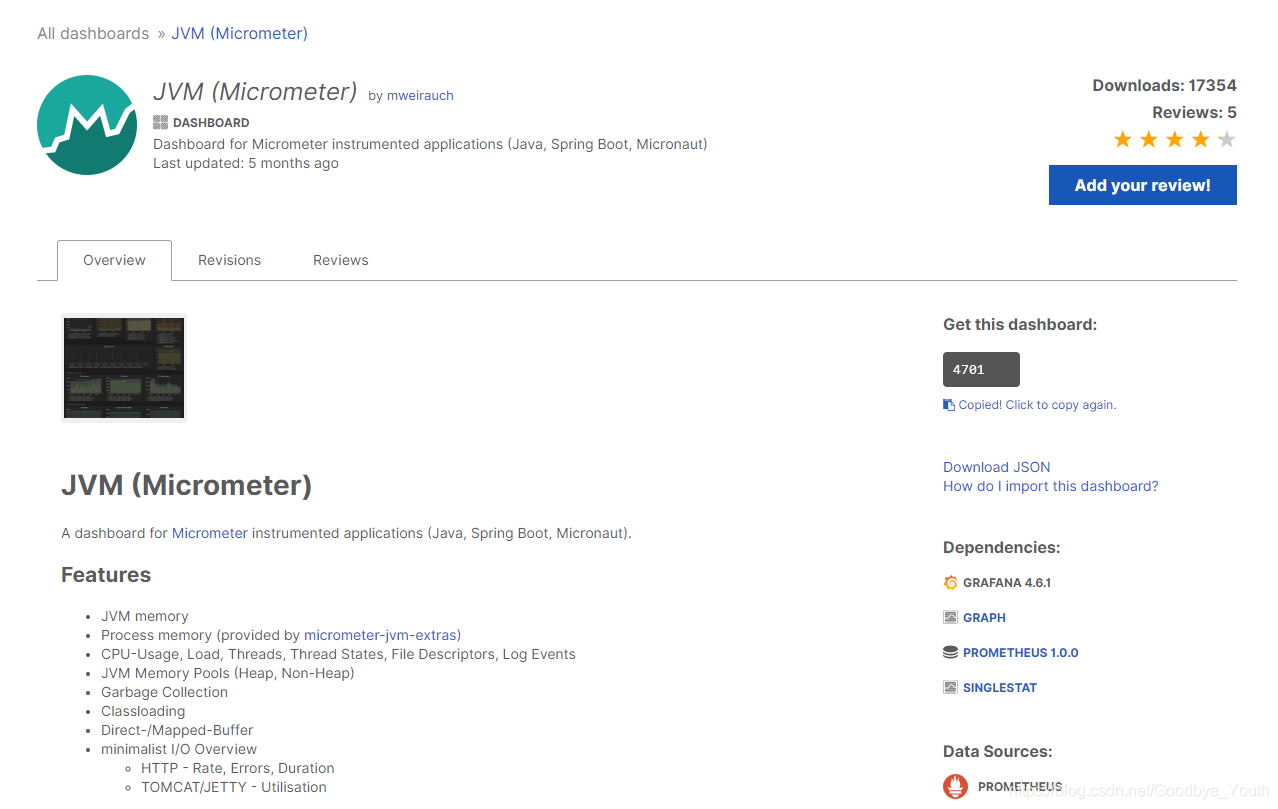
-
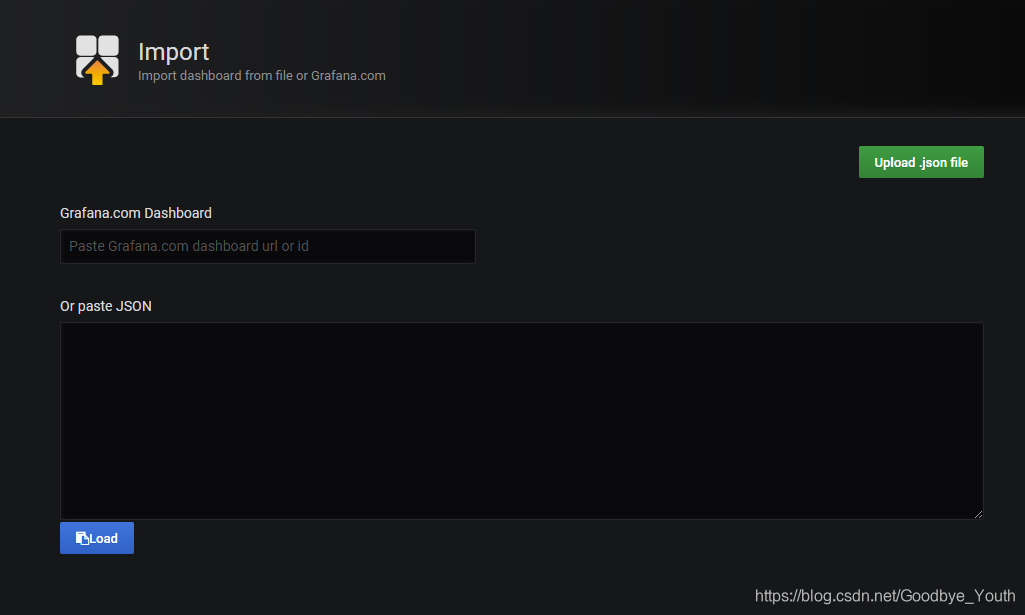
然后在 Grafana.com Dashboard 中输入 JVM (Micrometer) 对应的 Dashboard ID (4701),点击 Load 导入即可
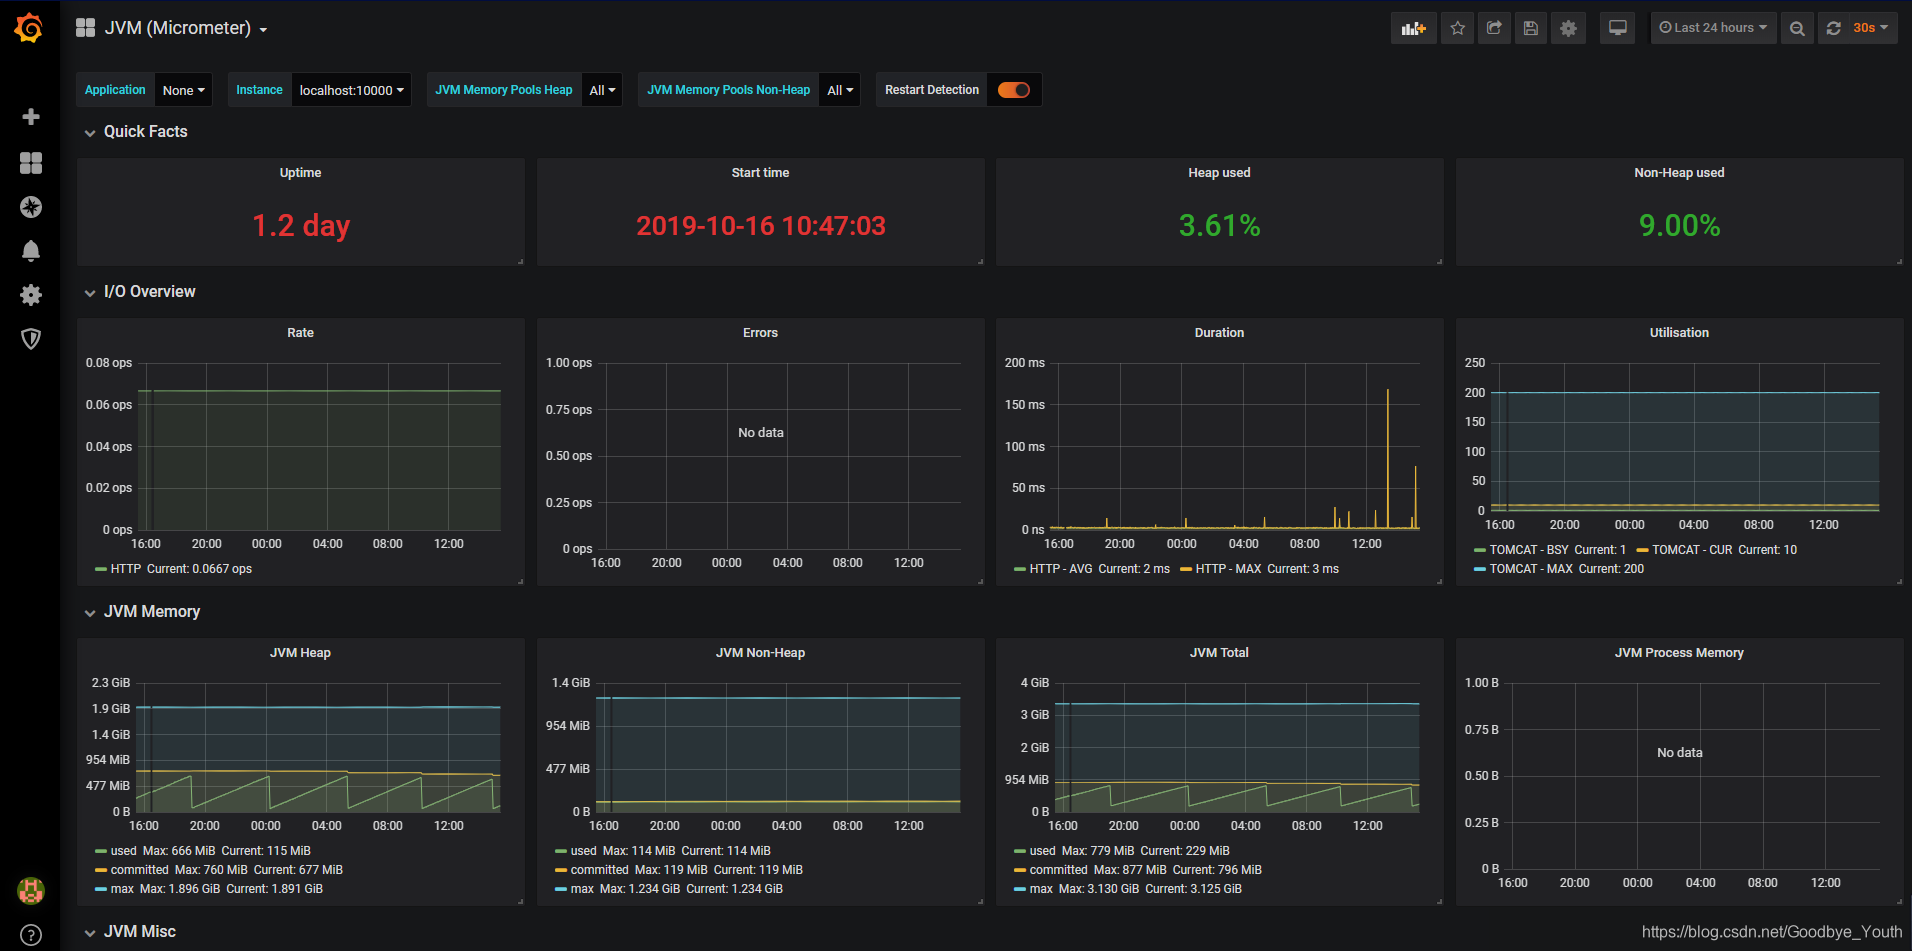
四、查看图表
-
至此,我们就大功告成了

 浙公网安备 33010602011771号