TeX系列: tikz-3dplot绘图宏包
2016-06-15 21:01 GarfieldEr007 阅读(3175) 评论(0) 收藏 举报tikz-3dplot包提供了针对TikZ的命令和坐标变换样式, 能够相对直接地绘制三维坐标系统和简单三维图形. tikz-3dplot包当前处于初创期, 有很多功能有待完善.
安装过程如下:
(1) 下载宏包tikz-3dplot.sty
http://www.ctan.org/tex-archive/graphics/pgf/contrib/tikz-3dplot/
(2) 把上述文件拷贝至TeX的目录树上, 比如D:\texmf\tex\latex\tikz-3dplot, 在DOS命令窗口执行
texhash
重建TeX目录树
尝试编译如下例子:
- \documentclass{article}
- \usepackage{tikz} %for TikZ graphics
- \usepackage{tikz-3dplot} %for 3dplot functionality
- \usepackage[active,tightpage]{preview} %generates a tightly fitting border around the work
- \PreviewEnvironment{tikzpicture}
- \setlength\PreviewBorder{2mm}
- \begin{document}
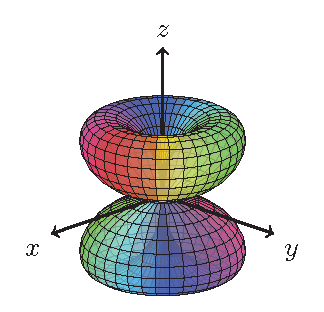
- \tdplotsetmaincoords{70}{135}
- \begin{tikzpicture}[line join=bevel,tdplot_main_coords, fill opacity=.7]
- \tdplotsphericalsurfaceplot[parametricfill]{72}{36}%
- {sqrt(15/2)*sin(\tdplottheta)*cos(\tdplottheta)}{black}{\tdplotphi}%
- {\draw[color=black,thick,->] (0,0,0) -- (2,0,0) node[anchor=north east]{$x$};}%
- {\draw[color=black,thick,->] (0,0,0) -- (0,2,0) node[anchor=north west]{$y$};}%
- {\draw[color=black,thick,->] (0,0,0) -- (0,0,2) node[anchor=south]{$z$};}%
- \end{tikzpicture}
- \end{document}
结果如下:
tikz-3dplot官方网站: http://tikz3dplot.wordpress.com/
from: http://blog.csdn.net/mathsoperator/article/details/6825010

 浙公网安备 33010602011771号