

Matplotlib 绘图与可视化 一些控件的介绍和属性,反正就是乱七八糟的
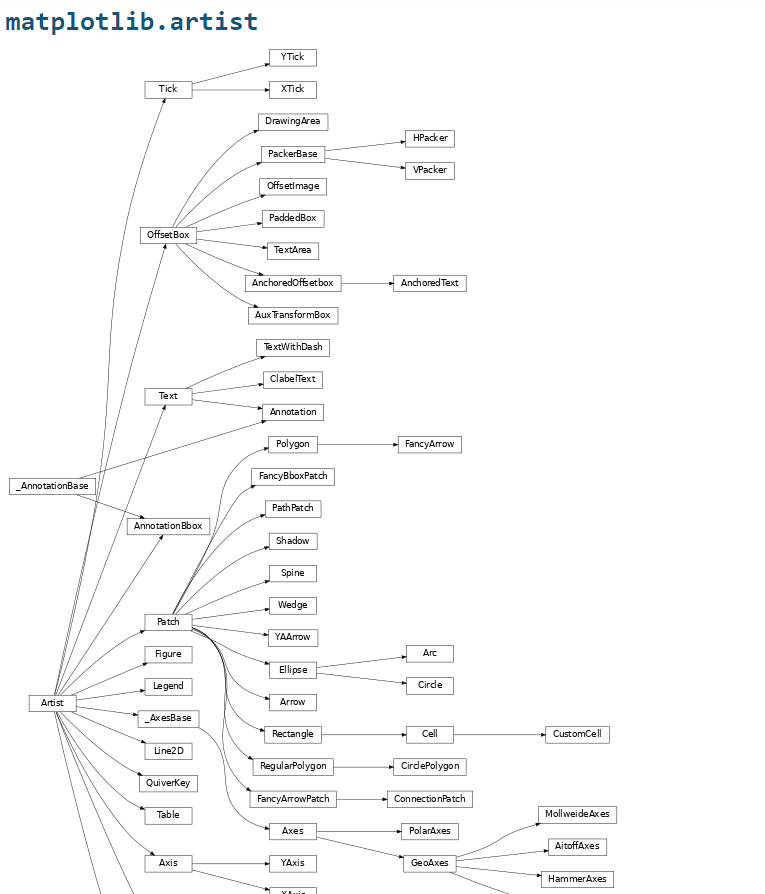
这个链接里有下面这个图(图里还有超链接):https://matplotlib.org/3.1.1/api/artist_api.html#matplotlib.artist.Artist
各种图例:(可以在不知道想要功能的基类时在这里面找):https://matplotlib.org/gallery/index.html
未分类:
get_xticklabels()返回一个text object的list,可以参考text object的属性来设置想要的功能
text:https://matplotlib.org/3.1.1/api/text_api.html#matplotlib.text.Text
设置label的offset的:class matplotlib.text.Text 的 horizontalalignment 属性:
参考链接:https://matplotlib.org/3.1.1/api/text_api.html#matplotlib.text.Text
legend:图例
参考链接:https://matplotlib.org/users/legend_guide.html(未看完)
基础链接:https://matplotlib.org/api/pyplot_api.html#matplotlib.pyplot.figlegend(未看完)
里面有怎么为plot添加图例的,包括位置、颜色、形状和label说明
知道base class的
figure:
可以理解为画板(还有一个大写的Figure)
参考链接:https://matplotlib.org/3.1.1/api/figure_api.html?highlight=figure#module-matplotlib.figure
是个module,提供了top-level的Artist,The Figure 包括了所有的绘制元素
还有定义的一些子类
Artist class
abstract base class for objects that render into a FigureCanvas(渲染为FigureCanvas的对象的抽象基类?#canvas:画布)
一般情况下,figure中的所有可见元素都是Artist的子类
参考链接:https://matplotlib.org/3.1.1/api/artist_api.html#matplotlib.artist.Artist
Figure:(也是一个类)
The top level container for all the plot elements
参考链接:https://matplotlib.org/3.1.1/api/_as_gen/matplotlib.figure.Figure.html#matplotlib.figure.Figure
有回调函数和事件
链接里有这个类的属性和参数,还有一些方法,添加Artist到figure,添加axes到figure(这种添加方式,如果如果图中已经有一个带键的轴,那么它只会使轴成为当前轴并返回它)还有别的,太长了,没看下去
plot:画布,
是画板的一小部分
Axes
是一个类,包括figure上的大部分figure元素:(Axis、Tick、line2D、Text、polygon...etc,)并且色泽这个坐标系,含有事件和回调函数,会在figure中建立一个axes
参考链接:https://matplotlib.org/3.1.1/api/axes_api.html?highlight=axes#module-matplotlib.axes
参考链接中还有subplots、plotting
Axis
就是坐标轴了:
参考链接:https://matplotlib.org/3.1.1/api/axis_api.html?highlight=label%20offset#id17(有很多内置类和方法)
secondary Axis:次要坐标轴,就是上面的和右边的轴
介绍了添加次要坐标轴的方法,举了一个例子说明
label
label是坐标轴上的标签,就是tick的文字内容,一条坐标轴上可以有多个labels
Tick
是坐标轴上的标记
参考链接:https://matplotlib.org/3.1.1/api/ticker_api.html#module-matplotlib.ticker
关于tick的定位和格式,太长了没看完
matplotlib.pyplot.xticks:获取或者设置当前x轴上的tick的位置和label
参考链接:https://matplotlib.org/3.1.1/api/_as_gen/matplotlib.pyplot.xticks.html#matplotlib.pyplot.xticks
返回一个包含label位置的数组,一个文字对象列表
plyplot调用(.xticks())(有参和无参)等等同与当前axes调用方法(.get_xticks()和get_xticklabels())
还可以Set text labels and properties:
参考链接中还包含ticks可以完成的工作,用图直观的罗列了出来
Custom Ticker1
The new ticker code was designed to explicitly support user customized ticking.
举了一个例子,通过一个自定义的函数,来自定义ticking
matplotlib.projections
The projection type of the subplot (Axes)
管理一组可供系统调用的projections(projection:投影)base:object
参考链接:https://translate.google.cn/?hl=zh-CN&tab=TT#view=home&op=translate&sl=en&tl=zh-CN&text=projections
matplotlib.pyplot
为matplotlib提供的基类接口,提供像MATLAB那样的方式来画图。主要用来交互式作图或者程序化作图的简单情况。推荐使用它解决更复杂的plots
matplotlib.pyplot.subplot
在当前figure中add a subplot,返回一个axes
参考链接:https://matplotlib.org/3.1.1/api/_as_gen/matplotlib.pyplot.subplot.html
和Figure.add_subplot()的不同
前者创建一个subplot会删除 除了交叠边界 以外与其重叠的 任何已经存在的subplot,而Figure.add_subplot()不会
后面以图片的信息展示了许多使用此种方法可以完成的图像
matplotlib.pyplot.subplots_adjust
调整这个subplots的布局
介绍了默认参数的意思(并且建议使用默认参数)
left = 0.125  #figure 上的subplots的左边宽度
right = 0.9   # the right side of the subplots of the figure
bottom = 0.1  # the bottom of the subplots of the figure
top = 0.9     # the top of the subplots of the figure
wspace = 0.2  # 在subplots中间保留的高度的量,使用一个axis 高度的分数来表示
hspace = 0.2  # the amount of height reserved for space between subplots,
              # expressed as a fraction of the average axis height
实际默认值由rc file 控制
matplotlib.pyplot.matshow
参考链接:https://matplotlib.org/3.1.1/api/_as_gen/matplotlib.pyplot.matshow.html#matplotlib.pyplot.matshow
在一个新的figure窗口中通过矩阵显示一个排列(类似像素点的图像,而不是你想的那样,链接中又sample)。原点设置在左上角,并且行(array中的第一个维度)垂直排列。figure窗口的纵横比就是这个array的,除非这样产生过分短或者狭窄的figure。
matplotlib.pyplot.figure
参考链接:https://matplotlib.org/3.1.1/api/_as_gen/matplotlib.pyplot.figure.html#matplotlib.pyplot.figure
creat a new figure
需要注意的是,如果你需要创建多个figures,确保你明确调用了pyplot.close()对你不使用的figure,因为这样能确保pyplot正确的从memory中清理
rcparm定义默认值,这些值能在 matplotlibrc文件中更改
matplotlib.pyplot.show
参考链接:https://matplotlib.org/3.1.1/api/_as_gen/matplotlib.pyplot.show.html#matplotlib.pyplot.show
提供了一些画图的例子,但是觉得可以直接看gallery中的
显示figure,需要注意的是在非交互模式中,会显示所有的figure并且block(阻塞?不知道是阻塞或者figure的同位语)直到所有的figure 被关闭。
而在交互模式中没有影响,除非你在又非交互模式切换到交互模式之前创建,在这种情况下,他会导致所有的figure显示并且不阻塞。
此外,他还提供了一个实验性的关键字参数:block 来覆盖上面描述的阻塞行为。
maximize a plt.show()
参考链接:https://stackoverflow.com/questions/12439588/how-to-maximize-a-plt-show-window-using-python
mng=plt.get_current_fig_manager()
mng.window.state('zoomed')

 浙公网安备 33010602011771号