
WPF IModule, IRegionManage,ContentRegion, MVVM, LiveCharts,PieChart,CartesianChart
Get-Project -All|Install-Package livecharts.wpf
Get-Project -All|Install-Package Prism.DryIoc -version 8.1.97
Get-Project -All|Install-Package Prism.Wpf -version 8.1.97


//Shell.App.xaml
<prism:PrismApplication x:Class="Shell.App"
             xmlns="http://schemas.microsoft.com/winfx/2006/xaml/presentation"
             xmlns:x="http://schemas.microsoft.com/winfx/2006/xaml"
             xmlns:local="clr-namespace:Shell"
             xmlns:prism="http://prismlibrary.com/">
</prism:PrismApplication>

//Shell.App.xaml.cs
using CanadaModule;
using LiveCharts.Wpf;
using Prism.DryIoc;
using Prism.Ioc;
using Prism.Modularity;
using System.Configuration;
using System.Data;
using System.Reflection;
using System.Windows;
using System.Windows.Shapes;

namespace Shell
{
    /// <summary>
    /// Interaction logic for App.xaml
    /// </summary>
    public partial class App : PrismApplication
    {
        protected override Window CreateShell()
        {
            return Container.Resolve<MainWindow>();
        }

        protected override void RegisterTypes(IContainerRegistry containerRegistry)
        {
            //注冊mock数据服务
            containerRegistry.RegisterSingleton<Shared.Services.MockDataService>(() => Shared.Services.MockDataService.Instance);
        }

        protected override void ConfigureModuleCatalog(IModuleCatalog moduleCatalog)
        {
            moduleCatalog.AddModule<HomeModule.HomeModule>();
            moduleCatalog.AddModule<USAModule.USAModule>();
            moduleCatalog.AddModule<CanadaModule.CanadaModule>();
            moduleCatalog.AddModule<AustraliaModule.AustraliaModule>();
            moduleCatalog.AddModule<UKModule.UKModule>();
            base.ConfigureModuleCatalog(moduleCatalog);
        }
    }

}

//MainWindow.xaml
<Window x:Class="Shell.MainWindow"
        xmlns="http://schemas.microsoft.com/winfx/2006/xaml/presentation"
        xmlns:x="http://schemas.microsoft.com/winfx/2006/xaml"
        xmlns:d="http://schemas.microsoft.com/expression/blend/2008"
        xmlns:mc="http://schemas.openxmlformats.org/markup-compatibility/2006"
        xmlns:local="clr-namespace:Shell"
        xmlns:prism="http://www.codeplex.com/prism"
        prism:ViewModelLocator.AutoWireViewModel="True"
        WindowState="Maximized"
        mc:Ignorable="d"
        Title="MainWindow" Height="450" Width="800">
    <Window.Resources>
        <local:ViewNameMatchConverter x:Key="ViewNameMatchConverter"/>

        <!-- 2. 修正导航按钮样式(用MultiDataTrigger替代原DataTrigger) -->
        <Style x:Key="NavButtonStyle" TargetType="Button">
            <Setter Property="Height" Value="50"/>
            <Setter Property="Background" Value="#34495E"/>
            <Setter Property="Foreground" Value="White"/>
            <Setter Property="FontSize" Value="30"/>
            <Setter Property="Padding" Value="10 5"/>
            <Setter Property="BorderThickness" Value="0"/>
            <Setter Property="HorizontalAlignment" Value="Stretch"/>
            <Setter Property="FontWeight" Value="Normal"/>
            <Style.Triggers>
                <!-- 原有鼠标悬浮效果 -->
                <Trigger Property="IsMouseOver" Value="True">
                    <Setter Property="Background" Value="#1ABC9C"/>
                    <Setter Property="Height" Value="70"/>
                </Trigger>

                <!-- 核心:MultiDataTrigger实现选中高亮(解决Value不能绑定的问题) -->
                <MultiDataTrigger>
                    <MultiDataTrigger.Conditions>
                        <Condition>
                            <Condition.Binding>
                                <!-- 多值绑定:同时传当前视图名 + 按钮参数 -->
                                <MultiBinding Converter="{StaticResource ViewNameMatchConverter}">
                                    <!-- 绑定窗口ViewModel的CurrentViewName -->
                                    <Binding RelativeSource="{RelativeSource AncestorType=Window}"
                                             Path="DataContext.CurrentViewName"/>
                                    <!-- 绑定当前按钮的CommandParameter -->
                                    <Binding RelativeSource="{RelativeSource Self}"
                                             Path="CommandParameter"/>
                                </MultiBinding>
                            </Condition.Binding>
                            <Condition.Value>True</Condition.Value>
                        </Condition>
                    </MultiDataTrigger.Conditions>

                    <!-- 选中高亮样式(可自定义) -->
                    <Setter Property="Background" Value="Cyan"/>
                    <!-- 红色背景 -->
                    <Setter Property="Height" Value="70"/>
                    <!-- 高度放大 -->
                    <Setter Property="FontWeight" Value="Bold"/>
                    <!-- 字体加粗 -->
                    <Setter Property="Foreground" Value="Yellow"/>
                    <!-- 黄色字体 -->
                    <Setter Property="BorderBrush" Value="White"/>
                    <!-- 白色边框 -->
                    <Setter Property="BorderThickness" Value="2"/>
                    <!-- 边框宽度 -->
                </MultiDataTrigger>
            </Style.Triggers>
        </Style>


        <!--<Style x:Key="NavButtonStyle" TargetType="Button">
            <Setter Property="Height" Value="50"/>
            <Setter Property="Background" Value="#34495E"/>
            <Setter Property="Foreground" Value="White"/>
            <Setter Property="FontSize" Value="30"/>
            <Setter Property="Padding" Value="10 5"/>
            <Setter Property="BorderThickness" Value="0"/>
            <Setter Property="HorizontalAlignment" Value="Stretch"/>
            <Style.Triggers>
                <Trigger Property="IsMouseOver" Value="True">
                    <Setter Property="Background" Value="#1ABC9C"/>
                    <Setter Property="Height" Value="70"/>
                </Trigger>
                -->
        <!-- 核心:选中高亮触发 -->
        <!--
                <DataTrigger
                    Binding="{Binding RelativeSource={RelativeSource AncestorType=Window}, Path=DataContext.CurrentViewName}"
                    Value="{Binding RelativeSource={RelativeSource Self}, Path=CommandParameter}">
                    -->
        <!-- 高亮样式(可自定义) -->
        <!--
                    <Setter Property="Background" Value="#E74C3C"/>
                    -->
        <!-- 红色高亮 -->
        <!--
                    <Setter Property="Height" Value="70"/>
                    -->
        <!-- 高度放大 -->
        <!--
                    <Setter Property="FontWeight" Value="Bold"/>
                    -->
        <!-- 字体加粗 -->
        <!--
                    <Setter Property="Foreground" Value="Yellow"/>
                    -->
        <!-- 字体黄色 -->
        <!--
                    <Setter Property="BorderBrush" Value="White"/>
                    -->
        <!-- 白色边框 -->
        <!--
                    <Setter Property="BorderThickness" Value="2"/>
                </DataTrigger>
            </Style.Triggers>
        </Style>-->

        <Style TargetType="TextBlock">
            <Style.Triggers>
                <Trigger Property="IsMouseOver" Value="True">
                    <Setter Property="Background" Value="#1ABC9C"/>
                </Trigger>
            </Style.Triggers>
        </Style>
    </Window.Resources>
    <Grid>
        <!--左侧导航栏-->
        <Grid.ColumnDefinitions>
            <ColumnDefinition Width="200"/>
            <ColumnDefinition Width="*"/>
        </Grid.ColumnDefinitions>

        <!--导航菜单-->
        <StackPanel Grid.Column="0" Background="#2C3E50" Margin="10">
            <TextBlock Text="导航菜单" FontSize="36" Foreground="White"
                       HorizontalAlignment="Center"/>
            <Button Content="首页" Command="{Binding NavigateCommand}"
                    CommandParameter="HomeView" Style="{StaticResource NavButtonStyle}"
                    Margin="0"/>
            <Button Content="USA" Command="{Binding NavigateCommand}"
                    CommandParameter="USAView" Style="{StaticResource NavButtonStyle}"
                    Margin="0"/>
            <Button Content="Canada" Command="{Binding NavigateCommand}"
                    CommandParameter="CanadaView" Style="{StaticResource NavButtonStyle}"
                    Margin="0"/>
            <Button Content="Australia" Command="{Binding NavigateCommand}"
                    CommandParameter="AustraliaView" Style="{StaticResource NavButtonStyle}"
                    Margin="0"/>
            <Button Content="UK" Command="{Binding NavigateCommand}"
                    CommandParameter="UKView" Style="{StaticResource NavButtonStyle}"
                    Margin="0"/>
        </StackPanel>

        <ContentControl Grid.Column="1"
                        prism:RegionManager.RegionName="ContentRegion"
                        Margin="2"/>
    </Grid>
</Window>

//MainWindowViewModel.cs
using Prism.Commands;
using Prism.Mvvm;
using Prism.Regions;
using System;
using System.Collections.Generic;
using System.Linq;
using System.Text;
using System.Threading.Tasks;

namespace Shell
{
    public class MainWindowViewModel : BindableBase
    {
        private readonly IRegionManager regionManager;

        // 跟踪当前选中的视图名称(初始为HomeView,默认高亮首页)
        private string _currentViewName = "HomeView";
        public string CurrentViewName
        {
            get => _currentViewName;
            set => SetProperty(ref _currentViewName, value); // 触发UI更新
        }

        public DelegateCommand<string> NavigateCommand { get; }
        public MainWindowViewModel(IRegionManager regionManagerValue)
        {
            regionManager = regionManagerValue;
            NavigateCommand = new DelegateCommand<string>(NavigateCommandExecuted);
            NavigateCommandExecuted("HomeView");
        }

        private void NavigateCommandExecuted(string viewName)
        {
            if (string.IsNullOrEmpty(viewName))
            {
                return;
            }

            // 1. 导航到指定视图
            regionManager.RequestNavigate("ContentRegion", viewName);
            // 2. 更新当前选中视图名称(用于按钮高亮)
            CurrentViewName = viewName;
        }
    }
}
//ViewNameMatchConverter.cs
using System;
using System.Collections.Generic;
using System.Globalization;
using System.Linq;
using System.Text;
using System.Threading.Tasks;
using System.Windows.Data;

namespace Shell
{
    /// <summary>
    /// 比较当前视图名和按钮参数是否一致的转换器
    /// </summary>
    public class ViewNameMatchConverter : IMultiValueConverter
    {
        /// <summary>
        /// 转换逻辑:value[0]=CurrentViewName,value[1]=CommandParameter
        /// </summary>
        public object Convert(object[] values, Type targetType, object parameter, CultureInfo culture)
        {
            // 校验参数完整性
            if (values.Length < 2 || values[0] == null || values[1] == null)
                return false;

            // 比较两个值是否相等(忽略大小写)
            string currentView = values[0].ToString();
            string buttonParam = values[1].ToString();
            return currentView.Equals(buttonParam, StringComparison.Ordinal);
        }

        // 反向转换无需实现(导航选中状态无需反向修改)
        public object[] ConvertBack(object value, Type[] targetTypes, object parameter, CultureInfo culture)
        {
            throw new NotImplementedException("无需反向转换");
        }
    }
}
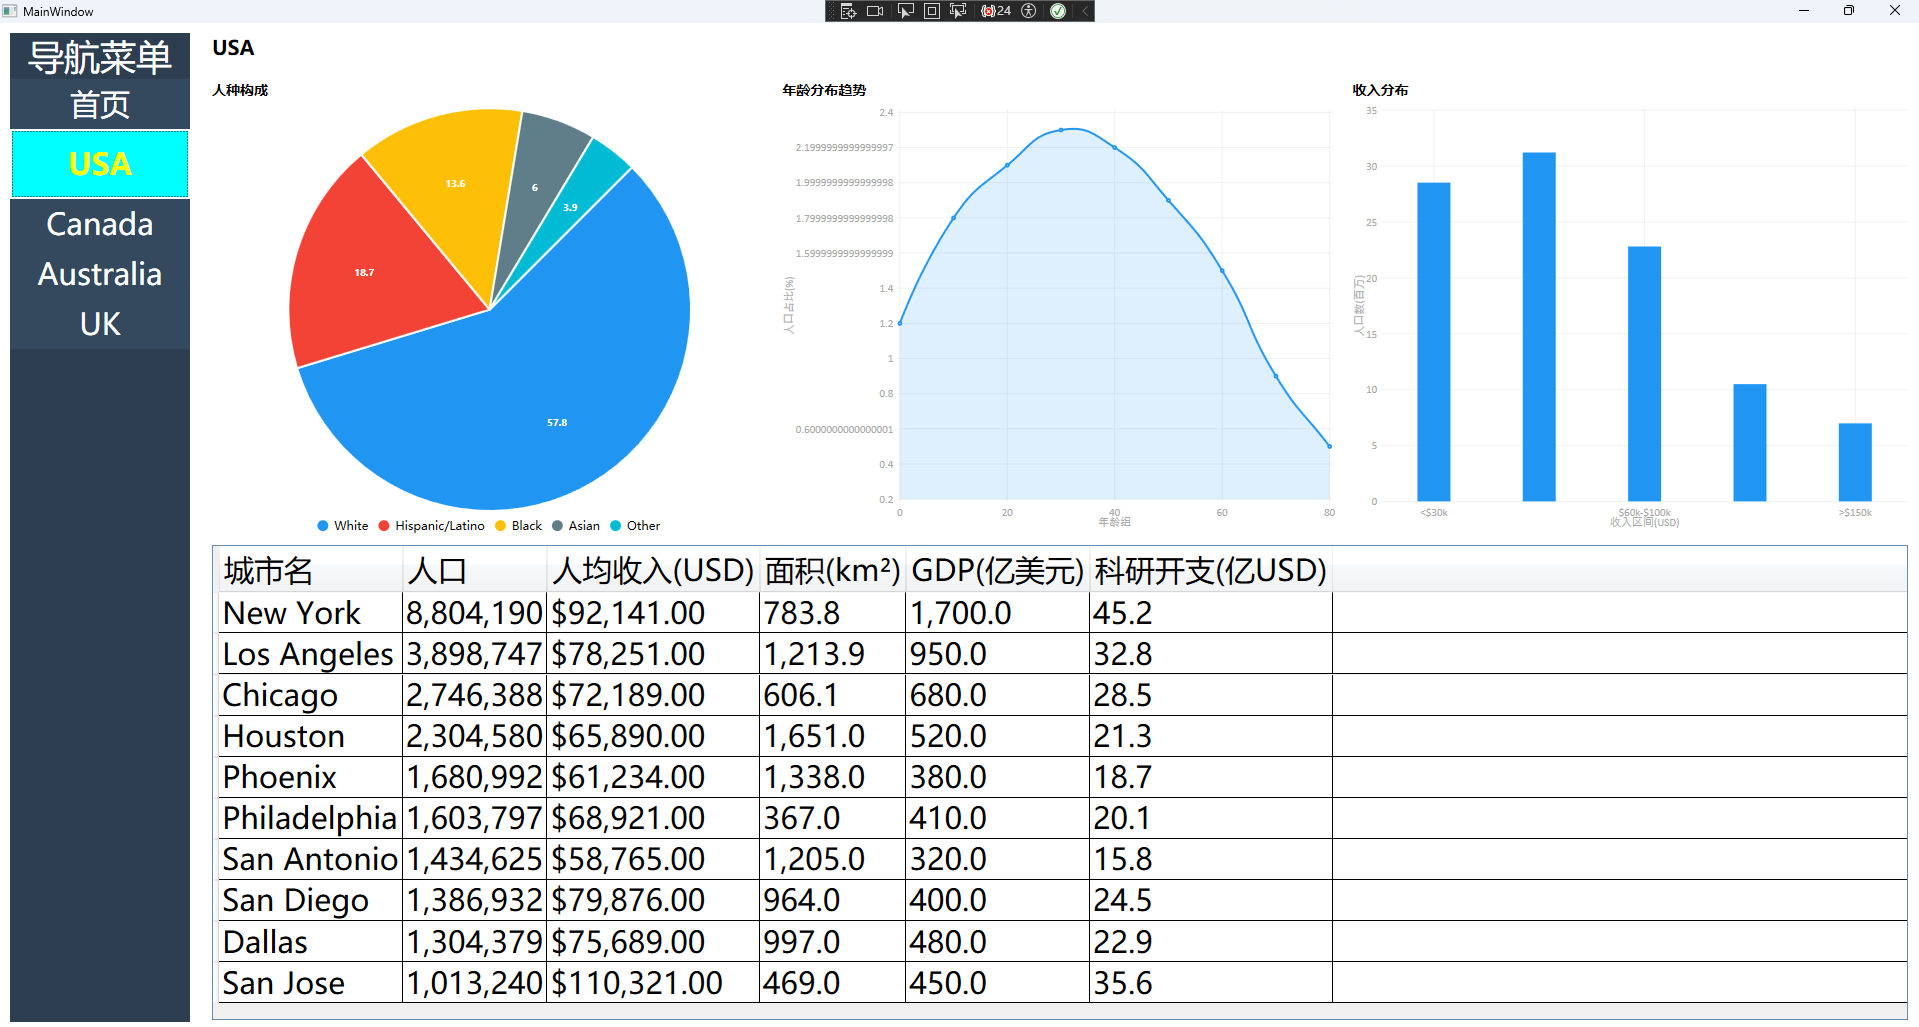
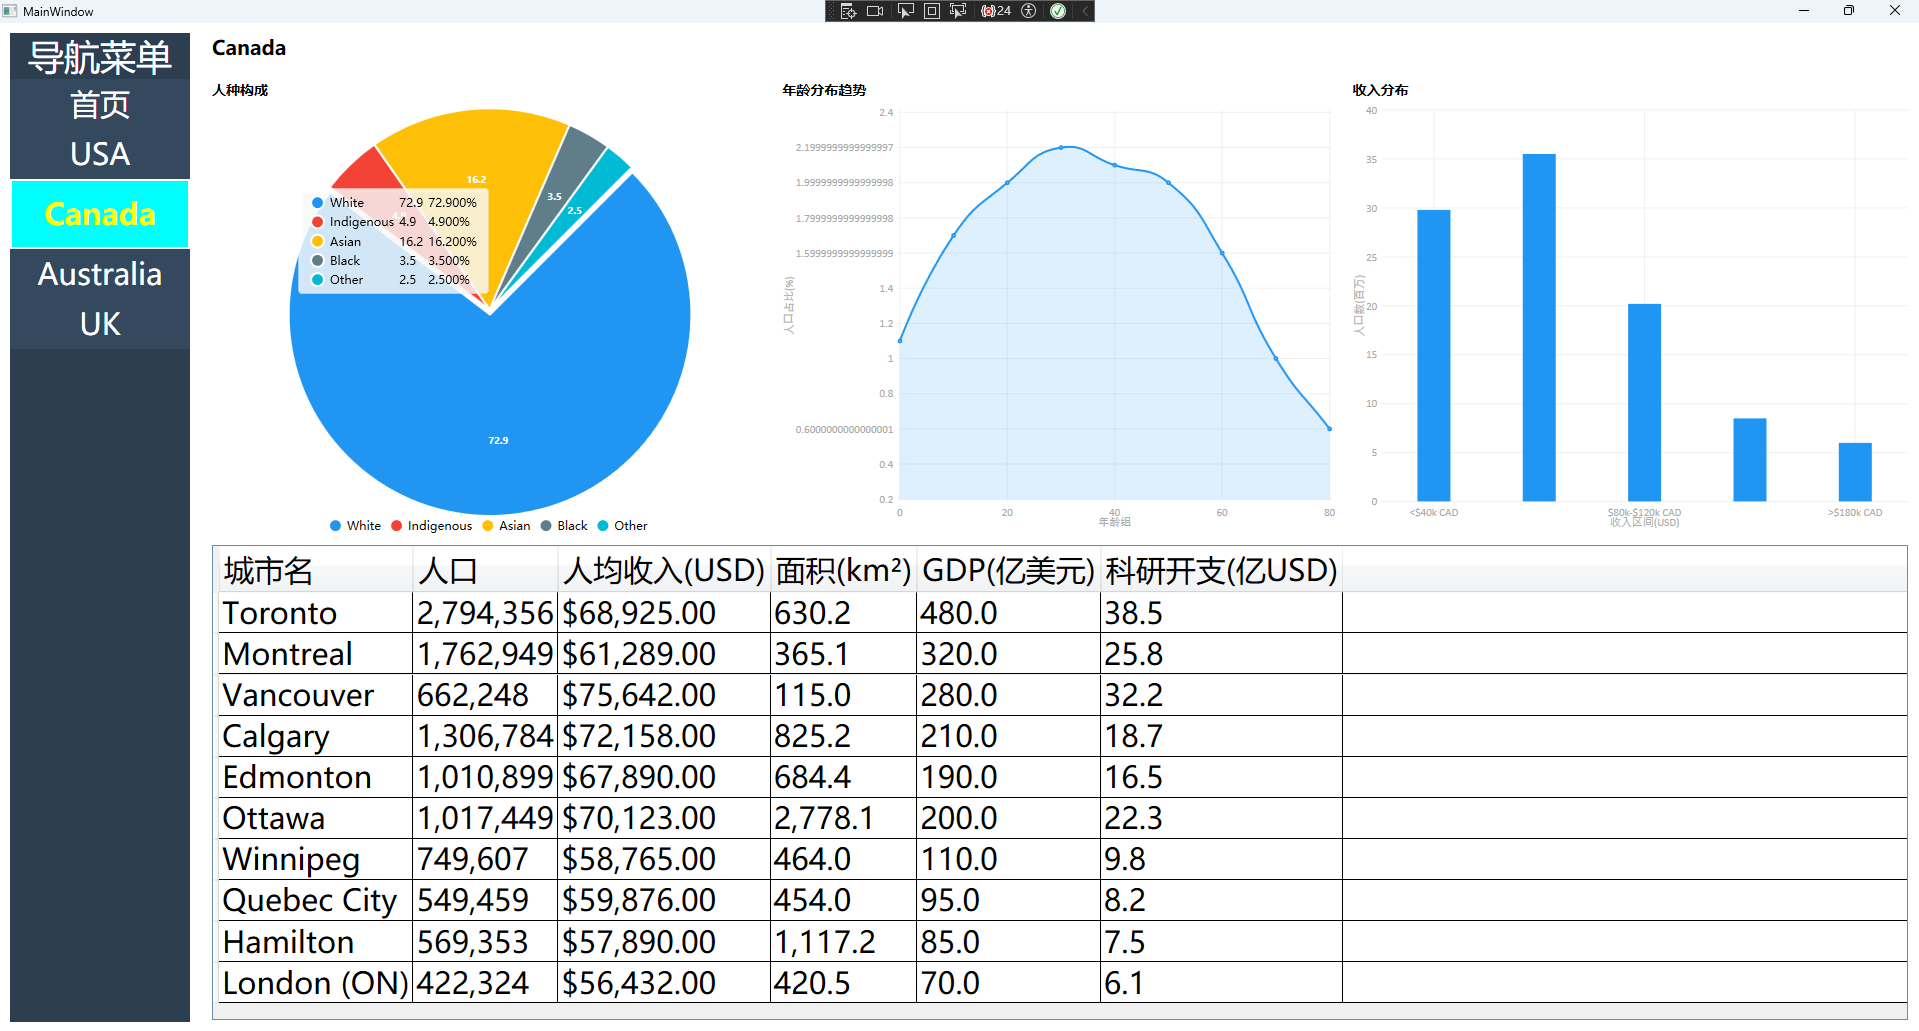
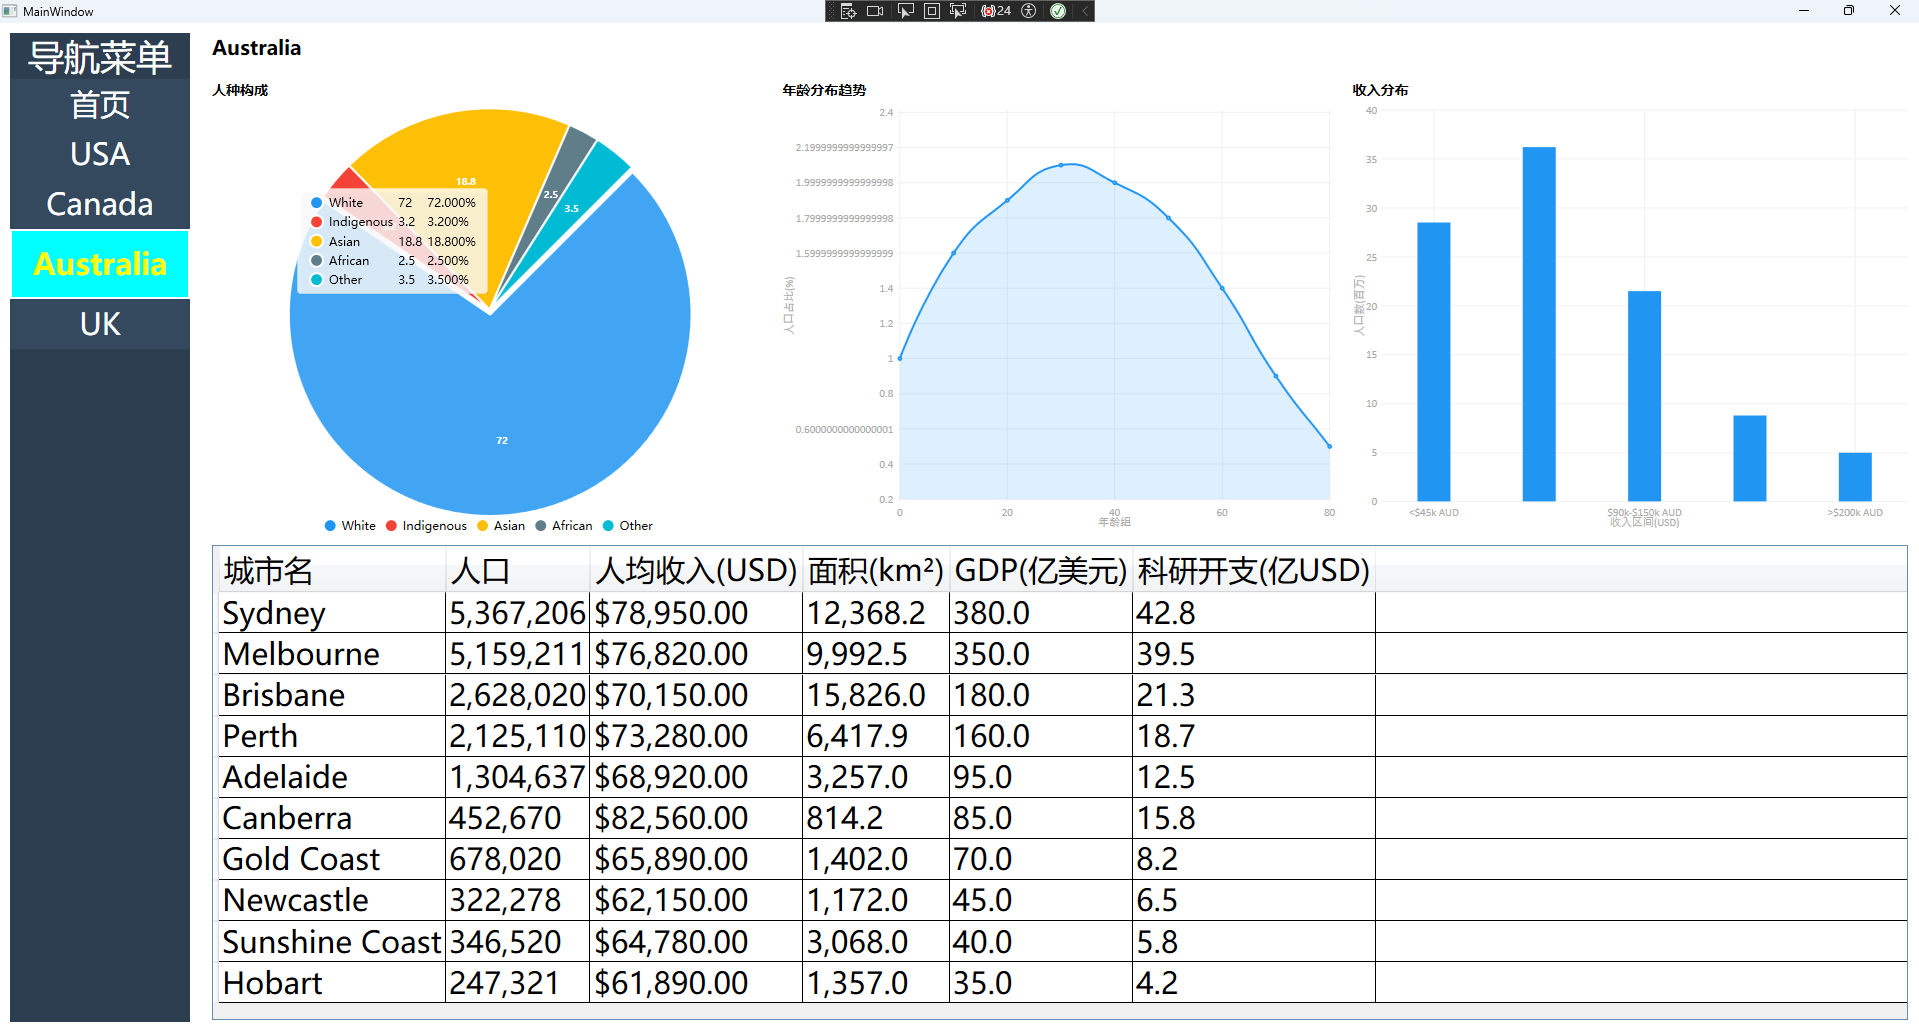
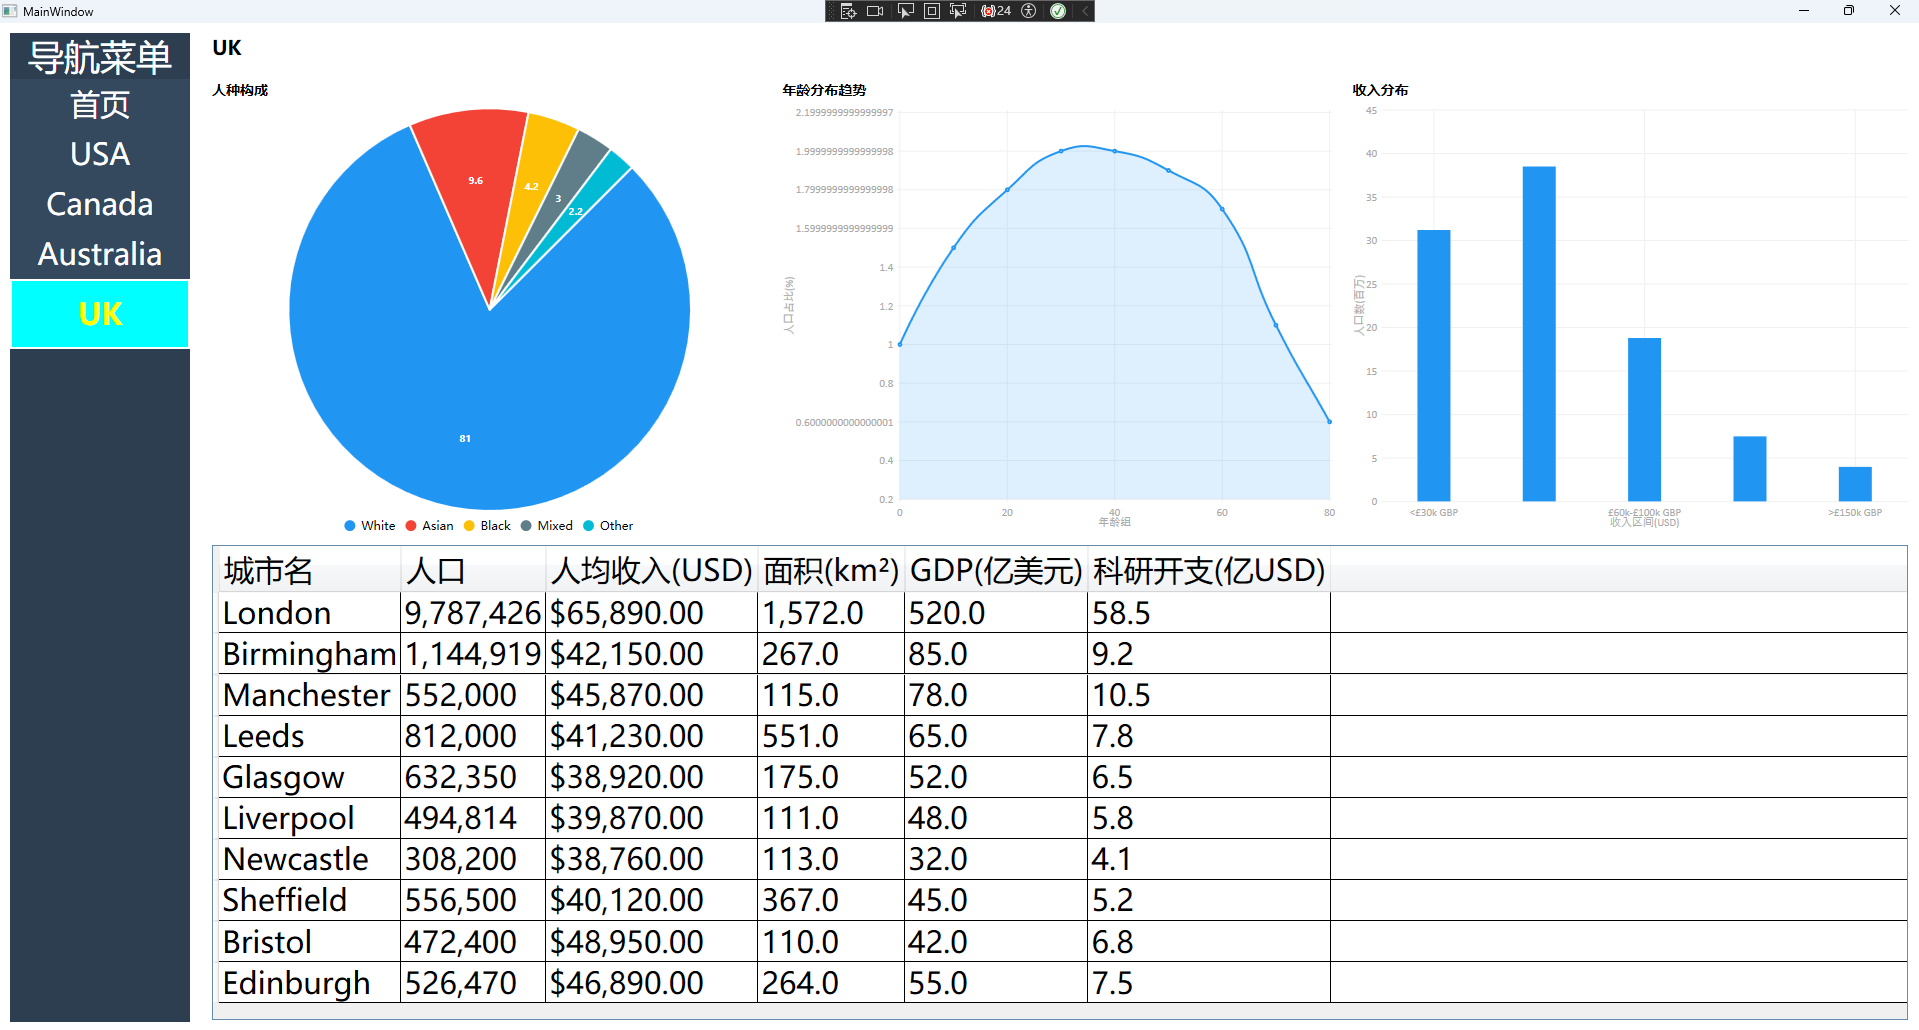
//Shared Module
using Shared.Models;
using System;
using System.Collections.Generic;
using System.Linq;
using System.Text;
using System.Threading.Tasks;

namespace Shared.Services
{
    /// <summary>
    /// 模拟数据服务(单例)
    /// </summary>
    public class MockDataService
    {
        private static readonly Lazy<MockDataService> _instance = new(() => new MockDataService());
        public static MockDataService Instance => _instance.Value;

        // 获取指定国家的完整数据
        public CountryStatsModel GetCountryData(string countryName)
        {
            return countryName.ToLower() switch
            {
                "usa" => GetUSAData(),
                "canada" => GetCanadaData(),
                "australia" => GetAustraliaData(),
                "uk" => GetUKData(),
                _ => GetHomeData() // 首页默认展示汇总
            };
        }

        #region 各国家Mock数据实现
        private CountryStatsModel GetUSAData()
        {
            return new CountryStatsModel
            {
                CountryName = "USA",
                Population = 334998398,
                PerCapitaIncome = 76398.23m,
                Area = 9833517.0,
                GDP = 26.854m,
                Capital = "Washington, D.C.",
                LargestCity = "New York City",
                RDSpending = 3.51m,

                // 人种构成(饼图)
                DemographicData = new List<DemographicData>
                {
                    new() { Ethnicity = "White", Percentage = 57.8 },
                    new() { Ethnicity = "Hispanic/Latino", Percentage = 18.7 },
                    new() { Ethnicity = "Black", Percentage = 13.6 },
                    new() { Ethnicity = "Asian", Percentage = 6.0 },
                    new() { Ethnicity = "Other", Percentage = 3.9 }
                },

                // 年龄趋势(折线图)
                AgeTrendData = new List<AgeTrendData>
                {
                    new() { AgeGroup = 0, PopulationRatio = 1.2 },
                    new() { AgeGroup = 10, PopulationRatio = 1.8 },
                    new() { AgeGroup = 20, PopulationRatio = 2.1 },
                    new() { AgeGroup = 30, PopulationRatio = 2.3 },
                    new() { AgeGroup = 40, PopulationRatio = 2.2 },
                    new() { AgeGroup = 50, PopulationRatio = 1.9 },
                    new() { AgeGroup = 60, PopulationRatio = 1.5 },
                    new() { AgeGroup = 70, PopulationRatio = 0.9 },
                    new() { AgeGroup = 80, PopulationRatio = 0.5 }
                },

                // 收入分布(柱状图)
                IncomeData = new List<IncomeData>
                {
                    new() { IncomeRange = "<$30k", PopulationCount = 28.5 },
                    new() { IncomeRange = "$30k-$60k", PopulationCount = 31.2 },
                    new() { IncomeRange = "$60k-$100k", PopulationCount = 22.8 },
                    new() { IncomeRange = "$100k-$150k", PopulationCount = 10.5 },
                    new() { IncomeRange = ">$150k", PopulationCount = 7.0 }
                },

                // 城市维度数据(表格)
                CityData = new List<CityStatsModel>
                {
                    new() { CityName = "New York", Population = 8804190, PerCapitaIncome = 92141.00m, Area = 783.8, GDP = 1700.0m, Region = "Northeast", RDSpending = 45.2m },
                    new() { CityName = "Los Angeles", Population = 3898747, PerCapitaIncome = 78251.00m, Area = 1213.9, GDP = 950.0m, Region = "West", RDSpending = 32.8m },
                    new() { CityName = "Chicago", Population = 2746388, PerCapitaIncome = 72189.00m, Area = 606.1, GDP = 680.0m, Region = "Midwest", RDSpending = 28.5m },
                    new() { CityName = "Houston", Population = 2304580, PerCapitaIncome = 65890.00m, Area = 1651.0, GDP = 520.0m, Region = "South", RDSpending = 21.3m },
                    new() { CityName = "Phoenix", Population = 1680992, PerCapitaIncome = 61234.00m, Area = 1338.0, GDP = 380.0m, Region = "West", RDSpending = 18.7m },
                    new() { CityName = "Philadelphia", Population = 1603797, PerCapitaIncome = 68921.00m, Area = 367.0, GDP = 410.0m, Region = "Northeast", RDSpending = 20.1m },
                    new() { CityName = "San Antonio", Population = 1434625, PerCapitaIncome = 58765.00m, Area = 1205.0, GDP = 320.0m, Region = "South", RDSpending = 15.8m },
                    new() { CityName = "San Diego", Population = 1386932, PerCapitaIncome = 79876.00m, Area = 964.0, GDP = 400.0m, Region = "West", RDSpending = 24.5m },
                    new() { CityName = "Dallas", Population = 1304379, PerCapitaIncome = 75689.00m, Area = 997.0, GDP = 480.0m, Region = "South", RDSpending = 22.9m },
                    new() { CityName = "San Jose", Population = 1013240, PerCapitaIncome = 110321.00m, Area = 469.0, GDP = 450.0m, Region = "West", RDSpending = 35.6m }
                }
            };
        }


        private CountryStatsModel GetCanadaData()
        {
            return new CountryStatsModel
            {
                CountryName = "Canada",
                Population = 38781291, // 2024年加拿大人口(模拟值)
                PerCapitaIncome = 54200.75m, // 人均收入(美元,基于加元换算)
                Area = 9984670.0, // 面积(万平方公里,世界第二)
                GDP = 2.200m, // GDP(万亿美元,2024年模拟值)
                Capital = "Ottawa", // 首都:渥太华
                LargestCity = "Toronto", // 最大城市:多伦多
                RDSpending = 1.70m, // 科研开支(GDP占比 %,加拿大研发投入占比约1.7%)

                // 人种构成(饼图)- 符合加拿大人口种族结构
                DemographicData = new List<DemographicData>
                {
                    new() { Ethnicity = "White", Percentage = 72.9 }, // 白种人(英裔/法裔为主)
                    new() { Ethnicity = "Indigenous", Percentage = 4.9 }, // 原住民
                    new() { Ethnicity = "Asian", Percentage = 16.2 }, // 亚裔(华裔、南亚裔等)
                    new() { Ethnicity = "Black", Percentage = 3.5 }, // 黑人
                    new() { Ethnicity = "Other", Percentage = 2.5 } // 其他种族
                },

                // 年龄趋势(折线图)- 加拿大老龄化略高于美国
                AgeTrendData = new List<AgeTrendData>
                {
                    new() { AgeGroup = 0, PopulationRatio = 1.1 }, // 0-9岁
                    new() { AgeGroup = 10, PopulationRatio = 1.7 }, // 10-19岁
                    new() { AgeGroup = 20, PopulationRatio = 2.0 }, // 20-29岁
                    new() { AgeGroup = 30, PopulationRatio = 2.2 }, // 30-39岁
                    new() { AgeGroup = 40, PopulationRatio = 2.1 }, // 40-49岁
                    new() { AgeGroup = 50, PopulationRatio = 2.0 }, // 50-59岁
                    new() { AgeGroup = 60, PopulationRatio = 1.6 }, // 60-69岁
                    new() { AgeGroup = 70, PopulationRatio = 1.0 }, // 70-79岁
                    new() { AgeGroup = 80, PopulationRatio = 0.6 } // 80+岁
                },

                // 收入分布(柱状图)- 以加元(CAD)为单位,符合加拿大收入水平
                IncomeData = new List<IncomeData>
                {
                    new() { IncomeRange = "<$40k CAD", PopulationCount = 29.8 }, // 低于4万加元
                    new() { IncomeRange = "$40k-$80k CAD", PopulationCount = 35.5 }, // 4-8万加元
                    new() { IncomeRange = "$80k-$120k CAD", PopulationCount = 20.2 }, // 8-12万加元
                    new() { IncomeRange = "$120k-$180k CAD", PopulationCount = 8.5 }, // 12-18万加元
                    new() { IncomeRange = ">$180k CAD", PopulationCount = 6.0 } // 高于18万加元
                },

                // 城市维度数据(表格)- 加拿大主要城市,数据均为合理模拟
                CityData = new List<CityStatsModel>
                {
                    new() { CityName = "Toronto", Population = 2794356, PerCapitaIncome = 68925.00m, Area = 630.2, GDP = 480.0m, Region = "Ontario", RDSpending = 38.5m },
                    new() { CityName = "Montreal", Population = 1762949, PerCapitaIncome = 61289.00m, Area = 365.1, GDP = 320.0m, Region = "Quebec", RDSpending = 25.8m },
                    new() { CityName = "Vancouver", Population = 662248, PerCapitaIncome = 75642.00m, Area = 115.0, GDP = 280.0m, Region = "British Columbia", RDSpending = 32.2m },
                    new() { CityName = "Calgary", Population = 1306784, PerCapitaIncome = 72158.00m, Area = 825.2, GDP = 210.0m, Region = "Alberta", RDSpending = 18.7m },
                    new() { CityName = "Edmonton", Population = 1010899, PerCapitaIncome = 67890.00m, Area = 684.4, GDP = 190.0m, Region = "Alberta", RDSpending = 16.5m },
                    new() { CityName = "Ottawa", Population = 1017449, PerCapitaIncome = 70123.00m, Area = 2778.1, GDP = 200.0m, Region = "Ontario", RDSpending = 22.3m },
                    new() { CityName = "Winnipeg", Population = 749607, PerCapitaIncome = 58765.00m, Area = 464.0, GDP = 110.0m, Region = "Manitoba", RDSpending = 9.8m },
                    new() { CityName = "Quebec City", Population = 549459, PerCapitaIncome = 59876.00m, Area = 454.0, GDP = 95.0m, Region = "Quebec", RDSpending = 8.2m },
                    new() { CityName = "Hamilton", Population = 569353, PerCapitaIncome = 57890.00m, Area = 1117.2, GDP = 85.0m, Region = "Ontario", RDSpending = 7.5m },
                    new() { CityName = "London (ON)", Population = 422324, PerCapitaIncome = 56432.00m, Area = 420.5, GDP = 70.0m, Region = "Ontario", RDSpending = 6.1m }
                }
            };
        }

        private CountryStatsModel GetAustraliaData()
        {
            return new CountryStatsModel
            {
                CountryName = "Australia",
                Population = 26759000, // 2024年澳大利亚人口(模拟值,实际约2670万)
                PerCapitaIncome = 64890.50m, // 人均收入(美元,基于澳元换算,澳元:美元≈1:0.65)
                Area = 7692024.0, // 面积(万平方公里,世界第六)
                GDP = 1.705m, // GDP(万亿美元,2024年模拟值)
                Capital = "Canberra", // 首都:堪培拉(注意:非悉尼/墨尔本)
                LargestCity = "Sydney", // 最大城市:悉尼
                RDSpending = 1.80m, // 科研开支(GDP占比 %,澳大利亚研发投入占比约1.8%)

                // 人种构成(饼图)- 符合澳大利亚多元文化人口结构
                DemographicData = new List<DemographicData>
        {
            new() { Ethnicity = "White", Percentage = 72.0 }, // 白种人(英裔为主)
            new() { Ethnicity = "Indigenous", Percentage = 3.2 }, // 原住民(土著/托雷斯海峡岛民)
            new() { Ethnicity = "Asian", Percentage = 18.8 }, // 亚裔(华裔、印度裔、菲律宾裔等)
            new() { Ethnicity = "African", Percentage = 2.5 }, // 非洲裔
            new() { Ethnicity = "Other", Percentage = 3.5 } // 其他种族(太平洋岛民等)
        },

                // 年龄趋势(折线图)- 澳大利亚老龄化程度适中,略低于加拿大
                AgeTrendData = new List<AgeTrendData>
        {
            new() { AgeGroup = 0, PopulationRatio = 1.0 }, // 0-9岁
            new() { AgeGroup = 10, PopulationRatio = 1.6 }, // 10-19岁
            new() { AgeGroup = 20, PopulationRatio = 1.9 }, // 20-29岁
            new() { AgeGroup = 30, PopulationRatio = 2.1 }, // 30-39岁
            new() { AgeGroup = 40, PopulationRatio = 2.0 }, // 40-49岁
            new() { AgeGroup = 50, PopulationRatio = 1.8 }, // 50-59岁
            new() { AgeGroup = 60, PopulationRatio = 1.4 }, // 60-69岁
            new() { AgeGroup = 70, PopulationRatio = 0.9 }, // 70-79岁
            new() { AgeGroup = 80, PopulationRatio = 0.5 } // 80+岁
        },

                // 收入分布(柱状图)- 以澳元(AUD)为单位,符合澳大利亚收入水平
                IncomeData = new List<IncomeData>
        {
            new() { IncomeRange = "<$45k AUD", PopulationCount = 28.5 }, // 低于4.5万澳元
            new() { IncomeRange = "$45k-$90k AUD", PopulationCount = 36.2 }, // 4.5-9万澳元
            new() { IncomeRange = "$90k-$150k AUD", PopulationCount = 21.5 }, // 9-15万澳元
            new() { IncomeRange = "$150k-$200k AUD", PopulationCount = 8.8 }, // 15-20万澳元
            new() { IncomeRange = ">$200k AUD", PopulationCount = 5.0 } // 高于20万澳元
        },

                // 城市维度数据(表格)- 澳大利亚主要城市,数据均为合理模拟
                CityData = new List<CityStatsModel>
        {
            new() { CityName = "Sydney", Population = 5367206, PerCapitaIncome = 78950.00m, Area = 12368.2, GDP = 380.0m, Region = "New South Wales", RDSpending = 42.8m },
            new() { CityName = "Melbourne", Population = 5159211, PerCapitaIncome = 76820.00m, Area = 9992.5, GDP = 350.0m, Region = "Victoria", RDSpending = 39.5m },
            new() { CityName = "Brisbane", Population = 2628020, PerCapitaIncome = 70150.00m, Area = 15826.0, GDP = 180.0m, Region = "Queensland", RDSpending = 21.3m },
            new() { CityName = "Perth", Population = 2125110, PerCapitaIncome = 73280.00m, Area = 6417.9, GDP = 160.0m, Region = "Western Australia", RDSpending = 18.7m },
            new() { CityName = "Adelaide", Population = 1304637, PerCapitaIncome = 68920.00m, Area = 3257.0, GDP = 95.0m, Region = "South Australia", RDSpending = 12.5m },
            new() { CityName = "Canberra", Population = 452670, PerCapitaIncome = 82560.00m, Area = 814.2, GDP = 85.0m, Region = "Australian Capital Territory", RDSpending = 15.8m },
            new() { CityName = "Gold Coast", Population = 678020, PerCapitaIncome = 65890.00m, Area = 1402.0, GDP = 70.0m, Region = "Queensland", RDSpending = 8.2m },
            new() { CityName = "Newcastle", Population = 322278, PerCapitaIncome = 62150.00m, Area = 1172.0, GDP = 45.0m, Region = "New South Wales", RDSpending = 6.5m },
            new() { CityName = "Sunshine Coast", Population = 346520, PerCapitaIncome = 64780.00m, Area = 3068.0, GDP = 40.0m, Region = "Queensland", RDSpending = 5.8m },
            new() { CityName = "Hobart", Population = 247321, PerCapitaIncome = 61890.00m, Area = 1357.0, GDP = 35.0m, Region = "Tasmania", RDSpending = 4.2m }
        }
            };
        }

        private CountryStatsModel GetUKData()
        {
            return new CountryStatsModel
            {
                CountryName = "UK",
                Population = 67530172, // 2024年英国人口(模拟值,实际约6750万)
                PerCapitaIncome = 48520.80m, // 人均收入(美元,基于英镑换算,GBP:USD≈1:1.27)
                Area = 242495.0, // 面积(平方公里,含英格兰、苏格兰、威尔士、北爱尔兰)
                GDP = 3.150m, // GDP(万亿美元,2024年模拟值)
                Capital = "London", // 首都:伦敦(英国唯一的国际化大都市)
                LargestCity = "London", // 最大城市:伦敦(英国城市规模高度集中)
                RDSpending = 1.75m, // 科研开支(GDP占比 %,英国研发投入占比约1.75%)

                // 人种构成(饼图)- 符合英国多元文化人口结构(2024年模拟)
                DemographicData = new List<DemographicData>
                {
                    new() { Ethnicity = "White", Percentage = 81.0 }, // 白种人(英格兰裔、苏格兰裔、威尔士裔等)
                    new() { Ethnicity = "Asian", Percentage = 9.6 }, // 亚裔(印度裔、巴基斯坦裔、孟加拉裔、华裔等)
                    new() { Ethnicity = "Black", Percentage = 4.2 }, // 黑人(加勒比裔、非洲裔)
                    new() { Ethnicity = "Mixed", Percentage = 3.0 }, // 混血人种
                    new() { Ethnicity = "Other", Percentage = 2.2 } // 其他种族(中东裔、东欧裔等)
                },

                // 年龄趋势(折线图)- 英国老龄化程度高于美/加/澳,低于日本
                AgeTrendData = new List<AgeTrendData>
                {
                    new() { AgeGroup = 0, PopulationRatio = 1.0 }, // 0-9岁
                    new() { AgeGroup = 10, PopulationRatio = 1.5 }, // 10-19岁
                    new() { AgeGroup = 20, PopulationRatio = 1.8 }, // 20-29岁
                    new() { AgeGroup = 30, PopulationRatio = 2.0 }, // 30-39岁
                    new() { AgeGroup = 40, PopulationRatio = 2.0 }, // 40-49岁
                    new() { AgeGroup = 50, PopulationRatio = 1.9 }, // 50-59岁
                    new() { AgeGroup = 60, PopulationRatio = 1.7 }, // 60-69岁
                    new() { AgeGroup = 70, PopulationRatio = 1.1 }, // 70-79岁
                    new() { AgeGroup = 80, PopulationRatio = 0.6 } // 80+岁
                },

                // 收入分布(柱状图)- 以英镑(GBP)为单位,符合英国收入水平
                IncomeData = new List<IncomeData>
                {
                    new() { IncomeRange = "<£30k GBP", PopulationCount = 31.2 }, // 低于3万英镑
                    new() { IncomeRange = "£30k-£60k GBP", PopulationCount = 38.5 }, // 3-6万英镑
                    new() { IncomeRange = "£60k-£100k GBP", PopulationCount = 18.8 }, // 6-10万英镑
                    new() { IncomeRange = "£100k-£150k GBP", PopulationCount = 7.5 }, // 10-15万英镑
                    new() { IncomeRange = ">£150k GBP", PopulationCount = 4.0 } // 高于15万英镑
                },

                // 城市维度数据(表格)- 英国主要城市,覆盖英格兰/苏格兰/威尔士,数据合理模拟
                CityData = new List<CityStatsModel>
                {
                    new() { CityName = "London", Population = 9787426, PerCapitaIncome = 65890.00m, Area = 1572.0, GDP = 520.0m, Region = "England", RDSpending = 58.5m },
                    new() { CityName = "Birmingham", Population = 1144919, PerCapitaIncome = 42150.00m, Area = 267.0, GDP = 85.0m, Region = "England (West Midlands)", RDSpending = 9.2m },
                    new() { CityName = "Manchester", Population = 552000, PerCapitaIncome = 45870.00m, Area = 115.0, GDP = 78.0m, Region = "England (North West)", RDSpending = 10.5m },
                    new() { CityName = "Leeds", Population = 812000, PerCapitaIncome = 41230.00m, Area = 551.0, GDP = 65.0m, Region = "England (Yorkshire)", RDSpending = 7.8m },
                    new() { CityName = "Glasgow", Population = 632350, PerCapitaIncome = 38920.00m, Area = 175.0, GDP = 52.0m, Region = "Scotland", RDSpending = 6.5m },
                    new() { CityName = "Liverpool", Population = 494814, PerCapitaIncome = 39870.00m, Area = 111.0, GDP = 48.0m, Region = "England (North West)", RDSpending = 5.8m },
                    new() { CityName = "Newcastle", Population = 308200, PerCapitaIncome = 38760.00m, Area = 113.0, GDP = 32.0m, Region = "England (North East)", RDSpending = 4.1m },
                    new() { CityName = "Sheffield", Population = 556500, PerCapitaIncome = 40120.00m, Area = 367.0, GDP = 45.0m, Region = "England (Yorkshire)", RDSpending = 5.2m },
                    new() { CityName = "Bristol", Population = 472400, PerCapitaIncome = 48950.00m, Area = 110.0, GDP = 42.0m, Region = "England (South West)", RDSpending = 6.8m },
                    new() { CityName = "Edinburgh", Population = 526470, PerCapitaIncome = 46890.00m, Area = 264.0, GDP = 55.0m, Region = "Scotland", RDSpending = 7.5m }
                }
            };
        }

        private CountryStatsModel GetHomeData() => new() { /* 首页汇总数据 */ };
        #endregion
    }
}


using LiveCharts;
using System;
using System.Collections.Generic;
using System.Linq;
using System.Text;
using System.Threading.Tasks;

namespace Shared.Models
{
    public class AgeTrendData
    {
        public int AgeGroup { get; set; } // 年龄组(如10,20,30...)
        public double PopulationRatio { get; set; } // 该年龄组占比
        public ChartValues<double> TrendValues => new() { PopulationRatio };
    }
}

using System;
using System.Collections.Generic;
using System.Linq;
using System.Text;
using System.Threading.Tasks;

namespace Shared.Models
{
    /// <summary>
    /// 城市级统计数据
    /// </summary>
    public class CityStatsModel
    {
        public string CityName { get; set; } = string.Empty;
        public long Population { get; set; }
        public decimal PerCapitaIncome { get; set; }
        public double Area { get; set; }
        public decimal GDP { get; set; } // 城市GDP(亿美元)
        public string Region { get; set; } = string.Empty; // 所属区域
        public decimal RDSpending { get; set; } // 科研开支(亿美金)
    }
}
using System;
using System.Collections.Generic;
using System.Linq;
using System.Text;
using System.Threading.Tasks;

namespace Shared.Models
{
    /// <summary>
    /// 国家级统计数据
    /// </summary>
    public class CountryStatsModel
    {
        public string CountryName { get; set; } = string.Empty;
        public long Population { get; set; } // 人口
        public decimal PerCapitaIncome { get; set; } // 人均收入(美元)
        public double Area { get; set; } // 面积(万平方公里)
        public decimal GDP { get; set; } // GDP(万亿美元)
        public string Capital { get; set; } = string.Empty; // 首都
        public string LargestCity { get; set; } = string.Empty; // 最大城市
        public decimal RDSpending { get; set; } // 科研开支(GDP占比 %)

        // 图表数据
        public List<DemographicData> DemographicData { get; set; } = new(); // 人种构成
        public List<AgeTrendData> AgeTrendData { get; set; } = new(); // 年龄趋势
        public List<IncomeData> IncomeData { get; set; } = new(); // 收入分布
                                                                  // 城市维度数据
        public List<CityStatsModel> CityData { get; set; } = new(); // 城市数据
    }
}


using LiveCharts;
using System;
using System.Collections.Generic;
using System.Linq;
using System.Text;
using System.Threading.Tasks;

namespace Shared.Models
{
    public class DemographicData
    {
        public string Ethnicity { get; set; } = string.Empty; // 人种
        public double Percentage { get; set; } // 占比
        public SeriesCollection PieSeries => new()
        {
            new LiveCharts.Wpf.PieSeries
            {
                Title = Ethnicity,
                Values = new ChartValues<double> { Percentage },
                DataLabels = true
            }
        };
    }
}


using LiveCharts;
using System;
using System.Collections.Generic;
using System.Linq;
using System.Text;
using System.Threading.Tasks;

namespace Shared.Models
{
    public class IncomeData
    {
        public string IncomeRange { get; set; } = string.Empty; // 收入区间
        public double PopulationCount { get; set; } // 该区间人口数(百万)
        public ChartValues<double> ColumnValues => new() { PopulationCount };
    }
}
//AustraliaModule
using Prism.Ioc;
using Prism.Modularity;
using System;
using System.Collections.Generic;
using System.Linq;
using System.Text;
using System.Threading.Tasks;

namespace AustraliaModule
{
    public class AustraliaModule : IModule
    {
        public void OnInitialized(IContainerProvider containerProvider)
        {

        }

        public void RegisterTypes(IContainerRegistry containerRegistry)
        {
            containerRegistry.RegisterForNavigation<AustraliaView>();
        }
    }
}
<UserControl x:Class="AustraliaModule.AustraliaView"
             xmlns="http://schemas.microsoft.com/winfx/2006/xaml/presentation"
             xmlns:x="http://schemas.microsoft.com/winfx/2006/xaml"
             xmlns:mc="http://schemas.openxmlformats.org/markup-compatibility/2006"
             xmlns:d="http://schemas.microsoft.com/expression/blend/2008"
             xmlns:local="clr-namespace:AustraliaModule"
                          xmlns:prism="http://prismlibrary.com/"
             xmlns:lvc="clr-namespace:LiveCharts.Wpf;assembly=LiveCharts.Wpf"
             xmlns:shared="clr-namespace:Shared.Models;assembly=Shared"
             prism:ViewModelLocator.AutoWireViewModel="True">
    <UserControl.Resources>
        <!-- 转换器:布尔值转可见性 -->
        <BooleanToVisibilityConverter x:Key="BoolToVis"/>
    </UserControl.Resources>

    <Grid Margin="10">
        <Grid.RowDefinitions>
            <RowDefinition Height="Auto"/>
            <RowDefinition Height="*"/>
            <RowDefinition Height="Auto"/>
            <RowDefinition Height="*"/>
            <RowDefinition Height="Auto"/>
        </Grid.RowDefinitions>

        <!-- 1. 页面标题 -->
        <TextBlock Grid.Row="0" Text="{Binding CountryData.CountryName}"
                 FontSize="20" FontWeight="Bold" Margin="0 0 0 10"/>

        <!-- 2. 图表区域(饼图+折线图+柱状图) -->
        <Grid Grid.Row="1" Margin="0 10 0 10">
            <Grid.ColumnDefinitions>
                <ColumnDefinition Width="1*"/>
                <ColumnDefinition Width="1*"/>
                <ColumnDefinition Width="1*"/>
            </Grid.ColumnDefinitions>

            <!-- 人种构成饼图 -->
            <Grid Grid.Column="0" Margin="0 0 10 0">
                <Grid.RowDefinitions>
                    <RowDefinition Height="Auto"/>
                    <RowDefinition Height="*"/>
                </Grid.RowDefinitions>
                <TextBlock Text="人种构成" FontSize="14" FontWeight="SemiBold" Margin="0 0 0 5"/>
                <lvc:PieChart Grid.Row="1" Series="{Binding DemographicSeries}"
                            LegendLocation="Bottom"/>
            </Grid>

            <!-- 年龄趋势折线图 -->
            <Grid Grid.Column="1" Margin="5 0 5 0">
                <Grid.RowDefinitions>
                    <RowDefinition Height="Auto"/>
                    <RowDefinition Height="*"/>
                </Grid.RowDefinitions>
                <TextBlock Text="年龄分布趋势" FontSize="14" FontWeight="SemiBold" Margin="0 0 0 5"/>
                <lvc:CartesianChart Grid.Row="1" Series="{Binding AgeTrendSeries}">
                    <lvc:CartesianChart.AxisX>
                        <lvc:Axis Title="年龄组" Labels="{Binding AgeGroupLabels}"/>
                    </lvc:CartesianChart.AxisX>
                    <lvc:CartesianChart.AxisY>
                        <lvc:Axis Title="人口占比(%)"/>
                    </lvc:CartesianChart.AxisY>
                </lvc:CartesianChart>
            </Grid>

            <!-- 收入分布柱状图 -->
            <Grid Grid.Column="2" Margin="10 0 0 0">
                <Grid.RowDefinitions>
                    <RowDefinition Height="Auto"/>
                    <RowDefinition Height="*"/>
                </Grid.RowDefinitions>
                <TextBlock Text="收入分布" FontSize="14" FontWeight="SemiBold" Margin="0 0 0 5"/>
                <lvc:CartesianChart Grid.Row="1" Series="{Binding IncomeSeries}">
                    <lvc:CartesianChart.AxisX>
                        <lvc:Axis Title="收入区间(USD)" Labels="{Binding IncomeRangeLabels}"/>
                    </lvc:CartesianChart.AxisX>
                    <lvc:CartesianChart.AxisY>
                        <lvc:Axis Title="人口数(百万)"/>
                    </lvc:CartesianChart.AxisY>
                </lvc:CartesianChart>
            </Grid>
        </Grid>

        <DataGrid Grid.Row="3" ItemsSource="{Binding PagedCityData}" AutoGenerateColumns="False"
                CanUserAddRows="False" CanUserDeleteRows="False"
                FontSize="30">
            <DataGrid.Resources>
                <Style TargetType="{x:Type DataGridTextColumn}">
                    <Setter Property="Width" Value="*"/>
                </Style>
            </DataGrid.Resources>
            <DataGrid.Columns>
                <DataGridTextColumn Header="城市名" Binding="{Binding CityName}"
                                  Visibility="{Binding ShowCityName, Converter={StaticResource BoolToVis}}"/>
                <DataGridTextColumn Header="人口" Binding="{Binding Population, StringFormat=N0}"
                                  Visibility="{Binding ShowPopulation, Converter={StaticResource BoolToVis}}"/>
                <DataGridTextColumn Header="人均收入(USD)" Binding="{Binding PerCapitaIncome, StringFormat=C2}"
                                  Visibility="{Binding ShowPerCapitaIncome, Converter={StaticResource BoolToVis}}"/>
                <DataGridTextColumn Header="面积(km²)" Binding="{Binding Area, StringFormat=N1}"
                                  Visibility="{Binding ShowArea, Converter={StaticResource BoolToVis}}"/>
                <DataGridTextColumn Header="GDP(亿美元)" Binding="{Binding GDP, StringFormat=N1}"
                                  Visibility="{Binding ShowGDP, Converter={StaticResource BoolToVis}}"/>
                <DataGridTextColumn Header="科研开支(亿USD)" Binding="{Binding RDSpending, StringFormat=N1}"
                                  Visibility="{Binding ShowRDSpending, Converter={StaticResource BoolToVis}}"/>
            </DataGrid.Columns>
        </DataGrid>
    </Grid>
</UserControl>

using LiveCharts;
using LiveCharts.Wpf;
using Prism.Commands;
using Prism.Mvvm;
using Prism.Regions;
using Shared.Models;
using Shared.Services;
using System;
using System.Collections.Generic;
using System.Linq;
using System.Text;
using System.Threading.Tasks;
using System.Windows.Input;

namespace AustraliaModule
{
    public class AustraliaViewModel : BindableBase, INavigationAware
    {
        #region 依赖注入&核心字段
        private readonly MockDataService _mockDataService;
        private CountryStatsModel _countryData = new();
        private List<CityStatsModel> _allCityData = new();
        private List<CityStatsModel> _pagedCityData = new();

        // 分页参数
        private int _currentPage = 1;
        private int _pageSize = 5;
        private int _totalPages;

        // 列显隐控制
        private bool _showCityName = true;
        private bool _showPopulation = true;
        private bool _showPerCapitaIncome = true;
        private bool _showArea = true;
        private bool _showGDP = true;
        private bool _showRDSpending = true;

        // 图表数据
        private SeriesCollection _demographicSeries = new();
        private SeriesCollection _ageTrendSeries = new();
        private SeriesCollection _incomeSeries = new();
        private List<string> _ageGroupLabels = new();
        private List<string> _incomeRangeLabels = new();
        #endregion

        #region 绑定属性
        public CountryStatsModel CountryData
        {
            get => _countryData;
            set => SetProperty(ref _countryData, value);
        }

        public List<CityStatsModel> PagedCityData
        {
            get => _pagedCityData;
            set => SetProperty(ref _pagedCityData, value);
        }

        // 分页属性
        public int CurrentPage
        {
            get => _currentPage;
            set
            {
                if (SetProperty(ref _currentPage, value))
                {
                    UpdatePagedData();
                    RaisePropertyChanged(nameof(CanGoPrevious));
                    RaisePropertyChanged(nameof(CanGoNext));
                }
            }
        }

        public int TotalPages
        {
            get => _totalPages;
            set => SetProperty(ref _totalPages, value);
        }

        public bool CanGoPrevious => CurrentPage > 1;
        public bool CanGoNext => CurrentPage < TotalPages;

        // 列显隐属性
        public bool ShowCityName
        {
            get => _showCityName;
            set => SetProperty(ref _showCityName, value);
        }

        public bool ShowPopulation
        {
            get => _showPopulation;
            set => SetProperty(ref _showPopulation, value);
        }

        public bool ShowPerCapitaIncome
        {
            get => _showPerCapitaIncome;
            set => SetProperty(ref _showPerCapitaIncome, value);
        }

        public bool ShowArea
        {
            get => _showArea;
            set => SetProperty(ref _showArea, value);
        }

        public bool ShowGDP
        {
            get => _showGDP;
            set => SetProperty(ref _showGDP, value);
        }

        public bool ShowRDSpending
        {
            get => _showRDSpending;
            set => SetProperty(ref _showRDSpending, value);
        }

        // 图表绑定属性
        public SeriesCollection DemographicSeries
        {
            get => _demographicSeries;
            set => SetProperty(ref _demographicSeries, value);
        }

        public SeriesCollection AgeTrendSeries
        {
            get => _ageTrendSeries;
            set => SetProperty(ref _ageTrendSeries, value);
        }

        public SeriesCollection IncomeSeries
        {
            get => _incomeSeries;
            set => SetProperty(ref _incomeSeries, value);
        }

        public List<string> AgeGroupLabels
        {
            get => _ageGroupLabels;
            set => SetProperty(ref _ageGroupLabels, value);
        }

        public List<string> IncomeRangeLabels
        {
            get => _incomeRangeLabels;
            set => SetProperty(ref _incomeRangeLabels, value);
        }

        // 分页命令
        public ICommand PreviousPageCommand => new DelegateCommand(() => CurrentPage--);
        public ICommand NextPageCommand => new DelegateCommand(() => CurrentPage++);
        #endregion

        public AustraliaViewModel(MockDataService mockDataService)
        {
            _mockDataService = mockDataService;
        }

        #region 导航&数据加载
        public void OnNavigatedTo(NavigationContext navigationContext)
        {
            CountryData = _mockDataService.GetCountryData("Australia");
            _allCityData = CountryData.CityData;
            PagedCityData = _allCityData.Take(10).ToList();
            // 初始化分页
            TotalPages = (int)Math.Ceiling((double)_allCityData.Count / _pageSize);
            CurrentPage = 1;

            // 初始化图表
            InitCharts();
        }

        public bool IsNavigationTarget(NavigationContext navigationContext) => true;
        public void OnNavigatedFrom(NavigationContext navigationContext) { }
        #endregion

        #region 私有方法
        // 初始化图表数据
        private void InitCharts()
        {
            // 1. 人种构成饼图
            DemographicSeries = new SeriesCollection();
            foreach (var item in CountryData.DemographicData)
            {
                DemographicSeries.Add(new PieSeries
                {
                    Title = item.Ethnicity,
                    Values = new ChartValues<double> { item.Percentage },
                    DataLabels = true
                });
            }

            // 2. 年龄趋势折线图
            AgeTrendSeries = new SeriesCollection
            {
                new LineSeries
                {
                    Title = "年龄占比",
                    Values = new ChartValues<double>(CountryData.AgeTrendData.Select(x => x.PopulationRatio)),
                    LineSmoothness = 1, // 平滑曲线
                    PointGeometry = DefaultGeometries.Circle,
                    PointGeometrySize = 5
                }
            };
            AgeGroupLabels = CountryData.AgeTrendData.Select(x => x.AgeGroup.ToString()).ToList();

            // 3. 收入分布柱状图
            IncomeSeries = new SeriesCollection
            {
                new ColumnSeries
                {
                    Title= "人口数",
                    Values= new ChartValues<double>(CountryData.IncomeData.Select(x => x.PopulationCount))
                }
            };
            IncomeRangeLabels = CountryData.IncomeData.Select(x => x.IncomeRange).ToList();
        }

        // 更新分页数据
        private void UpdatePagedData()
        {
            PagedCityData = _allCityData
                .Skip((CurrentPage - 1) * _pageSize)
                .Take(_pageSize)
                .ToList();
        }

        #endregion
    }
}
//CanadaModule
using Prism.Ioc;
using Prism.Modularity;
using System;
using System.Collections.Generic;
using System.Linq;
using System.Text;
using System.Threading.Tasks;

namespace CanadaModule
{
    public class CanadaModule : IModule
    {
        public void OnInitialized(IContainerProvider containerProvider)
        {

        }

        public void RegisterTypes(IContainerRegistry containerRegistry)
        {
            containerRegistry.RegisterForNavigation<CanadaView>();
        }
    }
}


<UserControl x:Class="CanadaModule.CanadaView"
             xmlns="http://schemas.microsoft.com/winfx/2006/xaml/presentation"
             xmlns:x="http://schemas.microsoft.com/winfx/2006/xaml"
             xmlns:mc="http://schemas.openxmlformats.org/markup-compatibility/2006"
             xmlns:d="http://schemas.microsoft.com/expression/blend/2008"
             xmlns:local="clr-namespace:CanadaModule"
             xmlns:prism="http://prismlibrary.com/"
             xmlns:lvc="clr-namespace:LiveCharts.Wpf;assembly=LiveCharts.Wpf"
             xmlns:shared="clr-namespace:Shared.Models;assembly=Shared"
             prism:ViewModelLocator.AutoWireViewModel="True">
    <UserControl.Resources>
        <!-- 转换器:布尔值转可见性 -->
        <BooleanToVisibilityConverter x:Key="BoolToVis"/>
    </UserControl.Resources>

    <Grid Margin="10">
        <Grid.RowDefinitions>
            <RowDefinition Height="Auto"/>
            <RowDefinition Height="*"/>
            <RowDefinition Height="Auto"/>
            <RowDefinition Height="*"/>
            <RowDefinition Height="Auto"/>
        </Grid.RowDefinitions>

        <!-- 1. 页面标题 -->
        <TextBlock Grid.Row="0" Text="{Binding CountryData.CountryName}"
                 FontSize="20" FontWeight="Bold" Margin="0 0 0 10"/>

        <!-- 2. 图表区域(饼图+折线图+柱状图) -->
        <Grid Grid.Row="1" Margin="0 10 0 10">
            <Grid.ColumnDefinitions>
                <ColumnDefinition Width="1*"/>
                <ColumnDefinition Width="1*"/>
                <ColumnDefinition Width="1*"/>
            </Grid.ColumnDefinitions>

            <!-- 人种构成饼图 -->
            <Grid Grid.Column="0" Margin="0 0 10 0">
                <Grid.RowDefinitions>
                    <RowDefinition Height="Auto"/>
                    <RowDefinition Height="*"/>
                </Grid.RowDefinitions>
                <TextBlock Text="人种构成" FontSize="14" FontWeight="SemiBold" Margin="0 0 0 5"/>
                <lvc:PieChart Grid.Row="1" Series="{Binding DemographicSeries}"
                            LegendLocation="Bottom"/>
            </Grid>

            <!-- 年龄趋势折线图 -->
            <Grid Grid.Column="1" Margin="5 0 5 0">
                <Grid.RowDefinitions>
                    <RowDefinition Height="Auto"/>
                    <RowDefinition Height="*"/>
                </Grid.RowDefinitions>
                <TextBlock Text="年龄分布趋势" FontSize="14" FontWeight="SemiBold" Margin="0 0 0 5"/>
                <lvc:CartesianChart Grid.Row="1" Series="{Binding AgeTrendSeries}">
                    <lvc:CartesianChart.AxisX>
                        <lvc:Axis Title="年龄组" Labels="{Binding AgeGroupLabels}"/>
                    </lvc:CartesianChart.AxisX>
                    <lvc:CartesianChart.AxisY>
                        <lvc:Axis Title="人口占比(%)"/>
                    </lvc:CartesianChart.AxisY>
                </lvc:CartesianChart>
            </Grid>

            <!-- 收入分布柱状图 -->
            <Grid Grid.Column="2" Margin="10 0 0 0">
                <Grid.RowDefinitions>
                    <RowDefinition Height="Auto"/>
                    <RowDefinition Height="*"/>
                </Grid.RowDefinitions>
                <TextBlock Text="收入分布" FontSize="14" FontWeight="SemiBold" Margin="0 0 0 5"/>
                <lvc:CartesianChart Grid.Row="1" Series="{Binding IncomeSeries}">
                    <lvc:CartesianChart.AxisX>
                        <lvc:Axis Title="收入区间(USD)" Labels="{Binding IncomeRangeLabels}"/>
                    </lvc:CartesianChart.AxisX>
                    <lvc:CartesianChart.AxisY>
                        <lvc:Axis Title="人口数(百万)"/>
                    </lvc:CartesianChart.AxisY>
                </lvc:CartesianChart>
            </Grid>
        </Grid>

        <DataGrid Grid.Row="3" ItemsSource="{Binding PagedCityData}" AutoGenerateColumns="False"
                CanUserAddRows="False" CanUserDeleteRows="False"
                FontSize="30">
            <DataGrid.Resources>
                <Style TargetType="{x:Type DataGridTextColumn}">
                    <Setter Property="Width" Value="*"/>
                </Style>
            </DataGrid.Resources>
            <DataGrid.Columns>
                <DataGridTextColumn Header="城市名" Binding="{Binding CityName}"
                                  Visibility="{Binding ShowCityName, Converter={StaticResource BoolToVis}}"/>
                <DataGridTextColumn Header="人口" Binding="{Binding Population, StringFormat=N0}"
                                  Visibility="{Binding ShowPopulation, Converter={StaticResource BoolToVis}}"/>
                <DataGridTextColumn Header="人均收入(USD)" Binding="{Binding PerCapitaIncome, StringFormat=C2}"
                                  Visibility="{Binding ShowPerCapitaIncome, Converter={StaticResource BoolToVis}}"/>
                <DataGridTextColumn Header="面积(km²)" Binding="{Binding Area, StringFormat=N1}"
                                  Visibility="{Binding ShowArea, Converter={StaticResource BoolToVis}}"/>
                <DataGridTextColumn Header="GDP(亿美元)" Binding="{Binding GDP, StringFormat=N1}"
                                  Visibility="{Binding ShowGDP, Converter={StaticResource BoolToVis}}"/>
                <DataGridTextColumn Header="科研开支(亿USD)" Binding="{Binding RDSpending, StringFormat=N1}"
                                  Visibility="{Binding ShowRDSpending, Converter={StaticResource BoolToVis}}"/>
            </DataGrid.Columns>
        </DataGrid>
    </Grid>
</UserControl>

using LiveCharts;
using LiveCharts.Wpf;
using Prism.Commands;
using Prism.Mvvm;
using Prism.Regions;
using Shared.Models;
using Shared.Services;
using System;
using System.Collections.Generic;
using System.Linq;
using System.Text;
using System.Threading.Tasks;
using System.Windows.Input;

namespace CanadaModule
{
    public class CanadaViewModel : BindableBase, INavigationAware
    {
        #region 依赖注入&核心字段
        private readonly MockDataService _mockDataService;
        private CountryStatsModel _countryData = new();
        private List<CityStatsModel> _allCityData = new();
        private List<CityStatsModel> _pagedCityData = new();

        // 分页参数
        private int _currentPage = 1;
        private int _pageSize = 5;
        private int _totalPages;

        // 列显隐控制
        private bool _showCityName = true;
        private bool _showPopulation = true;
        private bool _showPerCapitaIncome = true;
        private bool _showArea = true;
        private bool _showGDP = true;
        private bool _showRDSpending = true;

        // 图表数据
        private SeriesCollection _demographicSeries = new();
        private SeriesCollection _ageTrendSeries = new();
        private SeriesCollection _incomeSeries = new();
        private List<string> _ageGroupLabels = new();
        private List<string> _incomeRangeLabels = new();
        #endregion

        #region 绑定属性
        public CountryStatsModel CountryData
        {
            get => _countryData;
            set => SetProperty(ref _countryData, value);
        }

        public List<CityStatsModel> PagedCityData
        {
            get => _pagedCityData;
            set => SetProperty(ref _pagedCityData, value);
        }

        // 分页属性
        public int CurrentPage
        {
            get => _currentPage;
            set
            {
                if (SetProperty(ref _currentPage, value))
                {
                    UpdatePagedData();
                    RaisePropertyChanged(nameof(CanGoPrevious));
                    RaisePropertyChanged(nameof(CanGoNext));
                }
            }
        }

        public int TotalPages
        {
            get => _totalPages;
            set => SetProperty(ref _totalPages, value);
        }

        public bool CanGoPrevious => CurrentPage > 1;
        public bool CanGoNext => CurrentPage < TotalPages;

        // 列显隐属性
        public bool ShowCityName
        {
            get => _showCityName;
            set => SetProperty(ref _showCityName, value);
        }

        public bool ShowPopulation
        {
            get => _showPopulation;
            set => SetProperty(ref _showPopulation, value);
        }

        public bool ShowPerCapitaIncome
        {
            get => _showPerCapitaIncome;
            set => SetProperty(ref _showPerCapitaIncome, value);
        }

        public bool ShowArea
        {
            get => _showArea;
            set => SetProperty(ref _showArea, value);
        }

        public bool ShowGDP
        {
            get => _showGDP;
            set => SetProperty(ref _showGDP, value);
        }

        public bool ShowRDSpending
        {
            get => _showRDSpending;
            set => SetProperty(ref _showRDSpending, value);
        }

        // 图表绑定属性
        public SeriesCollection DemographicSeries
        {
            get => _demographicSeries;
            set => SetProperty(ref _demographicSeries, value);
        }

        public SeriesCollection AgeTrendSeries
        {
            get => _ageTrendSeries;
            set => SetProperty(ref _ageTrendSeries, value);
        }

        public SeriesCollection IncomeSeries
        {
            get => _incomeSeries;
            set => SetProperty(ref _incomeSeries, value);
        }

        public List<string> AgeGroupLabels
        {
            get => _ageGroupLabels;
            set => SetProperty(ref _ageGroupLabels, value);
        }

        public List<string> IncomeRangeLabels
        {
            get => _incomeRangeLabels;
            set => SetProperty(ref _incomeRangeLabels, value);
        }

        // 分页命令
        public ICommand PreviousPageCommand => new DelegateCommand(() => CurrentPage--);
        public ICommand NextPageCommand => new DelegateCommand(() => CurrentPage++);
        #endregion

        public CanadaViewModel(MockDataService mockDataService)
        {
            _mockDataService = mockDataService;
        }

        #region 导航&数据加载
        public void OnNavigatedTo(NavigationContext navigationContext)
        {
            CountryData = _mockDataService.GetCountryData("Canada");
            _allCityData = CountryData.CityData;
            PagedCityData = _allCityData.Take(10).ToList();
            // 初始化分页
            TotalPages = (int)Math.Ceiling((double)_allCityData.Count / _pageSize);
            CurrentPage = 1;

            // 初始化图表
            InitCharts();
        }

        public bool IsNavigationTarget(NavigationContext navigationContext) => true;
        public void OnNavigatedFrom(NavigationContext navigationContext) { }
        #endregion

        #region 私有方法
        // 初始化图表数据
        private void InitCharts()
        {
            // 1. 人种构成饼图
            DemographicSeries = new SeriesCollection();
            foreach (var item in CountryData.DemographicData)
            {
                DemographicSeries.Add(new PieSeries
                {
                    Title = item.Ethnicity,
                    Values = new ChartValues<double> { item.Percentage },
                    DataLabels = true
                });
            }

            // 2. 年龄趋势折线图
            AgeTrendSeries = new SeriesCollection
            {
                new LineSeries
                {
                    Title = "年龄占比",
                    Values = new ChartValues<double>(CountryData.AgeTrendData.Select(x => x.PopulationRatio)),
                    LineSmoothness = 1, // 平滑曲线
                    PointGeometry = DefaultGeometries.Circle,
                    PointGeometrySize = 5
                }
            };
            AgeGroupLabels = CountryData.AgeTrendData.Select(x => x.AgeGroup.ToString()).ToList();

            // 3. 收入分布柱状图
            IncomeSeries = new SeriesCollection
            {
                new ColumnSeries
                {
                    Title= "人口数",
                    Values= new ChartValues<double>(CountryData.IncomeData.Select(x => x.PopulationCount))
                }
            };
            IncomeRangeLabels = CountryData.IncomeData.Select(x => x.IncomeRange).ToList();
        }

        // 更新分页数据
        private void UpdatePagedData()
        {
            PagedCityData = _allCityData
                .Skip((CurrentPage - 1) * _pageSize)
                .Take(_pageSize)
                .ToList();
        }

        #endregion
    }
}
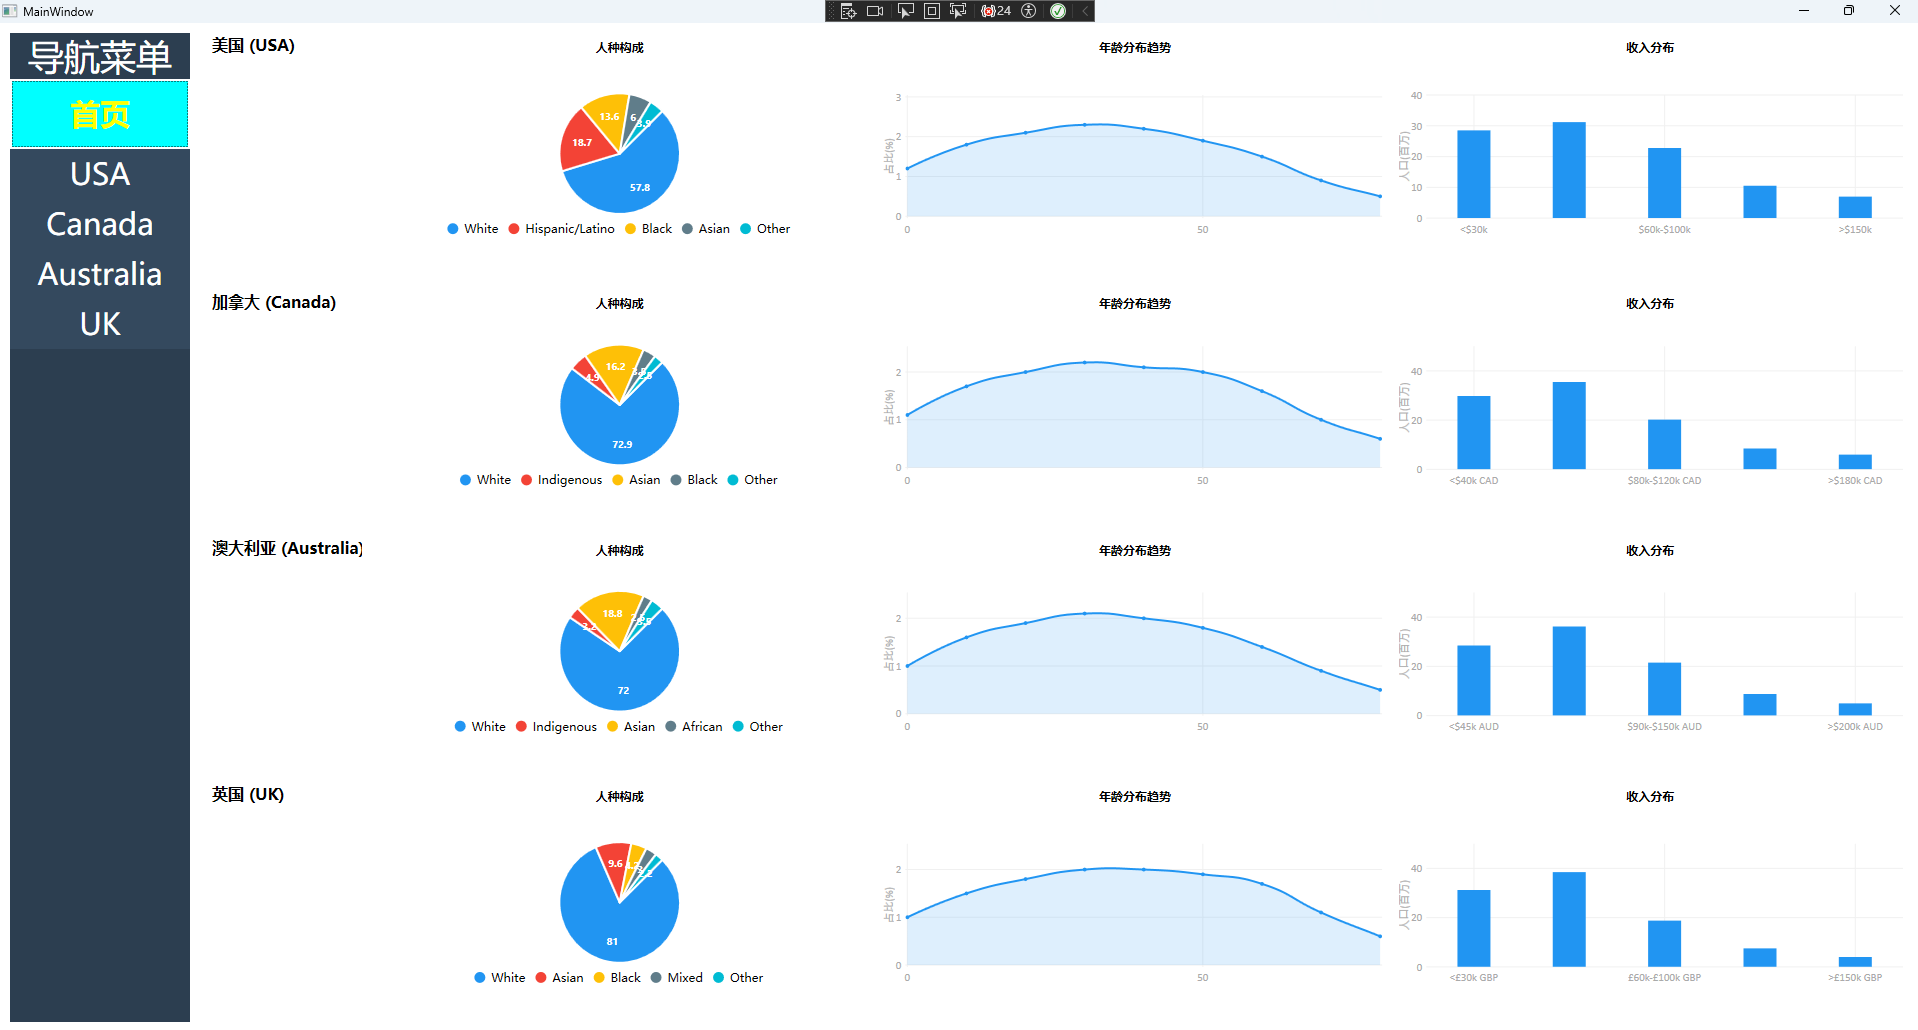
//HomeModule using Prism.Ioc; using Prism.Modularity; using Prism.Regions; using System; using System.Collections.Generic; using System.Linq; using System.Text; using System.Threading.Tasks; namespace HomeModule { public class HomeModule : IModule { public void OnInitialized(IContainerProvider containerProvider) { var regionManager = containerProvider.Resolve<IRegionManager>(); regionManager.RequestNavigate("ContentRegion", "HomeView"); } public void RegisterTypes(IContainerRegistry containerRegistry) { containerRegistry.RegisterForNavigation<HomeView>(); } } } <UserControl x:Class="HomeModule.HomeView" xmlns="http://schemas.microsoft.com/winfx/2006/xaml/presentation" xmlns:x="http://schemas.microsoft.com/winfx/2006/xaml" xmlns:mc="http://schemas.openxmlformats.org/markup-compatibility/2006" xmlns:d="http://schemas.microsoft.com/expression/blend/2008" xmlns:local="clr-namespace:HomeModule" xmlns:prism="http://prismlibrary.com/" xmlns:lvc="clr-namespace:LiveCharts.Wpf;assembly=LiveCharts.Wpf" prism:ViewModelLocator.AutoWireViewModel="True" mc:Ignorable="d" d:DesignHeight="800" d:DesignWidth="1200"> <Grid Margin="10"> <!-- 整体布局:4行,每行对应一个国家 --> <Grid.RowDefinitions> <RowDefinition Height="*"/> <RowDefinition Height="*"/> <RowDefinition Height="*"/> <RowDefinition Height="*"/> </Grid.RowDefinitions> <Grid.Resources> <!-- 通用样式:行标题 --> <Style x:Key="RowTitleStyle" TargetType="TextBlock"> <Setter Property="FontSize" Value="16"/> <Setter Property="FontWeight" Value="Bold"/> <Setter Property="Margin" Value="0 0 0 10"/> <Setter Property="VerticalAlignment" Value="Top"/> </Style> <!-- 通用样式:图表容器 --> <Style x:Key="ChartContainerStyle" TargetType="Grid"> <Setter Property="Margin" Value="5"/> </Style> <!-- 通用样式:图表标题 --> <Style x:Key="ChartTitleStyle" TargetType="TextBlock"> <Setter Property="FontSize" Value="12"/> <Setter Property="FontWeight" Value="SemiBold"/> <Setter Property="Margin" Value="0 0 0 5"/> <Setter Property="HorizontalAlignment" Value="Center"/> </Style> </Grid.Resources> <!-- 第一行:美国数据 --> <Grid Grid.Row="0" Margin="0 0 0 10"> <Grid.ColumnDefinitions> <ColumnDefinition Width="150"/> <ColumnDefinition Width="1*"/> <ColumnDefinition Width="1*"/> <ColumnDefinition Width="1*"/> </Grid.ColumnDefinitions> <!-- 行标题 --> <TextBlock Grid.Column="0" Text="美国 (USA)" Style="{StaticResource RowTitleStyle}"/> <!-- 人口饼图 --> <Grid Grid.Column="1" Style="{StaticResource ChartContainerStyle}"> <Grid.RowDefinitions> <RowDefinition Height="Auto"/> <RowDefinition Height="*"/> </Grid.RowDefinitions> <TextBlock Grid.Row="0" Text="人种构成" Style="{StaticResource ChartTitleStyle}"/> <lvc:PieChart Grid.Row="1" Series="{Binding USADemographicSeries}" LegendLocation="Bottom" Height="150"/> </Grid> <!-- 年龄趋势图 --> <Grid Grid.Column="2" Style="{StaticResource ChartContainerStyle}"> <Grid.RowDefinitions> <RowDefinition Height="Auto"/> <RowDefinition Height="*"/> </Grid.RowDefinitions> <TextBlock Grid.Row="0" Text="年龄分布趋势" Style="{StaticResource ChartTitleStyle}"/> <lvc:CartesianChart Grid.Row="1" Series="{Binding USAAgeTrendSeries}" Height="150"> <lvc:CartesianChart.AxisX> <lvc:Axis Labels="{Binding USAAgeGroupLabels}"/> </lvc:CartesianChart.AxisX> <lvc:CartesianChart.AxisY> <lvc:Axis Title="占比(%)"/> </lvc:CartesianChart.AxisY> </lvc:CartesianChart> </Grid> <!-- 收入柱状图 --> <Grid Grid.Column="3" Style="{StaticResource ChartContainerStyle}"> <Grid.RowDefinitions> <RowDefinition Height="Auto"/> <RowDefinition Height="*"/> </Grid.RowDefinitions> <TextBlock Grid.Row="0" Text="收入分布" Style="{StaticResource ChartTitleStyle}"/> <lvc:CartesianChart Grid.Row="1" Series="{Binding USAIncomeSeries}" Height="150"> <lvc:CartesianChart.AxisX> <lvc:Axis Labels="{Binding USAIncomeRangeLabels}"/> </lvc:CartesianChart.AxisX> <lvc:CartesianChart.AxisY> <lvc:Axis Title="人口(百万)"/> </lvc:CartesianChart.AxisY> </lvc:CartesianChart> </Grid> </Grid> <!-- 第二行:加拿大数据 --> <Grid Grid.Row="1" Margin="0 10 0 10"> <Grid.ColumnDefinitions> <ColumnDefinition Width="150"/> <ColumnDefinition Width="1*"/> <ColumnDefinition Width="1*"/> <ColumnDefinition Width="1*"/> </Grid.ColumnDefinitions> <!-- 行标题 --> <TextBlock Grid.Column="0" Text="加拿大 (Canada)" Style="{StaticResource RowTitleStyle}"/> <!-- 人口饼图 --> <Grid Grid.Column="1" Style="{StaticResource ChartContainerStyle}"> <Grid.RowDefinitions> <RowDefinition Height="Auto"/> <RowDefinition Height="*"/> </Grid.RowDefinitions> <TextBlock Grid.Row="0" Text="人种构成" Style="{StaticResource ChartTitleStyle}"/> <lvc:PieChart Grid.Row="1" Series="{Binding CanadaDemographicSeries}" LegendLocation="Bottom" Height="150"/> </Grid> <!-- 年龄趋势图 --> <Grid Grid.Column="2" Style="{StaticResource ChartContainerStyle}"> <Grid.RowDefinitions> <RowDefinition Height="Auto"/> <RowDefinition Height="*"/> </Grid.RowDefinitions> <TextBlock Grid.Row="0" Text="年龄分布趋势" Style="{StaticResource ChartTitleStyle}"/> <lvc:CartesianChart Grid.Row="1" Series="{Binding CanadaAgeTrendSeries}" Height="150"> <lvc:CartesianChart.AxisX> <lvc:Axis Labels="{Binding CanadaAgeGroupLabels}"/> </lvc:CartesianChart.AxisX> <lvc:CartesianChart.AxisY> <lvc:Axis Title="占比(%)"/> </lvc:CartesianChart.AxisY> </lvc:CartesianChart> </Grid> <!-- 收入柱状图 --> <Grid Grid.Column="3" Style="{StaticResource ChartContainerStyle}"> <Grid.RowDefinitions> <RowDefinition Height="Auto"/> <RowDefinition Height="*"/> </Grid.RowDefinitions> <TextBlock Grid.Row="0" Text="收入分布" Style="{StaticResource ChartTitleStyle}"/> <lvc:CartesianChart Grid.Row="1" Series="{Binding CanadaIncomeSeries}" Height="150"> <lvc:CartesianChart.AxisX> <lvc:Axis Labels="{Binding CanadaIncomeRangeLabels}"/> </lvc:CartesianChart.AxisX> <lvc:CartesianChart.AxisY> <lvc:Axis Title="人口(百万)"/> </lvc:CartesianChart.AxisY> </lvc:CartesianChart> </Grid> </Grid> <!-- 第三行:澳大利亚数据 --> <Grid Grid.Row="2" Margin="0 10 0 10"> <Grid.ColumnDefinitions> <ColumnDefinition Width="150"/> <ColumnDefinition Width="1*"/> <ColumnDefinition Width="1*"/> <ColumnDefinition Width="1*"/> </Grid.ColumnDefinitions> <!-- 行标题 --> <TextBlock Grid.Column="0" Text="澳大利亚 (Australia)" Style="{StaticResource RowTitleStyle}"/> <!-- 人口饼图 --> <Grid Grid.Column="1" Style="{StaticResource ChartContainerStyle}"> <Grid.RowDefinitions> <RowDefinition Height="Auto"/> <RowDefinition Height="*"/> </Grid.RowDefinitions> <TextBlock Grid.Row="0" Text="人种构成" Style="{StaticResource ChartTitleStyle}"/> <lvc:PieChart Grid.Row="1" Series="{Binding AustraliaDemographicSeries}" LegendLocation="Bottom" Height="150"/> </Grid> <!-- 年龄趋势图 --> <Grid Grid.Column="2" Style="{StaticResource ChartContainerStyle}"> <Grid.RowDefinitions> <RowDefinition Height="Auto"/> <RowDefinition Height="*"/> </Grid.RowDefinitions> <TextBlock Grid.Row="0" Text="年龄分布趋势" Style="{StaticResource ChartTitleStyle}"/> <lvc:CartesianChart Grid.Row="1" Series="{Binding AustraliaAgeTrendSeries}" Height="150"> <lvc:CartesianChart.AxisX> <lvc:Axis Labels="{Binding AustraliaAgeGroupLabels}"/> </lvc:CartesianChart.AxisX> <lvc:CartesianChart.AxisY> <lvc:Axis Title="占比(%)"/> </lvc:CartesianChart.AxisY> </lvc:CartesianChart> </Grid> <!-- 收入柱状图 --> <Grid Grid.Column="3" Style="{StaticResource ChartContainerStyle}"> <Grid.RowDefinitions> <RowDefinition Height="Auto"/> <RowDefinition Height="*"/> </Grid.RowDefinitions> <TextBlock Grid.Row="0" Text="收入分布" Style="{StaticResource ChartTitleStyle}"/> <lvc:CartesianChart Grid.Row="1" Series="{Binding AustraliaIncomeSeries}" Height="150"> <lvc:CartesianChart.AxisX> <lvc:Axis Labels="{Binding AustraliaIncomeRangeLabels}"/> </lvc:CartesianChart.AxisX> <lvc:CartesianChart.AxisY> <lvc:Axis Title="人口(百万)"/> </lvc:CartesianChart.AxisY> </lvc:CartesianChart> </Grid> </Grid> <!-- 第四行:英国数据 --> <Grid Grid.Row="3" Margin="0 10 0 0"> <Grid.ColumnDefinitions> <ColumnDefinition Width="150"/> <ColumnDefinition Width="1*"/> <ColumnDefinition Width="1*"/> <ColumnDefinition Width="1*"/> </Grid.ColumnDefinitions> <!-- 行标题 --> <TextBlock Grid.Column="0" Text="英国 (UK)" Style="{StaticResource RowTitleStyle}"/> <!-- 人口饼图 --> <Grid Grid.Column="1" Style="{StaticResource ChartContainerStyle}"> <Grid.RowDefinitions> <RowDefinition Height="Auto"/> <RowDefinition Height="*"/> </Grid.RowDefinitions> <TextBlock Grid.Row="0" Text="人种构成" Style="{StaticResource ChartTitleStyle}"/> <lvc:PieChart Grid.Row="1" Series="{Binding UKDemographicSeries}" LegendLocation="Bottom" Height="150"/> </Grid> <!-- 年龄趋势图 --> <Grid Grid.Column="2" Style="{StaticResource ChartContainerStyle}"> <Grid.RowDefinitions> <RowDefinition Height="Auto"/> <RowDefinition Height="*"/> </Grid.RowDefinitions> <TextBlock Grid.Row="0" Text="年龄分布趋势" Style="{StaticResource ChartTitleStyle}"/> <lvc:CartesianChart Grid.Row="1" Series="{Binding UKAgeTrendSeries}" Height="150"> <lvc:CartesianChart.AxisX> <lvc:Axis Labels="{Binding UKAgeGroupLabels}"/> </lvc:CartesianChart.AxisX> <lvc:CartesianChart.AxisY> <lvc:Axis Title="占比(%)"/> </lvc:CartesianChart.AxisY> </lvc:CartesianChart> </Grid> <!-- 收入柱状图 --> <Grid Grid.Column="3" Style="{StaticResource ChartContainerStyle}"> <Grid.RowDefinitions> <RowDefinition Height="Auto"/> <RowDefinition Height="*"/> </Grid.RowDefinitions> <TextBlock Grid.Row="0" Text="收入分布" Style="{StaticResource ChartTitleStyle}"/> <lvc:CartesianChart Grid.Row="1" Series="{Binding UKIncomeSeries}" Height="150"> <lvc:CartesianChart.AxisX> <lvc:Axis Labels="{Binding UKIncomeRangeLabels}"/> </lvc:CartesianChart.AxisX> <lvc:CartesianChart.AxisY> <lvc:Axis Title="人口(百万)"/> </lvc:CartesianChart.AxisY> </lvc:CartesianChart> </Grid> </Grid> </Grid> </UserControl> using LiveCharts; using LiveCharts.Wpf; using Prism.Mvvm; using Prism.Regions; using Shared.Models; using Shared.Services; using System; using System.Collections.Generic; using System.Linq; namespace HomeModule { public class HomeViewModel : BindableBase, INavigationAware { #region 依赖注入&核心数据 private readonly MockDataService _mockDataService; // 四个国家的完整数据 private CountryStatsModel _usaData; private CountryStatsModel _canadaData; private CountryStatsModel _australiaData; private CountryStatsModel _ukData; #endregion #region 图表属性(添加私有字段+显式PropertyChanged通知) // 美国 private SeriesCollection _usADemographicSeries = new(); public SeriesCollection USADemographicSeries { get => _usADemographicSeries; set => SetProperty(ref _usADemographicSeries, value); } private SeriesCollection _usAAgeTrendSeries = new(); public SeriesCollection USAAgeTrendSeries { get => _usAAgeTrendSeries; set => SetProperty(ref _usAAgeTrendSeries, value); } private SeriesCollection _usAIncomeSeries = new(); public SeriesCollection USAIncomeSeries { get => _usAIncomeSeries; set => SetProperty(ref _usAIncomeSeries, value); } private List<string> _usAAgeGroupLabels = new(); public List<string> USAAgeGroupLabels { get => _usAAgeGroupLabels; set => SetProperty(ref _usAAgeGroupLabels, value); } private List<string> _usAIncomeRangeLabels = new(); public List<string> USAIncomeRangeLabels { get => _usAIncomeRangeLabels; set => SetProperty(ref _usAIncomeRangeLabels, value); } // 加拿大 private SeriesCollection _canadaDemographicSeries = new(); public SeriesCollection CanadaDemographicSeries { get => _canadaDemographicSeries; set => SetProperty(ref _canadaDemographicSeries, value); } private SeriesCollection _canadaAgeTrendSeries = new(); public SeriesCollection CanadaAgeTrendSeries { get => _canadaAgeTrendSeries; set => SetProperty(ref _canadaAgeTrendSeries, value); } private SeriesCollection _canadaIncomeSeries = new(); public SeriesCollection CanadaIncomeSeries { get => _canadaIncomeSeries; set => SetProperty(ref _canadaIncomeSeries, value); } private List<string> _canadaAgeGroupLabels = new(); public List<string> CanadaAgeGroupLabels { get => _canadaAgeGroupLabels; set => SetProperty(ref _canadaAgeGroupLabels, value); } private List<string> _canadaIncomeRangeLabels = new(); public List<string> CanadaIncomeRangeLabels { get => _canadaIncomeRangeLabels; set => SetProperty(ref _canadaIncomeRangeLabels, value); } // 澳大利亚 private SeriesCollection _australiaDemographicSeries = new(); public SeriesCollection AustraliaDemographicSeries { get => _australiaDemographicSeries; set => SetProperty(ref _australiaDemographicSeries, value); } private SeriesCollection _australiaAgeTrendSeries = new(); public SeriesCollection AustraliaAgeTrendSeries { get => _australiaAgeTrendSeries; set => SetProperty(ref _australiaAgeTrendSeries, value); } private SeriesCollection _australiaIncomeSeries = new(); public SeriesCollection AustraliaIncomeSeries { get => _australiaIncomeSeries; set => SetProperty(ref _australiaIncomeSeries, value); } private List<string> _australiaAgeGroupLabels = new(); public List<string> AustraliaAgeGroupLabels { get => _australiaAgeGroupLabels; set => SetProperty(ref _australiaAgeGroupLabels, value); } private List<string> _australiaIncomeRangeLabels = new(); public List<string> AustraliaIncomeRangeLabels { get => _australiaIncomeRangeLabels; set => SetProperty(ref _australiaIncomeRangeLabels, value); } // 英国 private SeriesCollection _ukDemographicSeries = new(); public SeriesCollection UKDemographicSeries { get => _ukDemographicSeries; set => SetProperty(ref _ukDemographicSeries, value); } private SeriesCollection _ukAgeTrendSeries = new(); public SeriesCollection UKAgeTrendSeries { get => _ukAgeTrendSeries; set => SetProperty(ref _ukAgeTrendSeries, value); } private SeriesCollection _ukIncomeSeries = new(); public SeriesCollection UKIncomeSeries { get => _ukIncomeSeries; set => SetProperty(ref _ukIncomeSeries, value); } private List<string> _ukAgeGroupLabels = new(); public List<string> UKAgeGroupLabels { get => _ukAgeGroupLabels; set => SetProperty(ref _ukAgeGroupLabels, value); } private List<string> _ukIncomeRangeLabels = new(); public List<string> UKIncomeRangeLabels { get => _ukIncomeRangeLabels; set => SetProperty(ref _ukIncomeRangeLabels, value); } #endregion /// <summary> /// 构造函数(注入Mock数据服务) /// </summary> public HomeViewModel(MockDataService mockDataService) { _mockDataService = mockDataService; // 调试日志:确认构造函数执行 System.Diagnostics.Debug.WriteLine("✅ HomeViewModel 构造函数执行"); } #region 导航生命周期&数据加载 public void OnNavigatedTo(NavigationContext navigationContext) { try { // 调试日志:确认OnNavigatedTo执行 System.Diagnostics.Debug.WriteLine("✅ HomeViewModel OnNavigatedTo 执行"); // 1. 获取四个国家的Mock数据,并验证是否为空 _usaData = _mockDataService.GetCountryData("usa"); _canadaData = _mockDataService.GetCountryData("canada"); _australiaData = _mockDataService.GetCountryData("australia"); _ukData = _mockDataService.GetCountryData("uk"); System.Diagnostics.Debug.WriteLine($"📌 USA数据是否为空:{_usaData == null}"); System.Diagnostics.Debug.WriteLine($"📌 Canada数据是否为空:{_canadaData == null}"); System.Diagnostics.Debug.WriteLine($"📌 Australia数据是否为空:{_australiaData == null}"); System.Diagnostics.Debug.WriteLine($"📌 UK数据是否为空:{_ukData == null}"); if (_usaData == null || _canadaData == null || _australiaData == null || _ukData == null) { System.Diagnostics.Debug.WriteLine("❌ MockDataService返回空数据,请检查GetCountryData方法"); return; } // 2. 初始化所有国家的图表数据 InitUSACharts(); InitCanadaCharts(); InitAustraliaCharts(); InitUKCharts(); System.Diagnostics.Debug.WriteLine("✅ 所有图表数据初始化完成"); } catch (Exception ex) { // 捕获异常并输出,避免吞掉错误 System.Diagnostics.Debug.WriteLine($"❌ OnNavigatedTo执行异常:{ex.Message}\n{ex.StackTrace}"); } } public bool IsNavigationTarget(NavigationContext navigationContext) => true; public void OnNavigatedFrom(NavigationContext navigationContext) { } #endregion #region 图表初始化方法(按国家拆分,便于维护) /// <summary> /// 初始化美国图表数据 /// </summary> private void InitUSACharts() { // 1.人种构成饼图:显式创建SeriesCollection并逐个Add PieSeries var seriesCollection = new SeriesCollection(); foreach (var d in _usaData.DemographicData) { var pieSeries = new PieSeries { Title = d.Ethnicity, DataLabels = true, Values = new ChartValues<double> { d.Percentage } // 确保Values有数据 }; // 显式Add到SeriesCollection seriesCollection.Add(pieSeries); } // 赋值并触发属性通知 USADemographicSeries = seriesCollection; // 调试日志:确认SeriesCollection的Count System.Diagnostics.Debug.WriteLine($"📌 美国饼图SeriesCollection.Count:{USADemographicSeries.Count}"); // 2. 年龄趋势折线图 USAAgeTrendSeries = new SeriesCollection { new LineSeries { Title = "年龄占比", Values = new ChartValues<double>(_usaData.AgeTrendData.Select(x => x.PopulationRatio)), LineSmoothness = 1, // 平滑曲线 PointGeometry = DefaultGeometries.Circle, PointGeometrySize = 4 } }; USAAgeGroupLabels = _usaData.AgeTrendData.Select(x => x.AgeGroup.ToString()).ToList(); // 3. 收入分布柱状图 USAIncomeSeries = new SeriesCollection { new ColumnSeries { Title = "人口数", Values = new ChartValues<double>(_usaData.IncomeData.Select(x => x.PopulationCount)) } }; USAIncomeRangeLabels = _usaData.IncomeData.Select(x => x.IncomeRange).ToList(); System.Diagnostics.Debug.WriteLine($"✅ 美国图表数据初始化:饼图系列数={USADemographicSeries.Count},折线图数据量={USAAgeTrendSeries[0].Values.Count}"); } /// <summary> /// 初始化加拿大图表数据 /// </summary> private void InitCanadaCharts() { // 1. 人种构成饼图 var seriesCollection = new SeriesCollection(); foreach (var d in _canadaData.DemographicData) { var pieSeries = new PieSeries { Title = d.Ethnicity, DataLabels = true, Values = new ChartValues<double> { d.Percentage } // 确保Values有数据 }; // 显式Add到SeriesCollection seriesCollection.Add(pieSeries); } // 赋值并触发属性通知 CanadaDemographicSeries = seriesCollection; // 调试日志:确认SeriesCollection的Count System.Diagnostics.Debug.WriteLine($"📌 加拿大饼图SeriesCollection.Count:{CanadaDemographicSeries.Count}"); // 2. 年龄趋势折线图 CanadaAgeTrendSeries = new SeriesCollection { new LineSeries { Title = "年龄占比", Values = new ChartValues<double>(_canadaData.AgeTrendData.Select(x => x.PopulationRatio)), LineSmoothness = 1, PointGeometry = DefaultGeometries.Circle, PointGeometrySize = 4 } }; CanadaAgeGroupLabels = _canadaData.AgeTrendData.Select(x => x.AgeGroup.ToString()).ToList(); // 3. 收入分布柱状图 CanadaIncomeSeries = new SeriesCollection { new ColumnSeries { Title = "人口数", Values = new ChartValues<double>(_canadaData.IncomeData.Select(x => x.PopulationCount)) } }; CanadaIncomeRangeLabels = _canadaData.IncomeData.Select(x => x.IncomeRange).ToList(); System.Diagnostics.Debug.WriteLine($"✅ 加拿大图表数据初始化:饼图系列数={CanadaDemographicSeries.Count}"); } /// <summary> /// 初始化澳大利亚图表数据 /// </summary> private void InitAustraliaCharts() { var seriesCollection = new SeriesCollection(); foreach (var d in _australiaData.DemographicData) { var pieSeries = new PieSeries { Title = d.Ethnicity, DataLabels = true, Values = new ChartValues<double> { d.Percentage } // 确保Values有数据 }; // 显式Add到SeriesCollection seriesCollection.Add(pieSeries); } // 赋值并触发属性通知 AustraliaDemographicSeries = seriesCollection; // 调试日志:确认SeriesCollection的Count System.Diagnostics.Debug.WriteLine($"📌 澳大利亚饼图SeriesCollection.Count:{AustraliaDemographicSeries.Count}"); // 2. 年龄趋势折线图 AustraliaAgeTrendSeries = new SeriesCollection { new LineSeries { Title = "年龄占比", Values = new ChartValues<double>(_australiaData.AgeTrendData.Select(x => x.PopulationRatio)), LineSmoothness = 1, PointGeometry = DefaultGeometries.Circle, PointGeometrySize = 4 } }; AustraliaAgeGroupLabels = _australiaData.AgeTrendData.Select(x => x.AgeGroup.ToString()).ToList(); // 3. 收入分布柱状图 AustraliaIncomeSeries = new SeriesCollection { new ColumnSeries { Title = "人口数", Values = new ChartValues<double>(_australiaData.IncomeData.Select(x => x.PopulationCount)) } }; AustraliaIncomeRangeLabels = _australiaData.IncomeData.Select(x => x.IncomeRange).ToList(); System.Diagnostics.Debug.WriteLine($"✅ 澳大利亚图表数据初始化:饼图系列数={AustraliaDemographicSeries.Count}"); } /// <summary> /// 初始化英国图表数据 /// </summary> private void InitUKCharts() { var seriesCollection = new SeriesCollection(); foreach (var d in _ukData.DemographicData) { var pieSeries = new PieSeries { Title = d.Ethnicity, DataLabels = true, Values = new ChartValues<double> { d.Percentage } // 确保Values有数据 }; // 显式Add到SeriesCollection seriesCollection.Add(pieSeries); } // 赋值并触发属性通知 UKDemographicSeries = seriesCollection; // 2. 年龄趋势折线图 UKAgeTrendSeries = new SeriesCollection { new LineSeries { Title = "年龄占比", Values = new ChartValues<double>(_ukData.AgeTrendData.Select(x => x.PopulationRatio)), LineSmoothness = 1, PointGeometry = DefaultGeometries.Circle, PointGeometrySize = 4 } }; UKAgeGroupLabels = _ukData.AgeTrendData.Select(x => x.AgeGroup.ToString()).ToList(); // 3. 收入分布柱状图 UKIncomeSeries = new SeriesCollection { new ColumnSeries { Title = "人口数", Values = new ChartValues<double>(_ukData.IncomeData.Select(x => x.PopulationCount)) } }; UKIncomeRangeLabels = _ukData.IncomeData.Select(x => x.IncomeRange).ToList(); System.Diagnostics.Debug.WriteLine($"✅ 英国图表数据初始化:饼图系列数={UKDemographicSeries.Count}"); } #endregion } }
//Shell
<prism:PrismApplication x:Class="Shell.App"
             xmlns="http://schemas.microsoft.com/winfx/2006/xaml/presentation"
             xmlns:x="http://schemas.microsoft.com/winfx/2006/xaml"
             xmlns:local="clr-namespace:Shell"
             xmlns:prism="http://prismlibrary.com/">
</prism:PrismApplication>


using CanadaModule;
using LiveCharts.Wpf;
using Prism.DryIoc;
using Prism.Ioc;
using Prism.Modularity;
using System.Configuration;
using System.Data;
using System.Reflection;
using System.Windows;
using System.Windows.Shapes;

namespace Shell
{
    /// <summary>
    /// Interaction logic for App.xaml
    /// </summary>
    public partial class App : PrismApplication
    {
        protected override Window CreateShell()
        {
            return Container.Resolve<MainWindow>();
        }

        protected override void RegisterTypes(IContainerRegistry containerRegistry)
        {
            //注冊mock数据服务
            containerRegistry.RegisterSingleton<Shared.Services.MockDataService>(() => Shared.Services.MockDataService.Instance);
        }

        protected override void ConfigureModuleCatalog(IModuleCatalog moduleCatalog)
        {
            moduleCatalog.AddModule<HomeModule.HomeModule>();
            moduleCatalog.AddModule<USAModule.USAModule>();
            moduleCatalog.AddModule<CanadaModule.CanadaModule>();
            moduleCatalog.AddModule<AustraliaModule.AustraliaModule>();
            moduleCatalog.AddModule<UKModule.UKModule>();
            base.ConfigureModuleCatalog(moduleCatalog);
        }
    }

}


<Window x:Class="Shell.MainWindow"
        xmlns="http://schemas.microsoft.com/winfx/2006/xaml/presentation"
        xmlns:x="http://schemas.microsoft.com/winfx/2006/xaml"
        xmlns:d="http://schemas.microsoft.com/expression/blend/2008"
        xmlns:mc="http://schemas.openxmlformats.org/markup-compatibility/2006"
        xmlns:local="clr-namespace:Shell"
        xmlns:prism="http://www.codeplex.com/prism"
        prism:ViewModelLocator.AutoWireViewModel="True"
        WindowState="Maximized"
        mc:Ignorable="d"
        Title="MainWindow" Height="450" Width="800">
    <Window.Resources>
        <local:ViewNameMatchConverter x:Key="ViewNameMatchConverter"/>

        <!-- 2. 修正导航按钮样式(用MultiDataTrigger替代原DataTrigger) -->
        <Style x:Key="NavButtonStyle" TargetType="Button">
            <Setter Property="Height" Value="50"/>
            <Setter Property="Background" Value="#34495E"/>
            <Setter Property="Foreground" Value="White"/>
            <Setter Property="FontSize" Value="30"/>
            <Setter Property="Padding" Value="10 5"/>
            <Setter Property="BorderThickness" Value="0"/>
            <Setter Property="HorizontalAlignment" Value="Stretch"/>
            <Setter Property="FontWeight" Value="Normal"/>
            <Style.Triggers>
                <!-- 原有鼠标悬浮效果 -->
                <Trigger Property="IsMouseOver" Value="True">
                    <Setter Property="Background" Value="#1ABC9C"/>
                    <Setter Property="Height" Value="70"/>
                </Trigger>

                <!-- 核心:MultiDataTrigger实现选中高亮(解决Value不能绑定的问题) -->
                <MultiDataTrigger>
                    <MultiDataTrigger.Conditions>
                        <Condition>
                            <Condition.Binding>
                                <!-- 多值绑定:同时传当前视图名 + 按钮参数 -->
                                <MultiBinding Converter="{StaticResource ViewNameMatchConverter}">
                                    <!-- 绑定窗口ViewModel的CurrentViewName -->
                                    <Binding RelativeSource="{RelativeSource AncestorType=Window}"
                                             Path="DataContext.CurrentViewName"/>
                                    <!-- 绑定当前按钮的CommandParameter -->
                                    <Binding RelativeSource="{RelativeSource Self}"
                                             Path="CommandParameter"/>
                                </MultiBinding>
                            </Condition.Binding>
                            <Condition.Value>True</Condition.Value>
                        </Condition>
                    </MultiDataTrigger.Conditions>

                    <!-- 选中高亮样式(可自定义) -->
                    <Setter Property="Background" Value="Cyan"/>
                    <!-- 红色背景 -->
                    <Setter Property="Height" Value="70"/>
                    <!-- 高度放大 -->
                    <Setter Property="FontWeight" Value="Bold"/>
                    <!-- 字体加粗 -->
                    <Setter Property="Foreground" Value="Yellow"/>
                    <!-- 黄色字体 -->
                    <Setter Property="BorderBrush" Value="White"/>
                    <!-- 白色边框 -->
                    <Setter Property="BorderThickness" Value="2"/>
                    <!-- 边框宽度 -->
                </MultiDataTrigger>
            </Style.Triggers>
        </Style>


        <!--<Style x:Key="NavButtonStyle" TargetType="Button">
            <Setter Property="Height" Value="50"/>
            <Setter Property="Background" Value="#34495E"/>
            <Setter Property="Foreground" Value="White"/>
            <Setter Property="FontSize" Value="30"/>
            <Setter Property="Padding" Value="10 5"/>
            <Setter Property="BorderThickness" Value="0"/>
            <Setter Property="HorizontalAlignment" Value="Stretch"/>
            <Style.Triggers>
                <Trigger Property="IsMouseOver" Value="True">
                    <Setter Property="Background" Value="#1ABC9C"/>
                    <Setter Property="Height" Value="70"/>
                </Trigger>
                -->
        <!-- 核心:选中高亮触发 -->
        <!--
                <DataTrigger
                    Binding="{Binding RelativeSource={RelativeSource AncestorType=Window}, Path=DataContext.CurrentViewName}"
                    Value="{Binding RelativeSource={RelativeSource Self}, Path=CommandParameter}">
                    -->
        <!-- 高亮样式(可自定义) -->
        <!--
                    <Setter Property="Background" Value="#E74C3C"/>
                    -->
        <!-- 红色高亮 -->
        <!--
                    <Setter Property="Height" Value="70"/>
                    -->
        <!-- 高度放大 -->
        <!--
                    <Setter Property="FontWeight" Value="Bold"/>
                    -->
        <!-- 字体加粗 -->
        <!--
                    <Setter Property="Foreground" Value="Yellow"/>
                    -->
        <!-- 字体黄色 -->
        <!--
                    <Setter Property="BorderBrush" Value="White"/>
                    -->
        <!-- 白色边框 -->
        <!--
                    <Setter Property="BorderThickness" Value="2"/>
                </DataTrigger>
            </Style.Triggers>
        </Style>-->

        <Style TargetType="TextBlock">
            <Style.Triggers>
                <Trigger Property="IsMouseOver" Value="True">
                    <Setter Property="Background" Value="#1ABC9C"/>
                </Trigger>
            </Style.Triggers>
        </Style>
    </Window.Resources>
    <Grid>
        <!--左侧导航栏-->
        <Grid.ColumnDefinitions>
            <ColumnDefinition Width="200"/>
            <ColumnDefinition Width="*"/>
        </Grid.ColumnDefinitions>

        <!--导航菜单-->
        <StackPanel Grid.Column="0" Background="#2C3E50" Margin="10">
            <TextBlock Text="导航菜单" FontSize="36" Foreground="White"
                       HorizontalAlignment="Center"/>
            <Button Content="首页" Command="{Binding NavigateCommand}"
                    CommandParameter="HomeView" Style="{StaticResource NavButtonStyle}"
                    Margin="0"/>
            <Button Content="USA" Command="{Binding NavigateCommand}"
                    CommandParameter="USAView" Style="{StaticResource NavButtonStyle}"
                    Margin="0"/>
            <Button Content="Canada" Command="{Binding NavigateCommand}"
                    CommandParameter="CanadaView" Style="{StaticResource NavButtonStyle}"
                    Margin="0"/>
            <Button Content="Australia" Command="{Binding NavigateCommand}"
                    CommandParameter="AustraliaView" Style="{StaticResource NavButtonStyle}"
                    Margin="0"/>
            <Button Content="UK" Command="{Binding NavigateCommand}"
                    CommandParameter="UKView" Style="{StaticResource NavButtonStyle}"
                    Margin="0"/>
        </StackPanel>

        <ContentControl Grid.Column="1"
                        prism:RegionManager.RegionName="ContentRegion"
                        Margin="2"/>
    </Grid>
</Window>


using Prism.Commands;
using Prism.Mvvm;
using Prism.Regions;
using System;
using System.Collections.Generic;
using System.Linq;
using System.Text;
using System.Threading.Tasks;

namespace Shell
{
    public class MainWindowViewModel : BindableBase
    {
        private readonly IRegionManager regionManager;

        // 跟踪当前选中的视图名称(初始为HomeView,默认高亮首页)
        private string _currentViewName = "HomeView";
        public string CurrentViewName
        {
            get => _currentViewName;
            set => SetProperty(ref _currentViewName, value); // 触发UI更新
        }

        public DelegateCommand<string> NavigateCommand { get; }
        public MainWindowViewModel(IRegionManager regionManagerValue)
        {
            regionManager = regionManagerValue;
            NavigateCommand = new DelegateCommand<string>(NavigateCommandExecuted);
            NavigateCommandExecuted("HomeView");
        }

        private void NavigateCommandExecuted(string viewName)
        {
            if (string.IsNullOrEmpty(viewName))
            {
                return;
            }

            // 1. 导航到指定视图
            regionManager.RequestNavigate("ContentRegion", viewName);
            // 2. 更新当前选中视图名称(用于按钮高亮)
            CurrentViewName = viewName;
        }
    }
}


using System;
using System.Collections.Generic;
using System.Globalization;
using System.Linq;
using System.Text;
using System.Threading.Tasks;
using System.Windows.Data;

namespace Shell
{
    /// <summary>
    /// 比较当前视图名和按钮参数是否一致的转换器
    /// </summary>
    public class ViewNameMatchConverter : IMultiValueConverter
    {
        /// <summary>
        /// 转换逻辑:value[0]=CurrentViewName,value[1]=CommandParameter
        /// </summary>
        public object Convert(object[] values, Type targetType, object parameter, CultureInfo culture)
        {
            // 校验参数完整性
            if (values.Length < 2 || values[0] == null || values[1] == null)
                return false;

            // 比较两个值是否相等(忽略大小写)
            string currentView = values[0].ToString();
            string buttonParam = values[1].ToString();
            return currentView.Equals(buttonParam, StringComparison.Ordinal);
        }

        // 反向转换无需实现(导航选中状态无需反向修改)
        public object[] ConvertBack(object value, Type[] targetTypes, object parameter, CultureInfo culture)
        {
            throw new NotImplementedException("无需反向转换");
        }
    }
}
using Prism.Ioc;
using Prism.Modularity;
using System;
using System.Collections.Generic;
using System.Linq;
using System.Text;
using System.Threading.Tasks;

namespace UKModule
{
    public class UKModule : IModule
    {
        public void OnInitialized(IContainerProvider containerProvider)
        {

        }

        public void RegisterTypes(IContainerRegistry containerRegistry)
        {
            containerRegistry.RegisterForNavigation<UKView>();
        }
    }
}

<UserControl x:Class="UKModule.UKView"
             xmlns="http://schemas.microsoft.com/winfx/2006/xaml/presentation"
             xmlns:x="http://schemas.microsoft.com/winfx/2006/xaml"
             xmlns:mc="http://schemas.openxmlformats.org/markup-compatibility/2006"
             xmlns:d="http://schemas.microsoft.com/expression/blend/2008"
             xmlns:local="clr-namespace:UKModule"
                          xmlns:prism="http://prismlibrary.com/"
             xmlns:lvc="clr-namespace:LiveCharts.Wpf;assembly=LiveCharts.Wpf"
             xmlns:shared="clr-namespace:Shared.Models;assembly=Shared"
             prism:ViewModelLocator.AutoWireViewModel="True"
             mc:Ignorable="d"
             d:DesignHeight="700" d:DesignWidth="900">
    <UserControl.Resources>
        <!-- 转换器:布尔值转可见性 -->
        <BooleanToVisibilityConverter x:Key="BoolToVis"/>
    </UserControl.Resources>

    <Grid Margin="10">
        <Grid.RowDefinitions>
            <RowDefinition Height="Auto"/>
            <RowDefinition Height="*"/>
            <RowDefinition Height="Auto"/>
            <RowDefinition Height="*"/>
            <RowDefinition Height="Auto"/>
        </Grid.RowDefinitions>

        <!-- 1. 页面标题 -->
        <TextBlock Grid.Row="0" Text="{Binding CountryData.CountryName}"
                   FontSize="20" FontWeight="Bold" Margin="0 0 0 10"/>

        <!-- 2. 图表区域(饼图+折线图+柱状图) -->
        <Grid Grid.Row="1" Margin="0 10 0 10">
            <Grid.ColumnDefinitions>
                <ColumnDefinition Width="1*"/>
                <ColumnDefinition Width="1*"/>
                <ColumnDefinition Width="1*"/>
            </Grid.ColumnDefinitions>

            <!-- 人种构成饼图 -->
            <Grid Grid.Column="0" Margin="0 0 10 0">
                <Grid.RowDefinitions>
                    <RowDefinition Height="Auto"/>
                    <RowDefinition Height="*"/>
                </Grid.RowDefinitions>
                <TextBlock Text="人种构成" FontSize="14" FontWeight="SemiBold" Margin="0 0 0 5"/>
                <lvc:PieChart Grid.Row="1" Series="{Binding DemographicSeries}"
                              LegendLocation="Bottom"/>
            </Grid>

            <!-- 年龄趋势折线图 -->
            <Grid Grid.Column="1" Margin="5 0 5 0">
                <Grid.RowDefinitions>
                    <RowDefinition Height="Auto"/>
                    <RowDefinition Height="*"/>
                </Grid.RowDefinitions>
                <TextBlock Text="年龄分布趋势" FontSize="14" FontWeight="SemiBold" Margin="0 0 0 5"/>
                <lvc:CartesianChart Grid.Row="1" Series="{Binding AgeTrendSeries}">
                    <lvc:CartesianChart.AxisX>
                        <lvc:Axis Title="年龄组" Labels="{Binding AgeGroupLabels}"/>
                    </lvc:CartesianChart.AxisX>
                    <lvc:CartesianChart.AxisY>
                        <lvc:Axis Title="人口占比(%)"/>
                    </lvc:CartesianChart.AxisY>
                </lvc:CartesianChart>
            </Grid>

            <!-- 收入分布柱状图 -->
            <Grid Grid.Column="2" Margin="10 0 0 0">
                <Grid.RowDefinitions>
                    <RowDefinition Height="Auto"/>
                    <RowDefinition Height="*"/>
                </Grid.RowDefinitions>
                <TextBlock Text="收入分布" FontSize="14" FontWeight="SemiBold" Margin="0 0 0 5"/>
                <lvc:CartesianChart Grid.Row="1" Series="{Binding IncomeSeries}">
                    <lvc:CartesianChart.AxisX>
                        <lvc:Axis Title="收入区间(USD)" Labels="{Binding IncomeRangeLabels}"/>
                    </lvc:CartesianChart.AxisX>
                    <lvc:CartesianChart.AxisY>
                        <lvc:Axis Title="人口数(百万)"/>
                    </lvc:CartesianChart.AxisY>
                </lvc:CartesianChart>
            </Grid>
        </Grid>

        <DataGrid Grid.Row="3" ItemsSource="{Binding PagedCityData}" AutoGenerateColumns="False"
                  CanUserAddRows="False" CanUserDeleteRows="False"
                  FontSize="30">
            <DataGrid.Resources>
                <Style TargetType="{x:Type DataGridTextColumn}">
                    <Setter Property="Width" Value="*"/>
                </Style>
            </DataGrid.Resources>
            <DataGrid.Columns>
                <DataGridTextColumn Header="城市名" Binding="{Binding CityName}"
                                    Visibility="{Binding ShowCityName, Converter={StaticResource BoolToVis}}"/>
                <DataGridTextColumn Header="人口" Binding="{Binding Population, StringFormat=N0}"
                                    Visibility="{Binding ShowPopulation, Converter={StaticResource BoolToVis}}"/>
                <DataGridTextColumn Header="人均收入(USD)" Binding="{Binding PerCapitaIncome, StringFormat=C2}"
                                    Visibility="{Binding ShowPerCapitaIncome, Converter={StaticResource BoolToVis}}"/>
                <DataGridTextColumn Header="面积(km²)" Binding="{Binding Area, StringFormat=N1}"
                                    Visibility="{Binding ShowArea, Converter={StaticResource BoolToVis}}"/>
                <DataGridTextColumn Header="GDP(亿美元)" Binding="{Binding GDP, StringFormat=N1}"
                                    Visibility="{Binding ShowGDP, Converter={StaticResource BoolToVis}}"/>
                <DataGridTextColumn Header="科研开支(亿USD)" Binding="{Binding RDSpending, StringFormat=N1}"
                                    Visibility="{Binding ShowRDSpending, Converter={StaticResource BoolToVis}}"/>
            </DataGrid.Columns>
        </DataGrid>
    </Grid>
</UserControl>

using LiveCharts;
using LiveCharts.Wpf;
using Prism.Commands;
using Prism.Mvvm;
using Prism.Regions;
using Shared.Models;
using Shared.Services;
using System;
using System.Collections.Generic;
using System.Diagnostics.PerformanceData;
using System.Linq;
using System.Text;
using System.Threading.Tasks;
using System.Windows.Input;

namespace UKModule
{
    public class UKViewModel : BindableBase, INavigationAware
    {
        #region 依赖注入&核心字段
        private readonly MockDataService _mockDataService;
        private CountryStatsModel _countryData = new();
        private List<CityStatsModel> _allCityData = new();
        private List<CityStatsModel> _pagedCityData = new();

        // 分页参数
        private int _currentPage = 1;
        private int _pageSize = 5;
        private int _totalPages;

        // 列显隐控制
        private bool _showCityName = true;
        private bool _showPopulation = true;
        private bool _showPerCapitaIncome = true;
        private bool _showArea = true;
        private bool _showGDP = true;
        private bool _showRDSpending = true;

        // 图表数据
        private SeriesCollection _demographicSeries = new();
        private SeriesCollection _ageTrendSeries = new();
        private SeriesCollection _incomeSeries = new();
        private List<string> _ageGroupLabels = new();
        private List<string> _incomeRangeLabels = new();
        #endregion

        #region 绑定属性
        public CountryStatsModel CountryData
        {
            get => _countryData;
            set => SetProperty(ref _countryData, value);
        }

        public List<CityStatsModel> PagedCityData
        {
            get => _pagedCityData;
            set => SetProperty(ref _pagedCityData, value);
        }

        // 分页属性
        public int CurrentPage
        {
            get => _currentPage;
            set
            {
                if (SetProperty(ref _currentPage, value))
                {
                    UpdatePagedData();
                    RaisePropertyChanged(nameof(CanGoPrevious));
                    RaisePropertyChanged(nameof(CanGoNext));
                }
            }
        }

        public int TotalPages
        {
            get => _totalPages;
            set => SetProperty(ref _totalPages, value);
        }

        public bool CanGoPrevious => CurrentPage > 1;
        public bool CanGoNext => CurrentPage < TotalPages;

        // 列显隐属性
        public bool ShowCityName
        {
            get => _showCityName;
            set => SetProperty(ref _showCityName, value);
        }

        public bool ShowPopulation
        {
            get => _showPopulation;
            set => SetProperty(ref _showPopulation, value);
        }

        public bool ShowPerCapitaIncome
        {
            get => _showPerCapitaIncome;
            set => SetProperty(ref _showPerCapitaIncome, value);
        }

        public bool ShowArea
        {
            get => _showArea;
            set => SetProperty(ref _showArea, value);
        }

        public bool ShowGDP
        {
            get => _showGDP;
            set => SetProperty(ref _showGDP, value);
        }

        public bool ShowRDSpending
        {
            get => _showRDSpending;
            set => SetProperty(ref _showRDSpending, value);
        }

        // 图表绑定属性
        public SeriesCollection DemographicSeries
        {
            get => _demographicSeries;
            set => SetProperty(ref _demographicSeries, value);
        }

        public SeriesCollection AgeTrendSeries
        {
            get => _ageTrendSeries;
            set => SetProperty(ref _ageTrendSeries, value);
        }

        public SeriesCollection IncomeSeries
        {
            get => _incomeSeries;
            set => SetProperty(ref _incomeSeries, value);
        }

        public List<string> AgeGroupLabels
        {
            get => _ageGroupLabels;
            set => SetProperty(ref _ageGroupLabels, value);
        }

        public List<string> IncomeRangeLabels
        {
            get => _incomeRangeLabels;
            set => SetProperty(ref _incomeRangeLabels, value);
        }

        // 分页命令
        public ICommand PreviousPageCommand => new DelegateCommand(() => CurrentPage--);
        public ICommand NextPageCommand => new DelegateCommand(() => CurrentPage++);
        #endregion

        public UKViewModel(MockDataService mockDataService)
        {
            _mockDataService = mockDataService;
        }

        #region 导航&数据加载
        public void OnNavigatedTo(NavigationContext navigationContext)
        {
            // 加载USA数据
            CountryData = _mockDataService.GetCountryData("UK");
            _allCityData = CountryData.CityData;
            PagedCityData = _allCityData.Take(10).ToList();
            // 初始化分页
            TotalPages = (int)Math.Ceiling((double)_allCityData.Count / _pageSize);
            CurrentPage = 1;

            // 初始化图表
            InitCharts();
        }

        public bool IsNavigationTarget(NavigationContext navigationContext) => true;
        public void OnNavigatedFrom(NavigationContext navigationContext) { }
        #endregion

        #region 私有方法
        // 初始化图表数据
        private void InitCharts()
        {
            // 1. 人种构成饼图
            DemographicSeries = new SeriesCollection();
            foreach (var item in CountryData.DemographicData)
            {
                DemographicSeries.Add(new PieSeries
                {
                    Title = item.Ethnicity,
                    Values = new ChartValues<double> { item.Percentage },
                    DataLabels = true
                });
            }

            // 2. 年龄趋势折线图
            AgeTrendSeries = new SeriesCollection
            {
                new LineSeries
                {
                    Title = "年龄占比",
                    Values = new ChartValues<double>(CountryData.AgeTrendData.Select(x => x.PopulationRatio)),
                    LineSmoothness = 1, // 平滑曲线
                    PointGeometry = DefaultGeometries.Circle,
                    PointGeometrySize = 5
                }
            };
            AgeGroupLabels = CountryData.AgeTrendData.Select(x => x.AgeGroup.ToString()).ToList();

            // 3. 收入分布柱状图
            IncomeSeries = new SeriesCollection
            {
                new ColumnSeries
                {
                    Title= "人口数",
                    Values= new ChartValues<double>(CountryData.IncomeData.Select(x => x.PopulationCount))
                }
            };
            IncomeRangeLabels = CountryData.IncomeData.Select(x => x.IncomeRange).ToList();
        }

        // 更新分页数据
        private void UpdatePagedData()
        {
            PagedCityData = _allCityData
                .Skip((CurrentPage - 1) * _pageSize)
                .Take(_pageSize)
                .ToList();
        }
        #endregion
    }
}
//USAModule
using Prism.Ioc;
using Prism.Modularity;
using Prism.Regions;
using System;
using System.Collections.Generic;
using System.Linq;
using System.Text;
using System.Threading.Tasks;

namespace USAModule
{
    public class USAModule : IModule
    {
        public void OnInitialized(IContainerProvider containerProvider)
        {

        }

        public void RegisterTypes(IContainerRegistry containerRegistry)
        {
            containerRegistry.RegisterForNavigation<USAView>();
        }
    }
}


<UserControl x:Class="USAModule.USAView"
             xmlns="http://schemas.microsoft.com/winfx/2006/xaml/presentation"
             xmlns:x="http://schemas.microsoft.com/winfx/2006/xaml"
             xmlns:mc="http://schemas.openxmlformats.org/markup-compatibility/2006"
             xmlns:d="http://schemas.microsoft.com/expression/blend/2008"
             xmlns:local="clr-namespace:USAModule"
             xmlns:prism="http://prismlibrary.com/"
             xmlns:lvc="clr-namespace:LiveCharts.Wpf;assembly=LiveCharts.Wpf"
             xmlns:shared="clr-namespace:Shared.Models;assembly=Shared"
             prism:ViewModelLocator.AutoWireViewModel="True"
             mc:Ignorable="d"
             d:DesignHeight="700" d:DesignWidth="900">
    <UserControl.Resources>
        <!-- 转换器:布尔值转可见性 -->
        <BooleanToVisibilityConverter x:Key="BoolToVis"/>
    </UserControl.Resources>

    <Grid Margin="10">
        <Grid.RowDefinitions>
            <RowDefinition Height="Auto"/>
            <RowDefinition Height="*"/>
            <RowDefinition Height="Auto"/>
            <RowDefinition Height="*"/>
            <RowDefinition Height="Auto"/>
        </Grid.RowDefinitions>

        <!-- 1. 页面标题 -->
        <TextBlock Grid.Row="0" Text="{Binding CountryData.CountryName}"
                   FontSize="20" FontWeight="Bold" Margin="0 0 0 10"/>

        <!-- 2. 图表区域(饼图+折线图+柱状图) -->
        <Grid Grid.Row="1" Margin="0 10 0 10">
            <Grid.ColumnDefinitions>
                <ColumnDefinition Width="1*"/>
                <ColumnDefinition Width="1*"/>
                <ColumnDefinition Width="1*"/>
            </Grid.ColumnDefinitions>

            <!-- 人种构成饼图 -->
            <Grid Grid.Column="0" Margin="0 0 10 0">
                <Grid.RowDefinitions>
                    <RowDefinition Height="Auto"/>
                    <RowDefinition Height="*"/>
                </Grid.RowDefinitions>
                <TextBlock Text="人种构成" FontSize="14" FontWeight="SemiBold" Margin="0 0 0 5"/>
                <lvc:PieChart Grid.Row="1" Series="{Binding DemographicSeries}"
                              LegendLocation="Bottom"/>
            </Grid>

            <!-- 年龄趋势折线图 -->
            <Grid Grid.Column="1" Margin="5 0 5 0">
                <Grid.RowDefinitions>
                    <RowDefinition Height="Auto"/>
                    <RowDefinition Height="*"/>
                </Grid.RowDefinitions>
                <TextBlock Text="年龄分布趋势" FontSize="14" FontWeight="SemiBold" Margin="0 0 0 5"/>
                <lvc:CartesianChart Grid.Row="1" Series="{Binding AgeTrendSeries}">
                    <lvc:CartesianChart.AxisX>
                        <lvc:Axis Title="年龄组" Labels="{Binding AgeGroupLabels}"/>
                    </lvc:CartesianChart.AxisX>
                    <lvc:CartesianChart.AxisY>
                        <lvc:Axis Title="人口占比(%)"/>
                    </lvc:CartesianChart.AxisY>
                </lvc:CartesianChart>
            </Grid>

            <!-- 收入分布柱状图 -->
            <Grid Grid.Column="2" Margin="10 0 0 0">
                <Grid.RowDefinitions>
                    <RowDefinition Height="Auto"/>
                    <RowDefinition Height="*"/>
                </Grid.RowDefinitions>
                <TextBlock Text="收入分布" FontSize="14" FontWeight="SemiBold" Margin="0 0 0 5"/>
                <lvc:CartesianChart Grid.Row="1" Series="{Binding IncomeSeries}">
                    <lvc:CartesianChart.AxisX>
                        <lvc:Axis Title="收入区间(USD)" Labels="{Binding IncomeRangeLabels}"/>
                    </lvc:CartesianChart.AxisX>
                    <lvc:CartesianChart.AxisY>
                        <lvc:Axis Title="人口数(百万)"/>
                    </lvc:CartesianChart.AxisY>
                </lvc:CartesianChart>
            </Grid>
        </Grid>

        <DataGrid Grid.Row="3" ItemsSource="{Binding PagedCityData}" AutoGenerateColumns="False"
                  CanUserAddRows="False" CanUserDeleteRows="False"
                  FontSize="30">
            <DataGrid.Resources>
                <Style TargetType="{x:Type DataGridTextColumn}">
                    <Setter Property="Width" Value="*"/>
                </Style>
            </DataGrid.Resources>
            <DataGrid.Columns>
                <DataGridTextColumn Header="城市名" Binding="{Binding CityName}"
                                    Visibility="{Binding ShowCityName, Converter={StaticResource BoolToVis}}"/>
                <DataGridTextColumn Header="人口" Binding="{Binding Population, StringFormat=N0}"
                                    Visibility="{Binding ShowPopulation, Converter={StaticResource BoolToVis}}"/>
                <DataGridTextColumn Header="人均收入(USD)" Binding="{Binding PerCapitaIncome, StringFormat=C2}"
                                    Visibility="{Binding ShowPerCapitaIncome, Converter={StaticResource BoolToVis}}"/>
                <DataGridTextColumn Header="面积(km²)" Binding="{Binding Area, StringFormat=N1}"
                                    Visibility="{Binding ShowArea, Converter={StaticResource BoolToVis}}"/>
                <DataGridTextColumn Header="GDP(亿美元)" Binding="{Binding GDP, StringFormat=N1}"
                                    Visibility="{Binding ShowGDP, Converter={StaticResource BoolToVis}}"/>
                <DataGridTextColumn Header="科研开支(亿USD)" Binding="{Binding RDSpending, StringFormat=N1}"
                                    Visibility="{Binding ShowRDSpending, Converter={StaticResource BoolToVis}}"/>
            </DataGrid.Columns>
        </DataGrid>
    </Grid>
</UserControl>


using LiveCharts;
using LiveCharts.Wpf;
using Prism.Commands;
using Prism.Mvvm;
using Prism.Regions;
using Shared.Models;
using Shared.Services;
using System;
using System.Collections.Generic;
using System.Linq;
using System.Text;
using System.Threading.Tasks;
using System.Windows.Input;

namespace USAModule
{
    public class USAViewModel : BindableBase, INavigationAware
    {
        #region 依赖注入&核心字段
        private readonly MockDataService _mockDataService;
        private CountryStatsModel _countryData = new();
        private List<CityStatsModel> _allCityData = new();
        private List<CityStatsModel> _pagedCityData = new();

        // 分页参数
        private int _currentPage = 1;
        private int _pageSize = 5;
        private int _totalPages;

        // 列显隐控制
        private bool _showCityName = true;
        private bool _showPopulation = true;
        private bool _showPerCapitaIncome = true;
        private bool _showArea = true;
        private bool _showGDP = true;
        private bool _showRDSpending = true;

        // 图表数据
        private SeriesCollection _demographicSeries = new();
        private SeriesCollection _ageTrendSeries = new();
        private SeriesCollection _incomeSeries = new();
        private List<string> _ageGroupLabels = new();
        private List<string> _incomeRangeLabels = new();
        #endregion

        #region 绑定属性
        public CountryStatsModel CountryData
        {
            get => _countryData;
            set => SetProperty(ref _countryData, value);
        }

        public List<CityStatsModel> PagedCityData
        {
            get => _pagedCityData;
            set => SetProperty(ref _pagedCityData, value);
        }

        // 分页属性
        public int CurrentPage
        {
            get => _currentPage;
            set
            {
                if (SetProperty(ref _currentPage, value))
                {
                    UpdatePagedData();
                    RaisePropertyChanged(nameof(CanGoPrevious));
                    RaisePropertyChanged(nameof(CanGoNext));
                }
            }
        }

        public int TotalPages
        {
            get => _totalPages;
            set => SetProperty(ref _totalPages, value);
        }

        public bool CanGoPrevious => CurrentPage > 1;
        public bool CanGoNext => CurrentPage < TotalPages;

        // 列显隐属性
        public bool ShowCityName
        {
            get => _showCityName;
            set => SetProperty(ref _showCityName, value);
        }

        public bool ShowPopulation
        {
            get => _showPopulation;
            set => SetProperty(ref _showPopulation, value);
        }

        public bool ShowPerCapitaIncome
        {
            get => _showPerCapitaIncome;
            set => SetProperty(ref _showPerCapitaIncome, value);
        }

        public bool ShowArea
        {
            get => _showArea;
            set => SetProperty(ref _showArea, value);
        }

        public bool ShowGDP
        {
            get => _showGDP;
            set => SetProperty(ref _showGDP, value);
        }

        public bool ShowRDSpending
        {
            get => _showRDSpending;
            set => SetProperty(ref _showRDSpending, value);
        }

        // 图表绑定属性
        public SeriesCollection DemographicSeries
        {
            get => _demographicSeries;
            set => SetProperty(ref _demographicSeries, value);
        }

        public SeriesCollection AgeTrendSeries
        {
            get => _ageTrendSeries;
            set => SetProperty(ref _ageTrendSeries, value);
        }

        public SeriesCollection IncomeSeries
        {
            get => _incomeSeries;
            set => SetProperty(ref _incomeSeries, value);
        }

        public List<string> AgeGroupLabels
        {
            get => _ageGroupLabels;
            set => SetProperty(ref _ageGroupLabels, value);
        }

        public List<string> IncomeRangeLabels
        {
            get => _incomeRangeLabels;
            set => SetProperty(ref _incomeRangeLabels, value);
        }

        // 分页命令
        public ICommand PreviousPageCommand => new DelegateCommand(() => CurrentPage--);
        public ICommand NextPageCommand => new DelegateCommand(() => CurrentPage++);
        #endregion

        public USAViewModel(MockDataService mockDataService)
        {
            _mockDataService = mockDataService;
        }

        #region 导航&数据加载
        public void OnNavigatedTo(NavigationContext navigationContext)
        {
            // 加载USA数据
            CountryData = _mockDataService.GetCountryData("USA");
            _allCityData = CountryData.CityData;
            PagedCityData = _allCityData.Take(10).ToList();
            // 初始化分页
            TotalPages = (int)Math.Ceiling((double)_allCityData.Count / _pageSize);
            CurrentPage = 1;

            // 初始化图表
            InitCharts();
        }

        public bool IsNavigationTarget(NavigationContext navigationContext) => true;
        public void OnNavigatedFrom(NavigationContext navigationContext) { }
        #endregion

        #region 私有方法
        // 初始化图表数据
        private void InitCharts()
        {
            // 1. 人种构成饼图
            DemographicSeries = new SeriesCollection();
            foreach (var item in CountryData.DemographicData)
            {
                DemographicSeries.Add(new PieSeries
                {
                    Title = item.Ethnicity,
                    Values = new ChartValues<double> { item.Percentage },
                    DataLabels = true
                });
            }

            // 2. 年龄趋势折线图
            AgeTrendSeries = new SeriesCollection
            {
                new LineSeries
                {
                    Title = "年龄占比",
                    Values = new ChartValues<double>(CountryData.AgeTrendData.Select(x => x.PopulationRatio)),
                    LineSmoothness = 1, // 平滑曲线
                    PointGeometry = DefaultGeometries.Circle,
                    PointGeometrySize = 5
                }
            };
            AgeGroupLabels = CountryData.AgeTrendData.Select(x => x.AgeGroup.ToString()).ToList();

            // 3. 收入分布柱状图
            IncomeSeries = new SeriesCollection
            {
                new ColumnSeries
                {
                    Title= "人口数",
                    Values= new ChartValues<double>(CountryData.IncomeData.Select(x => x.PopulationCount))
                }
            };
            IncomeRangeLabels = CountryData.IncomeData.Select(x => x.IncomeRange).ToList();
        }

        // 更新分页数据
        private void UpdatePagedData()
        {
            PagedCityData = _allCityData
                .Skip((CurrentPage - 1) * _pageSize)
                .Take(_pageSize)
                .ToList();
        }
        #endregion
    }
The whole code architecture as below
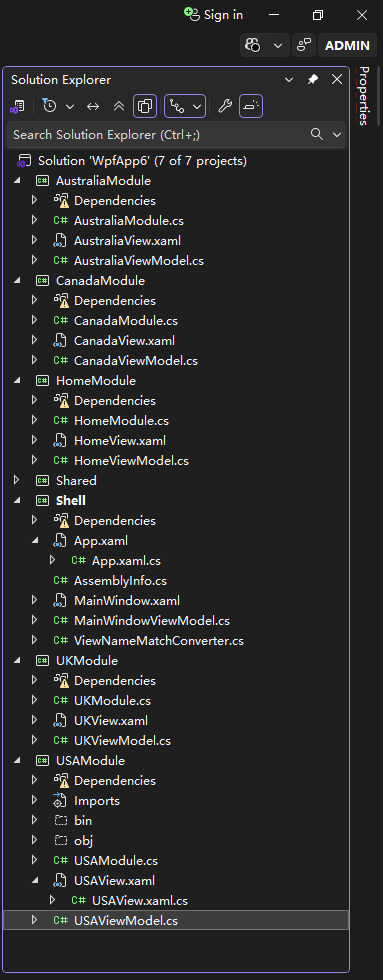
Shell/Shell.csproj
<Project Sdk="Microsoft.NET.Sdk">

  <PropertyGroup>
    <OutputType>WinExe</OutputType>
    <TargetFramework>net10.0-windows</TargetFramework>
    <Nullable>enable</Nullable>
    <ImplicitUsings>enable</ImplicitUsings>
    <UseWPF>true</UseWPF>
  </PropertyGroup>

  <ItemGroup>
    <PackageReference Include="livecharts.wpf" Version="0.9.7" />
    <PackageReference Include="Prism.DryIoc" Version="8.1.97" />
    <PackageReference Include="Prism.Wpf" Version="8.1.97" />
  </ItemGroup>

  <ItemGroup>
    <ProjectReference Include="..\AustraliaModule\AustraliaModule.csproj" />
    <ProjectReference Include="..\CanadaModule\CanadaModule.csproj" />
    <ProjectReference Include="..\HomeModule\HomeModule.csproj" />
    <ProjectReference Include="..\Shared\Shared.csproj" />
    <ProjectReference Include="..\UKModule\UKModule.csproj" />
    <ProjectReference Include="..\USAModule\USAModule.csproj" />
  </ItemGroup>

</Project>
USAModule\USAModule.csproj
<Project Sdk="Microsoft.NET.Sdk">

  <PropertyGroup>
    <TargetFramework>net10.0-windows</TargetFramework>
    <Nullable>enable</Nullable>
    <UseWPF>true</UseWPF>
    <ImplicitUsings>enable</ImplicitUsings>
  </PropertyGroup>

  <ItemGroup>
    <PackageReference Include="livecharts.wpf" Version="0.9.7" />
    <PackageReference Include="Prism.DryIoc" Version="8.1.97" />
    <PackageReference Include="Prism.Wpf" Version="8.1.97" />
  </ItemGroup>

  <ItemGroup>
    <ProjectReference Include="..\Shared\Shared.csproj" />
  </ItemGroup>

</Project>
 var seriesCollection = new SeriesCollection();
 foreach (var d in _usaData.DemographicData)
 {
     var pieSeries = new PieSeries
     {
         Title = d.Ethnicity,
         DataLabels = true,
         Values = new ChartValues<double> { d.Percentage } // 确保Values有数据
     };
     // 显式Add到SeriesCollection
     seriesCollection.Add(pieSeries);
 }

 // 赋值并触发属性通知
 USADemographicSeries = seriesCollection;

 // 调试日志:确认SeriesCollection的Count
 System.Diagnostics.Debug.WriteLine($"📌 美国饼图SeriesCollection.Count:{USADemographicSeries.Count}");

 浙公网安备 33010602011771号