install-package LiveChartsCore.SkiaSharpView.WPF -Version 2.0.0-beta.90
public MainVM()
{
LiveCharts.Configure(config =>
{
config.HasMap<XYPoint>((point, chartPt) =>
{
chartPt.PrimaryValue=point.Y;
chartPt.SecondaryValue=point.X;
});
});
InitData();
}
private void InitData()
{
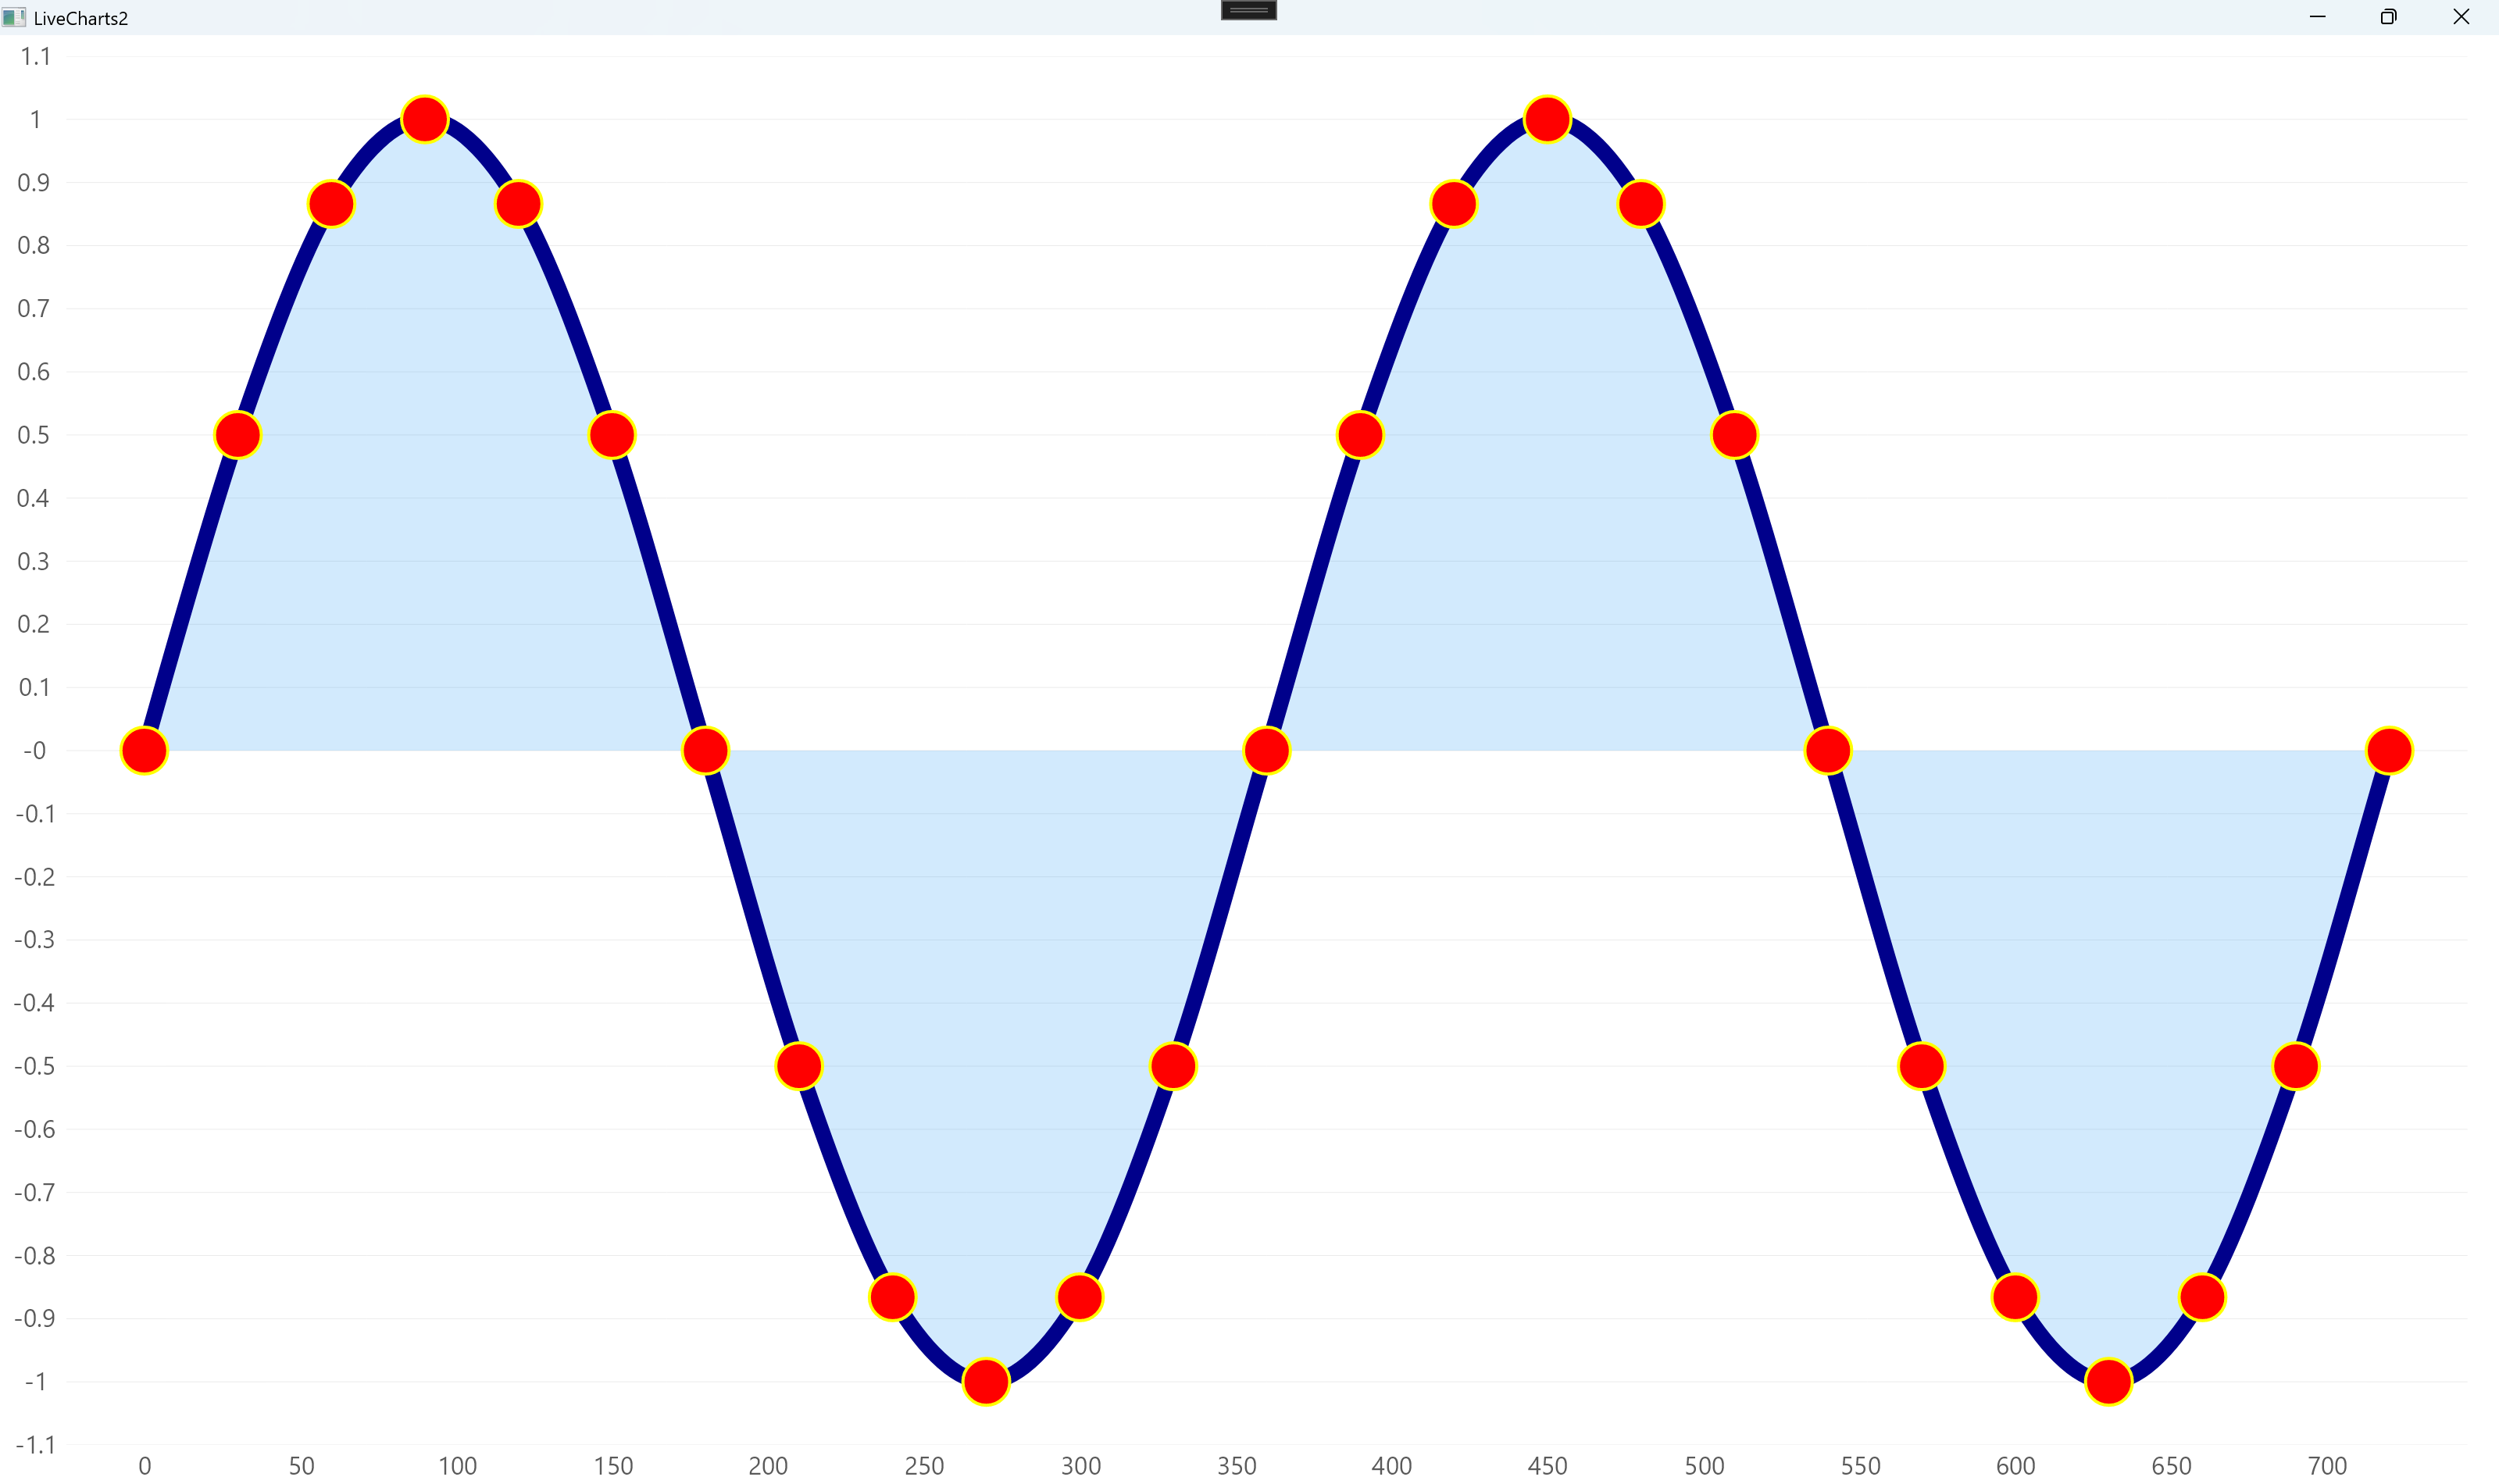
for (int i = 0; i<=720; i+=30)
{
XYPointsCollection.Add(new XYPoint()
{
X = i,
Y=Math.Sin(i*Math.PI/180)
});
}
SolidColorBrush blueBrush = Brushes.Blue;
var lvcPaint = new SolidColorPaint(new SKColor(blueBrush.Color.R, blueBrush.Color.G, blueBrush.Color.B, blueBrush.Color.A));
Series = new ISeries[]
{
new LineSeries<XYPoint>
{
Values = XYPointsCollection,
Name = "",
GeometrySize=30,
GeometryFill=new SolidColorPaint(SKColors.Red),
Stroke=new SolidColorPaint(SKColors.DarkBlue,10),
GeometryStroke=new SolidColorPaint(SKColors.Yellow,2)
}
};
}
![]()
//xaml
<Window x:Class="WpfApp4.MainWindow"
        xmlns="http://schemas.microsoft.com/winfx/2006/xaml/presentation"
        xmlns:x="http://schemas.microsoft.com/winfx/2006/xaml"
        xmlns:d="http://schemas.microsoft.com/expression/blend/2008"
        xmlns:mc="http://schemas.openxmlformats.org/markup-compatibility/2006"
        xmlns:lvc="clr-namespace:LiveChartsCore.SkiaSharpView.WPF;assembly=LiveChartsCore.SkiaSharpView.WPF"
        xmlns:local="clr-namespace:WpfApp4"
        mc:Ignorable="d"
        Title="LiveCharts2" Height="450" Width="800"
        WindowState="Maximized">
    <Grid>
        <lvc:CartesianChart Series="{Binding Series}">
        </lvc:CartesianChart>
    </Grid>
</Window>


//cs
using LiveChartsCore;
using LiveChartsCore.Drawing;
using LiveChartsCore.SkiaSharpView;
using LiveChartsCore.SkiaSharpView.Painting;
using SkiaSharp;
using System.Collections.ObjectModel;
using System.ComponentModel;
using System.Runtime.CompilerServices;
using System.Text;
using System.Windows;
using System.Windows.Controls;
using System.Windows.Data;
using System.Windows.Documents;
using System.Windows.Input;
using System.Windows.Media;
using System.Windows.Media.Imaging;
using System.Windows.Navigation;
using System.Windows.Shapes;

namespace WpfApp4
{
    /// <summary>
    /// Interaction logic for MainWindow.xaml
    /// </summary>
    public partial class MainWindow : Window
    {
        public MainWindow()
        {
            InitializeComponent();
            var vm = new MainVM();
            this.DataContext=vm;
        }
    }

    public class MainVM : INotifyPropertyChanged
    {
        public ObservableCollection<XYPoint> XYPointsCollection { get; set; } = new ObservableCollection<XYPoint>();

        private ISeries[] series;
        public ISeries[] Series
        {
            get
            {
                return series;
            }
            set
            {
                series = value;
                OnPropertyChanged();
            }
        }

        public MainVM()
        {
            LiveCharts.Configure(config =>
            {
                config.HasMap<XYPoint>((point, chartPt) =>
                {
                    chartPt.PrimaryValue=point.Y;
                    chartPt.SecondaryValue=point.X;
                });
            });
            InitData();
        }

        private void InitData()
        {
            for (int i = 0; i<=720; i+=30)
            {
                XYPointsCollection.Add(new XYPoint()
                {
                    X = i,
                    Y=Math.Sin(i*Math.PI/180)
                });
            }

            SolidColorBrush blueBrush = Brushes.Blue;
            var lvcPaint = new SolidColorPaint(new SKColor(blueBrush.Color.R, blueBrush.Color.G, blueBrush.Color.B, blueBrush.Color.A));

            Series = new ISeries[]
            {
                new LineSeries<XYPoint>
                {
                    Values = XYPointsCollection,
                    Name = "",
                    GeometrySize=30,
                    GeometryFill=new SolidColorPaint(SKColors.Red),
                    Stroke=new SolidColorPaint(SKColors.DarkBlue,10),
                    GeometryStroke=new SolidColorPaint(SKColors.Yellow,2)
                }
            };
        }

        public event PropertyChangedEventHandler? PropertyChanged;
        private void OnPropertyChanged([CallerMemberName] string propName = "")
        {
            var handler = PropertyChanged;
            if (handler!=null)
            {
                handler?.Invoke(this, new PropertyChangedEventArgs(propName));
            }
        }
    }

    public struct XYPoint
    {
        public double X { get; set; }
        public double Y { get; set; }
    }
}
install-package LiveChartsCore.SkiaSharpView.WPF -Version 2.0.0-beta.90
//xaml
<Window x:Class="WpfApp5.MainWindow"
xmlns="http://schemas.microsoft.com/winfx/2006/xaml/presentation"
xmlns:x="http://schemas.microsoft.com/winfx/2006/xaml"
xmlns:d="http://schemas.microsoft.com/expression/blend/2008"
xmlns:mc="http://schemas.openxmlformats.org/markup-compatibility/2006"
xmlns:lvc="clr-namespace:LiveChartsCore.SkiaSharpView.WPF;assembly=LiveChartsCore.SkiaSharpView.WPF"
xmlns:local="clr-namespace:WpfApp5"
mc:Ignorable="d"
WindowState="Maximized"
Title="MainWindow" Height="450" Width="800">
<Grid>
<lvc:CartesianChart
Series="{Binding Series}"
XAxes="{Binding XAxes}"
YAxes="{Binding YAxes}"/>
</Grid>
</Window>
//cs
using LiveChartsCore;
using LiveChartsCore.Drawing;
using LiveChartsCore.SkiaSharpView;
using LiveChartsCore.SkiaSharpView.Painting;
using SkiaSharp;
using System.Collections.ObjectModel;
using System.Text;
using System.Windows;
using System.Windows.Controls;
using System.Windows.Data;
using System.Windows.Documents;
using System.Windows.Input;
using System.Windows.Media;
using System.Windows.Media.Imaging;
using System.Windows.Navigation;
using System.Windows.Shapes;
namespace WpfApp5
{
/// <summary>
/// Interaction logic for MainWindow.xaml
/// </summary>
public partial class MainWindow : Window
{
public MainWindow()
{
var vm = new MainVM();
this.DataContext=vm;
InitializeComponent();
}
}
public class MainVM
{
public ISeries[] Series { get; set; }
public Axis[] XAxes { get; set; }
public Axis[] YAxes { get; set; }
public ObservableCollection<XYPoint> XYPointsCollection { get; set; } = new ObservableCollection<XYPoint>();
public MainVM()
{
InitData();
}
void InitData()
{
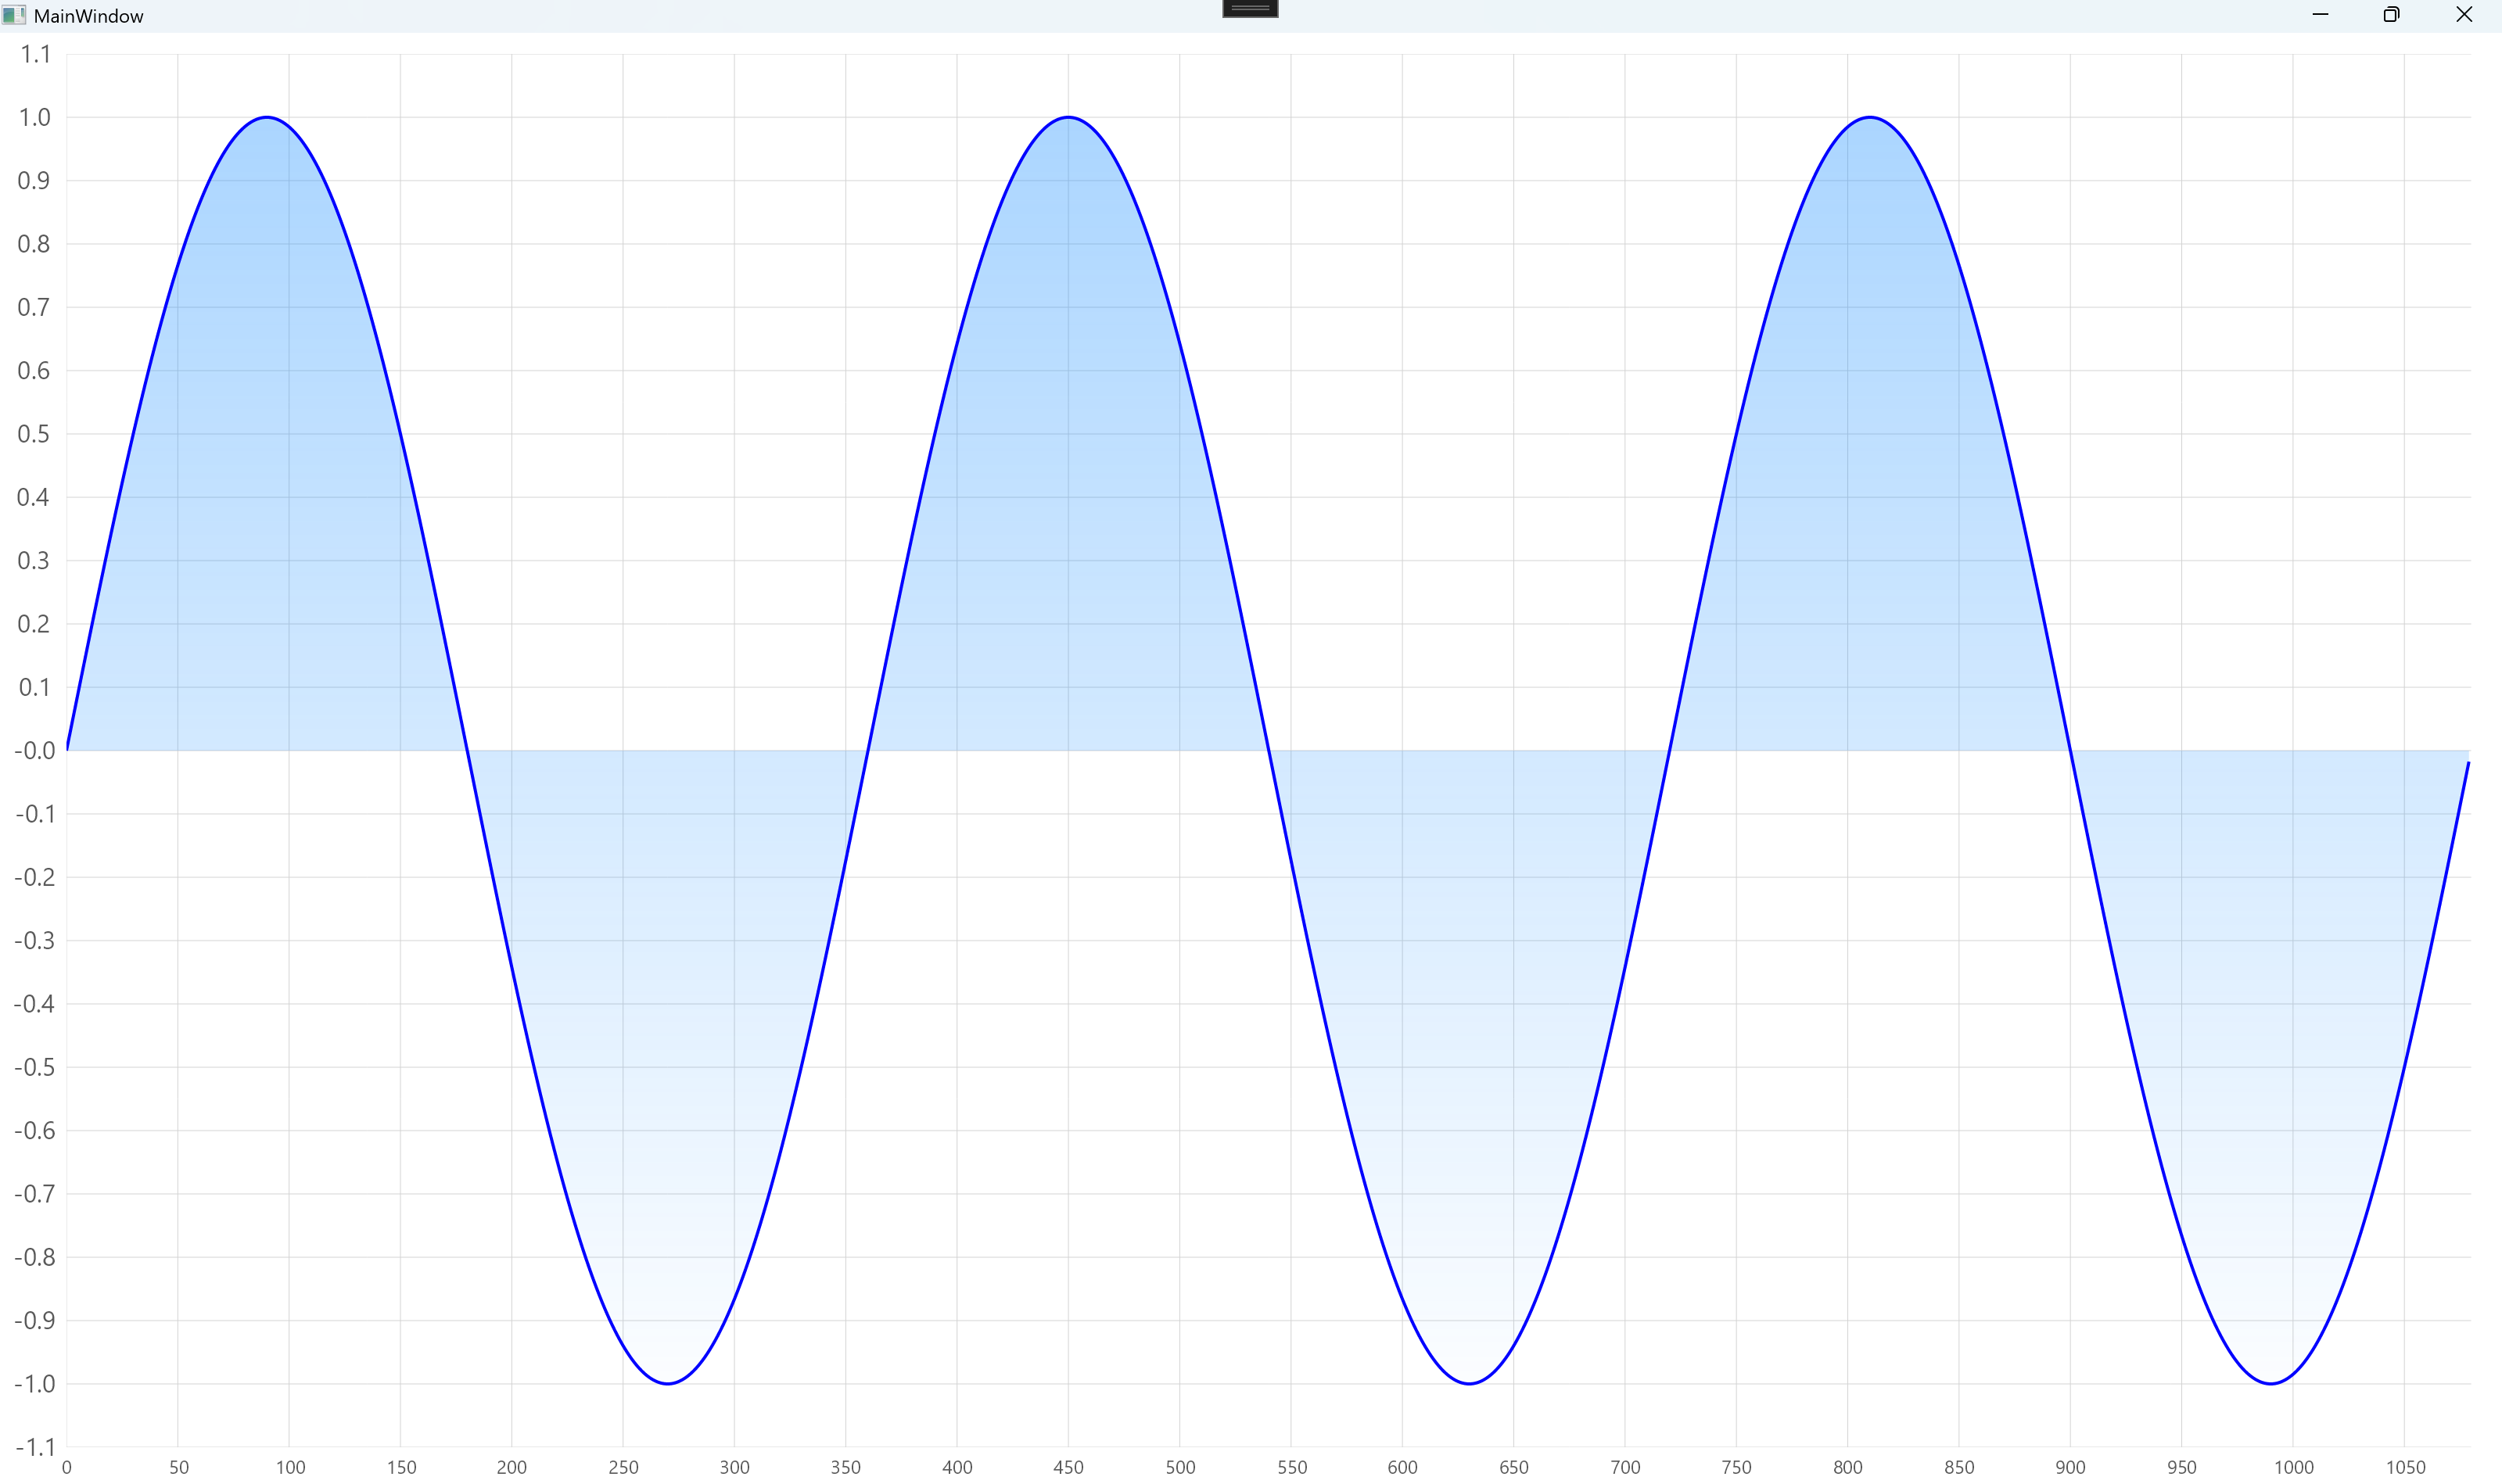
// Generate data for 3 periods (6π)
var points = Enumerable.Range(0, 1080)
.Select(x => new { X = x, Y = Math.Sin(x*Math.PI/180) })
.ToList();
Series = new ISeries[]
{
new LineSeries<double>
{
Values = points.Select(p => p.Y).ToArray(),
GeometrySize = 0,
LineSmoothness = 0.5, // Slight smoothing
Name = "y = sin(x)",
Stroke = new SolidColorPaint(SKColors.Blue, 2),
Fill = new LinearGradientPaint(
new SKColor(30, 144, 255, 100),
new SKColor(30, 144, 255, 0),
new SKPoint(0.5f, 0),
new SKPoint(0.5f, 1))
}
};
XAxes = new Axis[]
{
new Axis
{
Labeler = i => $"{i}",
UnitWidth = 30,
MinLimit = 0,
MaxLimit = 1080,
TextSize = 12,
SeparatorsPaint = new SolidColorPaint(SKColors.LightGray, 1)
}
};
YAxes = new Axis[]
{
new Axis
{
MinLimit = -1.1,
MaxLimit = 1.1,
Labeler = value => value.ToString("0.0"),
ShowSeparatorLines = true,
SeparatorsPaint = new SolidColorPaint(SKColors.LightGray, 1)
}
};
}
}
public struct XYPoint
{
public double X { get; set; }
public double Y { get; set; }
}
}
![]()

 浙公网安备 33010602011771号