import matplotlib.pyplot as plt
import numpy as np
import matplotlib
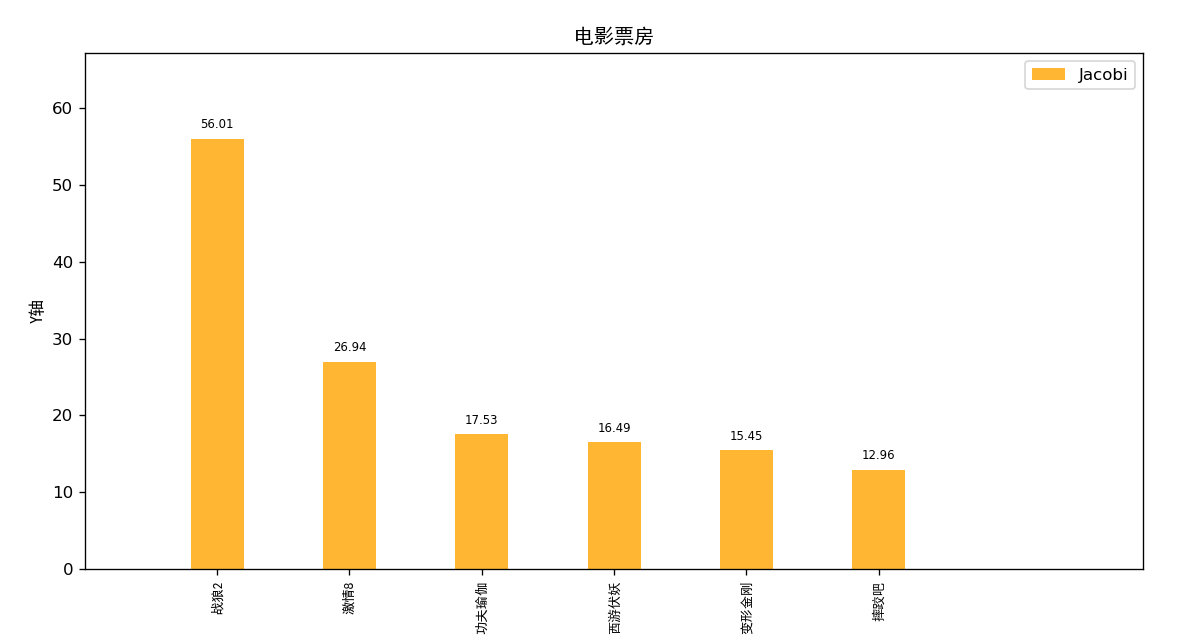
x = ["战狼2","激情8","功夫瑜伽","西游伏妖","变形金刚","摔跤吧"]
y = [56.01,26.94,17.53,16.49,15.45,12.96]
# 设置图形对象 :窗口
plt.figure('Figure Object 1', # 图形对象名称 窗口左上角显示
figsize = (8, 5), # 窗口大小
dpi = 120, # 分辨率
facecolor = 'white', # 背景色
)
#绘制条形图
"""
left:长条形中点横坐标
height:长条形高度
width:长条形宽度,默认值0.8
label:为后面设置legend准备
"""
rects1=plt.bar(x, y, width=0.4,label='Jacobi',alpha=0.8,color='orange')
#rects1=plt.bar(x, y, width=0.4,label='Jacobi',alpha=0.8,color='orange') #横向条形图
#刻度
plt.xticks(range(len(x)),x,rotation=90,fontproperties='SimHei',fontsize=8)
#plt.yticks(range(len(x)), x, rotation=90)
#条形图高度的标注
for rect in rects1:
height = rect.get_height()
plt.text(rect.get_x() + rect.get_width()/2, height+1, height, ha="center", va="bottom",fontsize=7)
#坐标轴范围
plt.xlim(-1,len(x)+1)
plt.ylim(0, max(y)*1.2)
#显示图例
plt.legend()
#坐标轴标注
#plt.xlabel("X轴",fontproperties='SimHei',fontsize=8)
plt.ylabel("Y轴",fontproperties='SimHei',fontsize=10)
#标题
plt.title('电影票房',fontproperties='SimHei',fontsize=12)
plt.show()
![]()


 浙公网安备 33010602011771号