ELK部署
ELK适用场景
公司网站的访问量有多大,访问高峰期的时间段是多少,最经常访问的热点数据是什么?这一切的一切,虽然我们可以自己通过shell等手段截取出来,
但是如果网站多了,服务器多了,还是非常不方便,而且阅读性也不好,因此ELK应运而生,不仅可以获取访问高峰期,还可以制作图表,让你的领导一目了然,
ELK已然成为各大互联往公司必部署的项目,因此接下来我们就来部署一套ELK系统
实验环境
192.168.254.13 ES,Kibana
192.168.254.11 logstash
ELK版本:7.5.1
操作系统:CentOS Linux release 7.6.1810 (Core)
note:
- 请确保你的firewalld和selinux关闭
- 最好确保你的机器是2个cpu以上
- 最好确保你的机器是2G以上内存
原理
logstash负责收集客户端的日志信息发送给ES服务器,然后通过Kibana以web形式展现出来
note:ES和logstash服务器需要java8以上
部署kibana
1.解压ES和kibana包,并移动到/usr/local下
tar -zxvf kibana-7.5.1-linux-x86_64.tar.gz
tar -zxvf elasticsearch-7.5.1-linux-x86_64.tar.gz
mv elasticsearch-7.5.1 /usr/local/elasticsearch
mv kibana-7.5.1-linux-x86_64 /usr/local/kibana
2.修改kibana的监听端口,默认为5601,0.0.0.0代表
vim config/kibana.yml
    server.port: 5601
    server.host: "0.0.0.0
3.启动服务
nohup /usr/local/kibana/bin/kibana --allow-root & 剥离ssh终端后台运行kibana
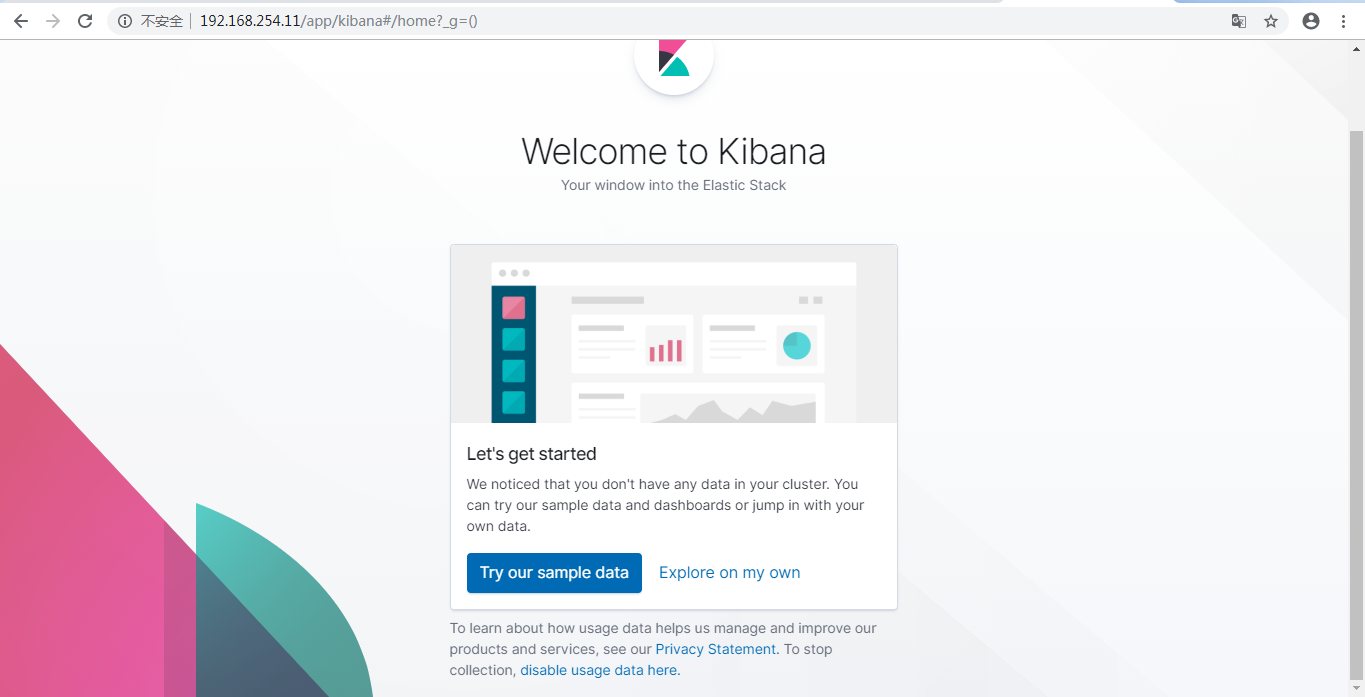
4.浏览器输入Kibana服务器的ip地址加端口号验证,出现以下内容代表kibana部署成功,由于连接不到ES服务器所以才会出现这种界面!
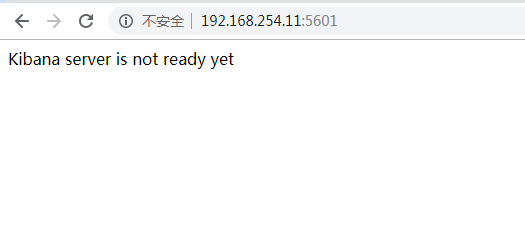
note:但是kibana界面是不安全的,因为没有任何的认证,谁都可以登录到kibana界面,为了安全,我们可以部署一个nginx,利用反向代理到后端的kibana
5.安装部署nginx并配置

1)[root@localhost ~]# yum install epel-release -y && yum install nginx -y
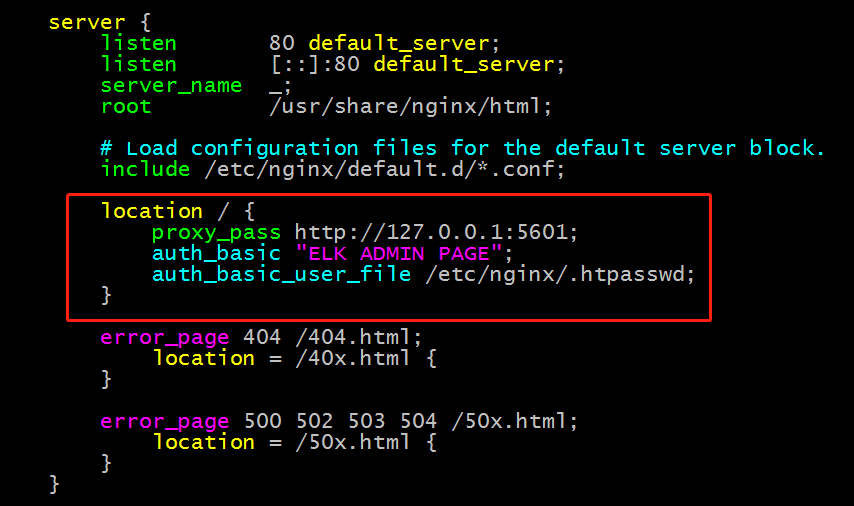
2)[root@localhost ~]# vim /etc/nginx/nginx.conf
location / {
proxy_pass http://127.0.0.1:5601;
auth_basic "ELK ADMIN PAGE";
auth_basic_user_file /etc/nginx/.htpasswd;
}
3)[root@localhost ~]# service nginx restart
4)[root@localhost ~]# htpasswd -c -m /etc/nginx/.htpasswd admin1
New password:
Re-type new password:
Adding password for user admin1
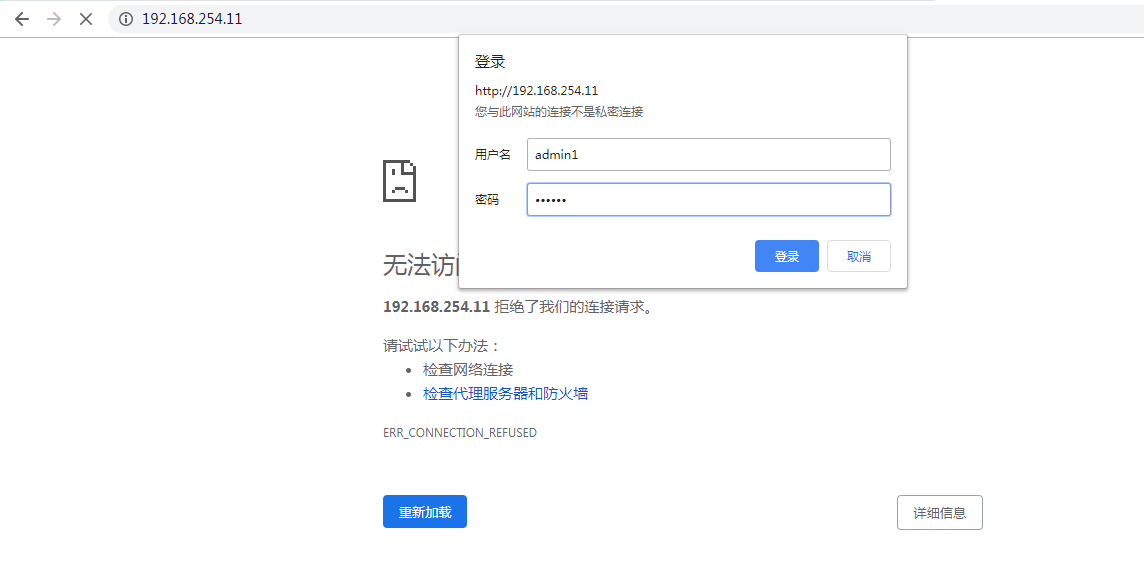
5)浏览器输入192.168.254.14,输入用户名密码验证
重启nginx服务后验证
输入用户名密码后得到如下界面
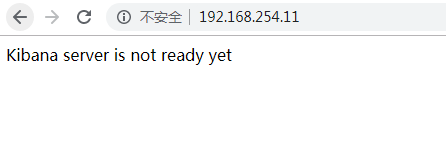
这样我们就可以把我们的ELK管理界面保护起来了,有木有点意思?
部署ES
1.编辑配置文件
vim config/elasticsearch.yml
    network.host: 0.0.0.0
    http.port: 9200
    path.data: /usr/local/elasticsearch/data/
    path.logs: /usr/local/elasticsearch/logs/
[liwang@localhost ~]$ vim /usr/local/elasticsearch-7.5.1/config/jvm.options
  -Xms200m  #按需要配置
  -Xmx200m  #按需要配置
2.因为ES启动文件不允许以root用户执行,因此需要创建一个普通用户,并且修改/usr/local/elasticsearch属主和属组为liwang
[root@localhost elasticsearch]# useradd liwang
[root@localhost elasticsearch]# chown -R liwang.liwang /usr/local/elasticsearch/
[root@localhost ~]$ su - liwang
[liwang@localhost ~]$ /usr/local/elasticsearch/bin/elasticsearch -d
可能会遇到的报错:
    [1]: max file descriptors [4096] for elasticsearch process is too low, increase to at least [65535]
    [2]: max virtual memory areas vm.max_map_count [65530] is too low, increase to at least [262144]
    [3]: the default discovery settings are unsuitable for production use; at least one of [discovery.seed_hosts, discovery.seed_providers, cluster.initial_master_nodes] must be configured
响应的解决方案:
    [1]: [root@localhost elasticsearch]# vim /etc/security/limits.conf
            * soft nofile 65536
            * hard nofile 65536
        [root@localhost local]# vim /etc/security/limits.d/20-nproc.conf
            * soft nproc unlimited
    [2]: [root@localhost elasticsearch]# vim /etc/sysctl.conf
            vm.max_map_count=262144
    [3]: [root@localhost elasticsearch]# vim /usr/local/elasticsearch/config/elasticsearch.yml
            cluster.initial_master_nodes: ["node-1"]
            node.name: node-1
再次启动ES:
    此时已经不报错,并且端口也正常启动了
    [root@localhost ~]# ss -tnl
    State      Recv-Q Send-Q                          Local Address:Port                                         Peer Address:Port
    LISTEN     0      128                                        :::9200                                                   :::*
    LISTEN     0      128                                        :::9300                                                   :::*
    ....
浏览器验证
部署logstash
1.解压文件,编辑配置文件
[root@localhost config]# tar -zxvf logstash-7.5.1.tar.gz -C /usr/local/
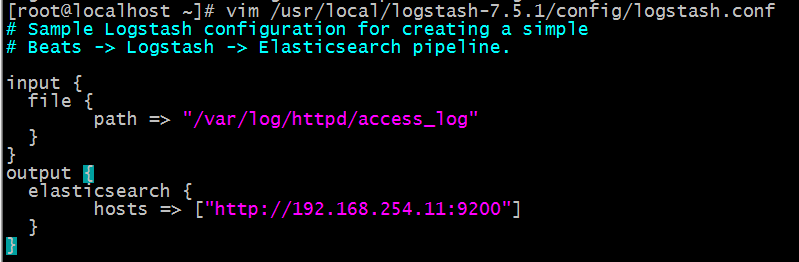
[root@localhost config]# vim /usr/local/logstash-7.5.1/config/logstash.conf
input{
stdin{}
}
output{
stdout{
codec=>rubydebug
}
}
2.由于logstash启动非常慢,官方给了一个优化速度的包,咱们也安装一下并启动
[root@localhost config]# yum install epel-release -y && yum install haveged -y && systemctl enable haveged && systemctl start haveged
3.启动logstash服务并测试
[root@localhost config]# /usr/local/logstash-7.5.1/bin/logstash -f /usr/local/logstash-7.5.1/config/logstash.conf
4.查看端口是否启动
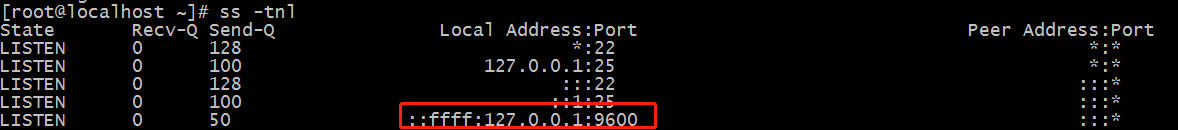
5.验证,随便输入一些信息如果有如下返回单表OK

5.没有问题就可已修改一下配置文件,监控apache访问日志
6.重新启动logstash
[root@localhost config]# /usr/local/logstash-7.5.1/bin/logstash -f /usr/local/logstash-7.5.1/config/logstash.conf
7.访问一下192.168.254.14的apache服务器,看是否有日志发送到ES服务器,可以看到已经有日志了
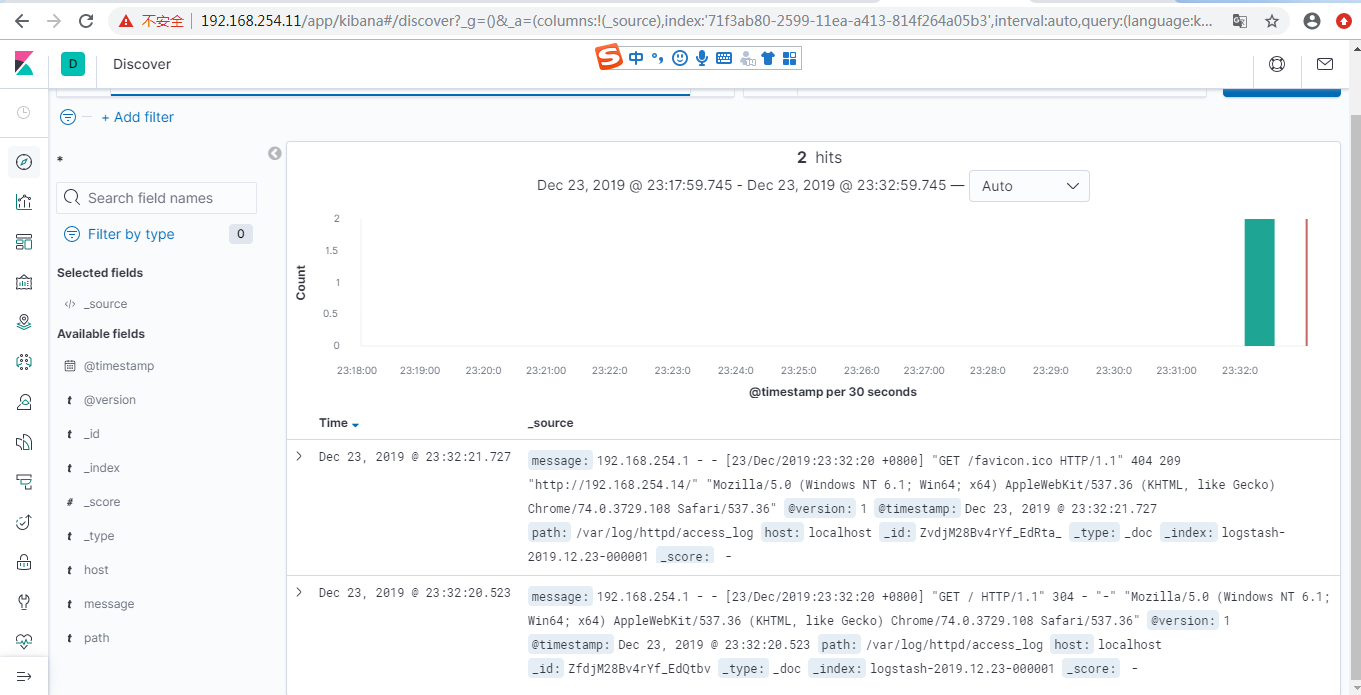
8.可以看到日志就是原生的apache日志,接下来咱们可以根据需求定义,以后就可以按照咱们自定义的格式显示了

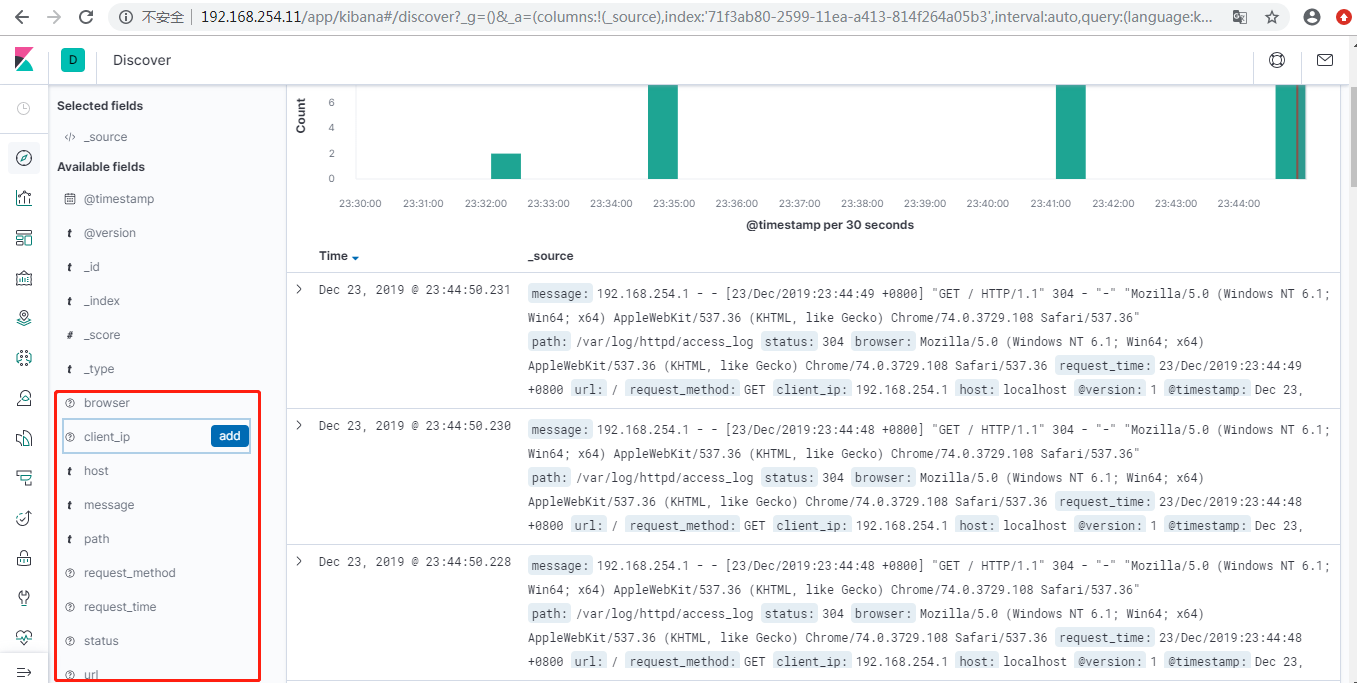
9.修改配置文件,把刚才咱们的正则表达式添加进来

10.重启logstash服务再次查看kibana,已经出现咱们自己定义的字段了
ELK搭建完毕!!!
posted on 2020-01-10 18:05 ExplorerMan 阅读(452) 评论(0) 收藏 举报


 浙公网安备 33010602011771号