监控服务器配置(三)-----Node_exporter安装配置
此安装主要是为了监控服务器运行状况
1.下载node_exporter安装包(linux版)到 /opt/minitor/node_exporter 。
下载地址:https://download.csdn.net/download/a15565772151/11111928
可以私聊我一下我发你资源
2.运行 tar -zxvf node_exporter-0.16.0.linux-amd64.tar.gz ,解压文件到当前目录。
3.执行 vim /opt/minitor/prometheus/prometheus.yml,添加以下配置文件(红色部分):
|
1
2
3
4
5
6
7
8
9
10
11
12
13
14
15
16
|
scrape_configs: # The job name is added as a label `job=<job_name>` to any timeseries scraped from this config. - job_name: 'prometheus' # metrics_path defaults to '/metrics' # scheme defaults to 'http'. static_configs: - targets: ['ip:9090'] labels: instance: prometheus - job_name: node static_configs: - targets: ['ip:9100'] labels: instance: node |
注意缩进对齐(很重要)
4.启动 node_exporter
|
1
|
nohup ./node_exporter & |
5.去prometheus中查看node的状态

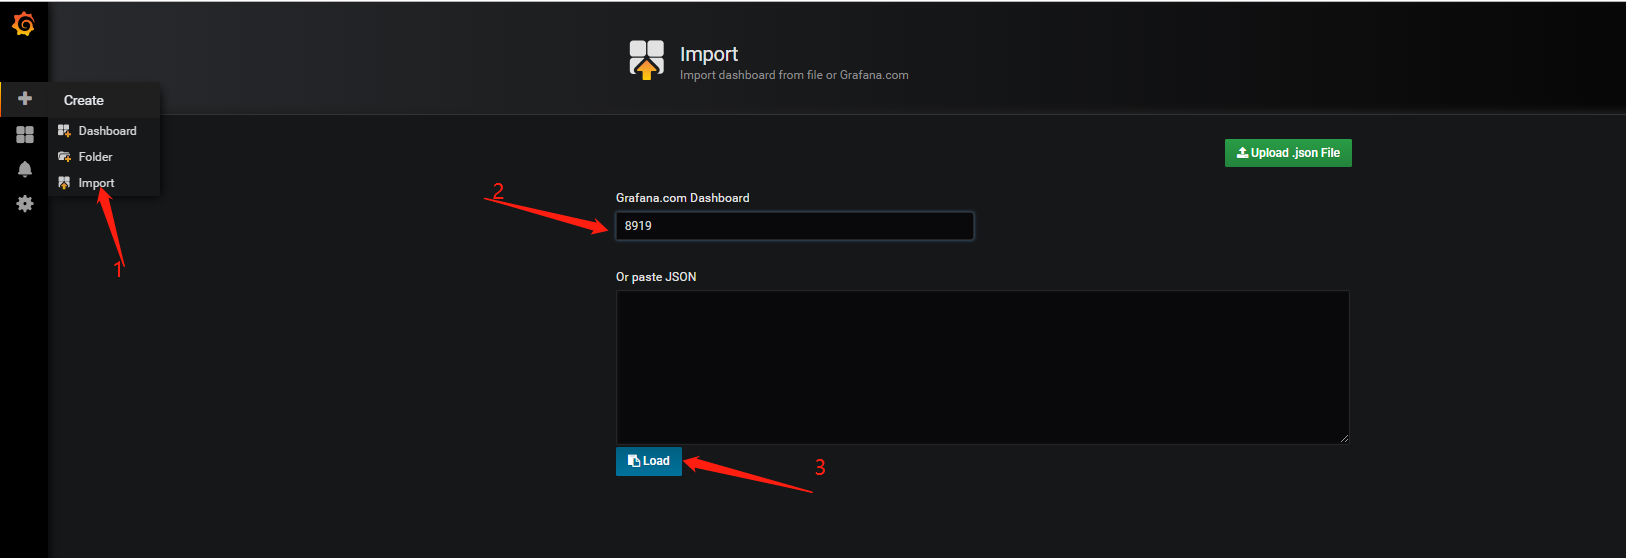
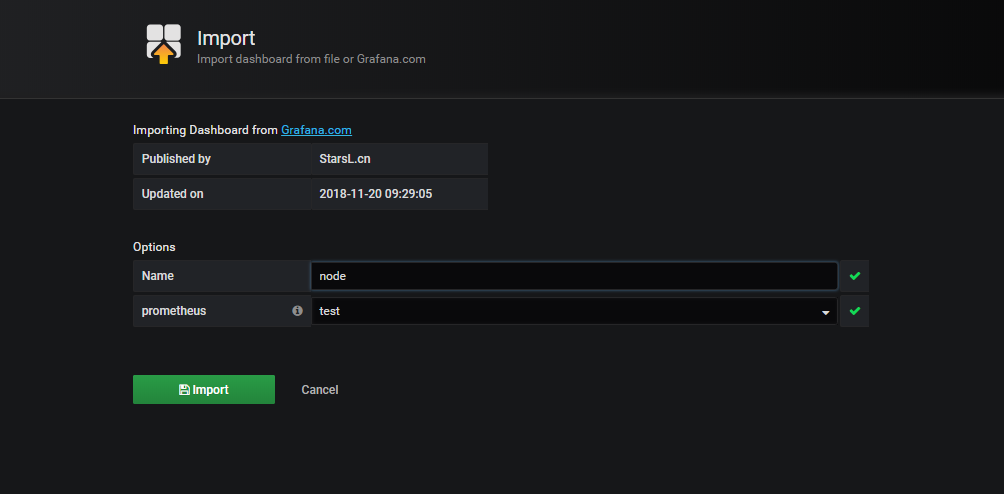
6.在grafana中查看配置状态(推荐使用8919)
7.效果图如下:

posted on 2019-06-18 20:19 ExplorerMan 阅读(530) 评论(0) 收藏 举报


 浙公网安备 33010602011771号