
谁记录了mysql error log中的超长信息
【问题】
最近查看MySQL的error log文件时,发现有很多服务器的文件中有大量的如下日志,内容很长(大小在200K左右),从记录的内容看,并没有明显的异常信息。
有一台测试服务器也有类似的问题,为什么会记录这些信息,是谁记录的这些信息,分析的过程比较周折。
Status information:
Current dir:
Running threads: 2452 Stack size: 262144
Current locks:
lock: 0x7f783f5233f0:
Key caches:
default
Buffer_size: 8388608
Block_size: 1024
Division_limit: 100
Age_limit: 300
blocks used: 10
not flushed: 0
w_requests: 6619
writes: 1
r_requests: 275574
reads: 1235
handler status:
read_key: 32241480828
read_next: 451035381896
read_rnd 149361175
read_first: 1090473
write: 4838429521
delete 12155820
update: 3331297842
【分析过程】
1、首先在官方文档中查到,当mysqld进程收到SIGHUP信号量时,就会输出类似的信息,
On Unix, signals can be sent to processes. mysqld responds to signals sent to it as follows:
SIGHUP causes the server to reload the grant tables and to flush tables, logs, the thread cache, and the host cache. These actions are like various forms of the FLUSH statement. The server also writes a status report to the error log that has this format:
https://dev.mysql.com/doc/refman/5.6/en/server-signal-response.html
2、有别的程序在kill mysqld进程吗,用systemtap脚本监控kill命令
probe nd_syscall.kill
{
target[tid()] = uint_arg(1);
signal[tid()] = uint_arg(2);
}
probe nd_syscall.kill.return
{
if (target[tid()] != 0) {
printf("%-6d %-12s %-5d %-6d %6d\n", pid(), execname(),
signal[tid()], target[tid()], int_arg(1));
delete target[tid()];
delete signal[tid()];
}
}
用下面命令测试,确实会在error log中记录日志
kill -SIGHUP 12455
从systemtap的输出看到12455就是mysqld进程,被kill掉了,信号量是1,对应的就是SIGHUP
不过在测试环境后面问题重现时,却没有抓到SIGHUP的信号量。
FROM COMMAND SIG TO RESULT
17010 who 0 12153 1340429600
36681 bash 1 12455 642
3、看来并不是kill导致的,后面用gdb attach到mysqld进程上,在error log的三个入口函数sql_print_error,sql_print_warning,sql_print_information加上断点
但是在问题重现时,程序并没有停在断点处
4、写error log还有别的分支吗,翻源码找到了答案,原来是通过mysql_print_status函数直接写到error log中
void mysql_print_status()
{
char current_dir[FN_REFLEN];
STATUS_VAR current_global_status_var;
printf("\nStatus information:\n\n");
(void) my_getwd(current_dir, sizeof(current_dir),MYF(0));
printf("Current dir: %s\n", current_dir);
printf("Running threads: %u Stack size: %ld\n",
Global_THD_manager::get_instance()->get_thd_count(),
(long) my_thread_stack_size);
…
puts("");
fflush(stdout);
}
5、再次用gdb attach到mysqld进程上,在mysql_print_status函数上加断点,在问题重现时,线程停在断点处,通过ps的结果多次对比,判断是pt-stalk工具运行时调用了mysql_print_status
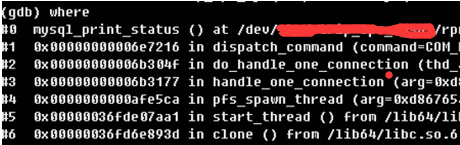
6、从堆栈中看到dispatch_command调用了mysql_print_status,下面是具体的逻辑,当command=COM_DEBUG时就会执行到mysql_print_status
case COM_DEBUG:
thd->status_var.com_other++;
if (check_global_access(thd, SUPER_ACL))
break; /* purecov: inspected */
mysql_print_status();
query_logger.general_log_print(thd, command, NullS);
my_eof(thd);
break;
7、查看pt-stalk的代码
if [ "$mysql_error_log" -a ! "$OPT_MYSQL_ONLY" ]; then
log "The MySQL error log seems to be $mysql_error_log"
tail -f "$mysql_error_log" >"$d/$p-log_error" &
tail_error_log_pid=$!
$CMD_MYSQLADMIN $EXT_ARGV debug
else
log "Could not find the MySQL error log"
在调用mysqladmin时使用了debug模式
debug Instruct server to write debug information to log
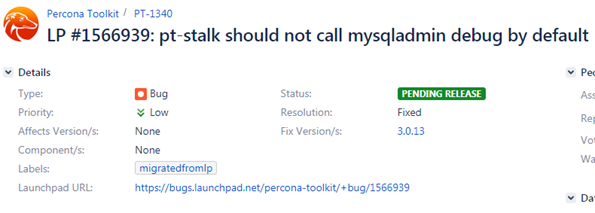
8、在percona官网上搜到了相关的bug描述,目前bug还未修复,会在下个版本中3.0.13中修复。
https://jira.percona.com/browse/PT-1340
【解决方案】
定位到问题后,实际修复也比较简单,将pt-stalk脚本中$CMD_MYSQLADMIN $EXT_ARGV debug中的debug去掉就可以了,测试生效。
总结:
(1) 通过mysql_print_status函数直接写到error log中
(2) 执行mysqladmin debug
(3) 资源紧张,kill session等 (同时参考: https://dev.mysql.com/doc/refman/5.7/en/server-signal-response.html)
Status information:
Current dir: /data/mysql/mysql3306/data/
Running threads: 7 Stack size: 262144
Current locks:
lock: 0x7fdcb0a44780:
lock: 0x7fdcaf0ea980:
lock: 0x1edb5a0:
..........
..........
Key caches:
default
Buffer_size: 8388608
Block_size: 1024
Division_limit: 100
Age_limit: 300
blocks used: 9
not flushed: 0
w_requests: 0
writes: 0
r_requests: 82
reads: 13
handler status:
read_key: 16981474
read_next: 33963080
read_rnd 6
read_first: 192
write: 21270
delete 0
update: 16981221
Table status:
Opened tables: 956
Open tables: 206
Open files: 13
Open streams: 0
Memory status:
<malloc version="1">
<heap nr="0">
<sizes>
<unsorted from="140586808432240" to="140585778669336" total="0" count="140585778669312"/>
</sizes>
<total type="fast" count="0" size="0"/>
<total type="rest" count="0" size="0"/>
<system type="current" size="0"/>
<system type="max" size="0"/>
<aspace type="total" size="0"/>
<aspace type="mprotect" size="0"/>
</heap>
<total type="fast" count="0" size="0"/>
<total type="rest" count="0" size="0"/>
<total type="mmap" count="0" size="0"/>
<system type="current" size="0"/>
<system type="max" size="0"/>
<aspace type="total" size="0"/>
<aspace type="mprotect" size="0"/>
</malloc>
Events status:
LLA = Last Locked At LUA = Last Unlocked At
WOC = Waiting On Condition DL = Data Locked
Event scheduler status:
State : INITIALIZED
Thread id : 0
LLA : n/a:0
LUA : n/a:0
WOC : NO
Workers : 0
Executed : 0
Data locked: NO
Event queue status:
Element count : 0
Data locked : NO
Attempting lock : NO
LLA : init_queue:96
LUA : init_queue:104
WOC : NO
Next activation : never

 浙公网安备 33010602011771号