
Java堆分析 jmap+jhat
最近在使用DataSync做数据迁移,执行了10天+,进程还未结束,也未出现错误日志,所以就看看是不是哪里卡住了...
jmap命令基本解析:
-dump:[live,]format=b,file=<filename> 使用hprof二进制形式,输出jvm的heap内容到文件=. live子选项是可选的,假如指定live选项,那么只输出活的对象到文件.

-finalizerinfo 打印正等候回收的对象的信息.

-heap 打印heap的概要信息,GC使用的算法,heap的配置及wise heap的使用情况.

-histo[:live] 打印每个class的实例数目,内存占用,类全名信息. VM的内部类名字开头会加上前缀”*”. 如果live子参数加上后,只统计活的对象数量.

-clstats 打印classload和jvm heap长久层的信息. 包含每个classloader的名字,活泼性,地址,父classloader和加载的class数量. 另外,内部String的数量和占用内存数也会打印出来.
(-clstats是-permstat的替代方案,在JDK8之前,-permstat用来打印类加载器的数据)

-F 强迫.在pid没有相应的时候使用-dump或者-histo参数. 在这个模式下,live子参数无效.

-h | -help 打印辅助信息

-J 传递参数给jmap启动的jvm.
使用详情:
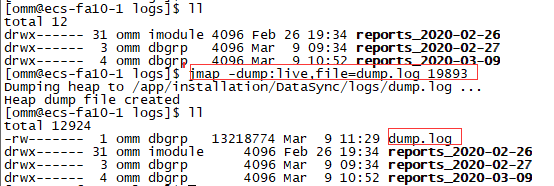
>>>先找到pid(linux环境)
ps -ef|grep java

由上图可知 pid为 : 19893
1.将JVM的堆内容输入到当前目录的dump.log文件中( live子选项是可选的,假如指定live选项,那么只输出活的对象到文件. )
jmap -dump:live,file=dump.log 19893
输出结果:
Dumping heap to /app/installation/DataSync/logs/dump.log ...
Heap dump file created
2.使用jhat命令分析dump.log文件
jhat dump.log
输出结果:
Reading from dump.log...
Dump file created Mon Mar 09 09:48:50 CST 2020
Snapshot read, resolving...
Resolving 110219 objects...
Chasing references, expect 22 dots......................
Eliminating duplicate references......................
Snapshot resolved.
Started HTTP server on port 7000
Server is ready.

使用浏览器访问堆分析地址: http://localhost:7000 (localhost替换为服务器ip)

将右侧的下拉框拖到最后:
Other Queries
All classes including platform  #显示出堆中包含的所有的类
Show all members of the rootset #从根集能引用到的对象
Show instance counts for all classes (including platform) #显示所有的实例数量(包括平台)
Show instance counts for all classes (excluding platform) #显示所有实例的数量(平台除外)
Show heap histogram #显示堆的统计信息
Show finalizer summary #正在回收的对象统计
Execute Object Query Language (OQL) query #执行对象查询语句 (eg:select a from oracle.jdbc.driver.SQLStateMapping a)
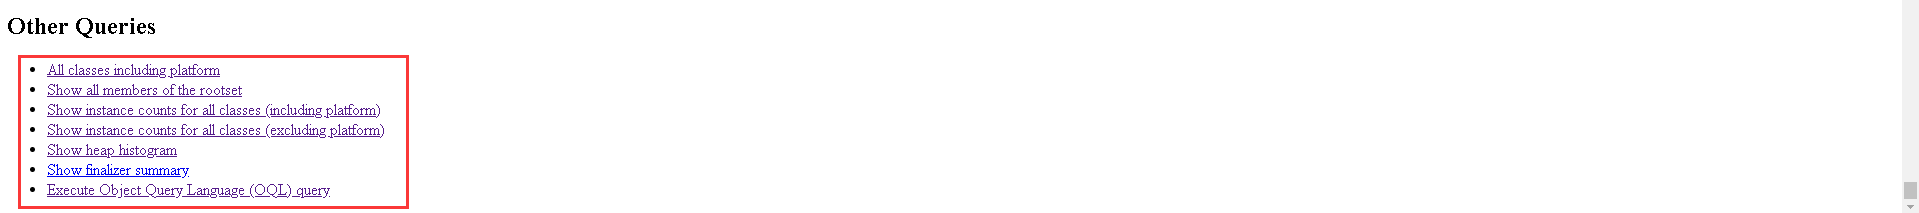
我们主要看一下堆的统计信息:
3.-finalizerinfo 打印正等候回收的对象的信息.
jmap -finalizerinfo 19893
输出结果:
Attaching to process ID 19893, please wait...
Debugger attached successfully.
Server compiler detected.
JVM version is 25.221-b11
Number of objects pending for finalization: 0
4.-heap 打印heap的概要信息,GC使用的算法,heap的配置及wise heap的使用情况.
jmap -heap 19893
输出结果:
Attaching to process ID 19893, please wait...
Debugger attached successfully.
Server compiler detected.
JVM version is 25.221-b11

using thread-local object allocation.
Parallel GC with 8 thread(s)

Heap Configuration:
MinHeapFreeRatio = 0 # -Xmn 默认(MinHeapFreeRatio参数可以调整)空余堆内存小于40%时,这里设置为0%,JVM就会增大堆直到-Xmx的最大限制.
MaxHeapFreeRatio = 100 # -Xmx 默认(MaxHeapFreeRatio参数可以调整)空余堆内存大于70%时,这里设置为100%,JVM会减少堆直到 -Xms的最小限制
MaxHeapSize = 8392802304 (8004.0MB) #
NewSize = 175112192 (167.0MB) #年轻代大小
MaxNewSize = 2797600768 (2668.0MB) #最大年轻代大小
OldSize = 351272960 (335.0MB) #
NewRatio = 2 #年轻代(包括Eden和两个Survivor区)与年老代的比值(除去持久代)
SurvivorRatio = 8 # Eden区与Survivor区的大小比值
MetaspaceSize = 21807104 (20.796875MB)
CompressedClassSpaceSize = 1073741824 (1024.0MB)
MaxMetaspaceSize = 17592186044415 MB
G1HeapRegionSize = 0 (0.0MB)

Heap Usage:
PS Young Generation
Eden Space:
capacity = 174063616 (166.0MB)
used = 2929112 (2.7934188842773438MB)
free = 171134504 (163.20658111572266MB)
1.6827824604080384% used
From Space:
capacity = 524288 (0.5MB)
used = 0 (0.0MB)
free = 524288 (0.5MB)
0.0% used
To Space:
capacity = 524288 (0.5MB)
used = 0 (0.0MB)
free = 524288 (0.5MB)
0.0% used
PS Old Generation
capacity = 378535936 (361.0MB)
used = 6553576 (6.249977111816406MB)
free = 371982360 (354.7500228881836MB)
1.7312955988411098% used

11013 interned Strings occupying 980480 bytes.
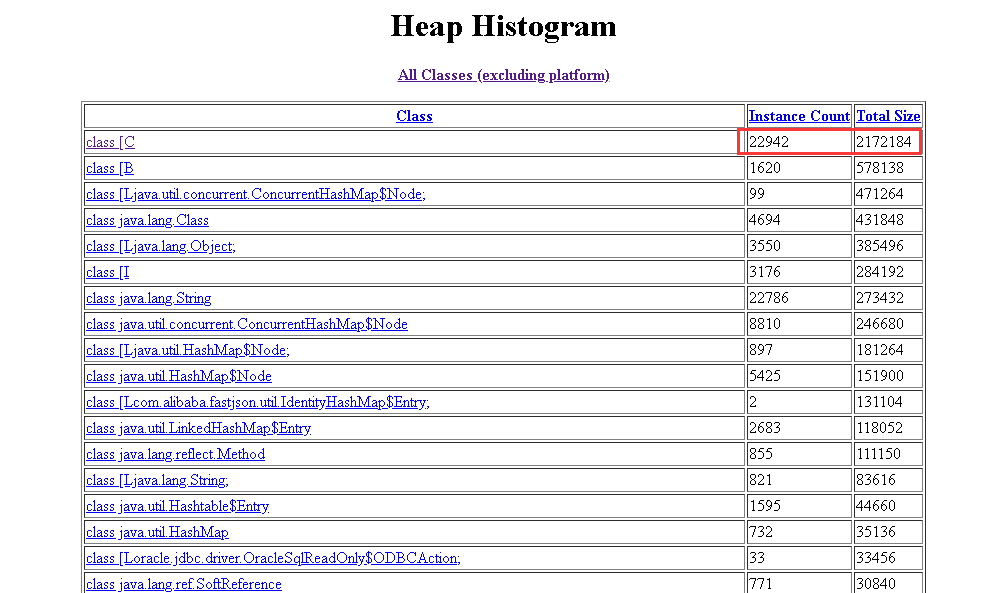
5.-histo[:live] 打印每个class的实例数目,内存占用,类全名信息. VM的内部类名字开头会加上前缀”*”. 如果live子参数加上后,只统计活的对象数量.
jmap -histo:live 19893
输出结果:
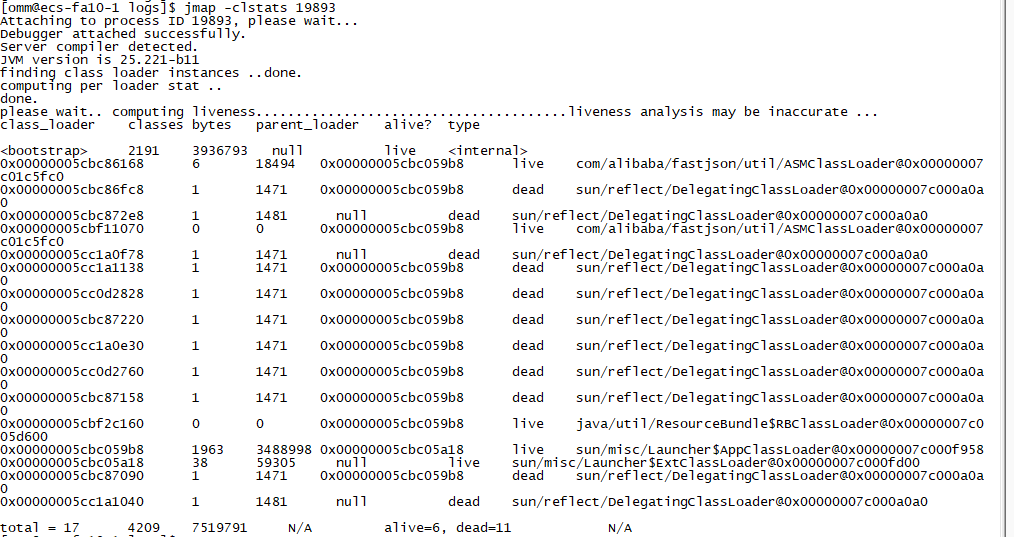
6.-clstats 打印classload和jvm heap长久层的信息. 包含每个classloader的名字,活泼性,地址,父classloader和加载的class数量. 另外,内部String的数量和占用内存数也会打印出来.
jmap -clstats 19893
输出结果:
jps主要用来输出JVM中运行的进程状态信息
$ jps
19893 jar
31289 Jps
$ jps -q # 只显示pid,不显示class名称,jar文件名和传递给main方法的参数
19893
31385
$ jps -m #输出传递给main方法的参数,在嵌入式jvm上可能是null
19893 jar -i config/exp_obj.ini
31413 Jps -m
$ jps -l #输出应用程序main class的完整package名或者应用程序的jar文件完整路径名
19893 DSS.jar
31433 sun.tools.jps.Jps
$ jps -v #输出jvm参数
19893 jar
31527 Jps -Dapplication.home=/usr/java/jdk1.8.0_221-amd64 -Xms8m
jstack主要用来查看某个Java进程内的线程堆栈信息
jstack 19893
输出结果:
2020-03-09 12:29:12
Full thread dump Java HotSpot(TM) 64-Bit Server VM (25.221-b11 mixed mode):

"Attach Listener" #30 daemon prio=9 os_prio=0 tid=0x00007faa98001000 nid=0x690d waiting on condition [0x0000000000000000]
   java.lang.Thread.State: RUNNABLE

"process reaper" #29 daemon prio=10 os_prio=0 tid=0x00007faa5800d800 nid=0x31a1 runnable [0x00007faadc054000]
   java.lang.Thread.State: RUNNABLE
        at java.lang.UNIXProcess.waitForProcessExit(Native Method)
        at java.lang.UNIXProcess.lambda$initStreams$3(UNIXProcess.java:289)
        at java.lang.UNIXProcess$$Lambda$13/1293226111.run(Unknown Source)
        at java.util.concurrent.ThreadPoolExecutor.runWorker(ThreadPoolExecutor.java:1149)
        at java.util.concurrent.ThreadPoolExecutor$Worker.run(ThreadPoolExecutor.java:624)
        at java.lang.Thread.run(Thread.java:748)

"synctask" #20 prio=5 os_prio=0 tid=0x00007faa60014800 nid=0x5207 runnable [0x00007faa9c8cf000]
   java.lang.Thread.State: RUNNABLE
        at java.io.FileInputStream.readBytes(Native Method)
        at java.io.FileInputStream.read(FileInputStream.java:255)
        at java.io.BufferedInputStream.read1(BufferedInputStream.java:284)
        at java.io.BufferedInputStream.read(BufferedInputStream.java:345)
        - locked <0x00000005cc231568> (a java.lang.UNIXProcess$ProcessPipeInputStream)
        at sun.nio.cs.StreamDecoder.readBytes(StreamDecoder.java:284)
        at sun.nio.cs.StreamDecoder.implRead(StreamDecoder.java:326)
        at sun.nio.cs.StreamDecoder.read(StreamDecoder.java:178)
        - locked <0x00000005cc235600> (a java.io.InputStreamReader)
        at java.io.InputStreamReader.read(InputStreamReader.java:184)
        at java.io.BufferedReader.fill(BufferedReader.java:161)
        at java.io.BufferedReader.readLine(BufferedReader.java:324)
        - locked <0x00000005cc235600> (a java.io.InputStreamReader)
        at java.io.BufferedReader.readLine(BufferedReader.java:389)
        at com.huawei.dss.common.util.ProcessUtil.execute(ProcessUtil.java:49)
        at com.huawei.dss.syncmgr.importtask.LoadImportCommon.doLoad(LoadImportCommon.java:254)
        at com.huawei.dss.syncmgr.importtask.LoadImportCommon.doImport(LoadImportCommon.java:170)
        at com.huawei.dss.syncmgr.taskthread.FullMigrateThread.doTask(FullMigrateThread.java:101)
        at com.huawei.dss.syncmgr.taskthread.FullMigrateThread.run(FullMigrateThread.java:82)
        at java.util.concurrent.ThreadPoolExecutor.runWorker(ThreadPoolExecutor.java:1149)
        at java.util.concurrent.ThreadPoolExecutor$Worker.run(ThreadPoolExecutor.java:624)
        at java.lang.Thread.run(Thread.java:748)

"pool-2-thread-1" #18 prio=5 os_prio=0 tid=0x00007faaf8b4b800 nid=0x5204 waiting on condition [0x00007faa9cad1000]
   java.lang.Thread.State: TIMED_WAITING (sleeping)
        at java.lang.Thread.sleep(Native Method)
        at com.huawei.dss.syncmgr.TaskDispatcher.waitThreadPoolTerminated(TaskDispatcher.java:245)
        at com.huawei.dss.syncmgr.TaskDispatcher.dispatcher(TaskDispatcher.java:136)
        at com.huawei.dss.schedule.schedule.SyncDataThread.run(SyncDataThread.java:23)
        at java.util.concurrent.Executors$RunnableAdapter.call(Executors.java:511)
        at java.util.concurrent.FutureTask.run(FutureTask.java:266)
        at java.util.concurrent.ThreadPoolExecutor.runWorker(ThreadPoolExecutor.java:1149)
        at java.util.concurrent.ThreadPoolExecutor$Worker.run(ThreadPoolExecutor.java:624)
        at java.lang.Thread.run(Thread.java:748)

"InterruptTimer" #16 daemon prio=5 os_prio=0 tid=0x00007faaf8aaf000 nid=0x4e1f in Object.wait() [0x00007faa9d1d2000]
   java.lang.Thread.State: WAITING (on object monitor)
        at java.lang.Object.wait(Native Method)
        - waiting on <0x00000005cbc0cbf8> (a java.util.TaskQueue)
        at java.lang.Object.wait(Object.java:502)
        at java.util.TimerThread.mainLoop(Timer.java:526)
        - locked <0x00000005cbc0cbf8> (a java.util.TaskQueue)
        at java.util.TimerThread.run(Timer.java:505)

"oracle.jdbc.driver.BlockSource.ThreadedCachingBlockSource.BlockReleaser" #15 daemon prio=4 os_prio=0 tid=0x00007faaf8a7b000 nid=0x4e1e in Object.wait() [0x00007faa9d2d3000]
   java.lang.Thread.State: TIMED_WAITING (on object monitor)
        at java.lang.Object.wait(Native Method)
        at oracle.jdbc.driver.BlockSource$ThreadedCachingBlockSource$BlockReleaser.run(BlockSource.java:329)
        - locked <0x00000005cbc05788> (a oracle.jdbc.driver.BlockSource$ThreadedCachingBlockSource$BlockReleaser)

"Timer-0" #14 daemon prio=5 os_prio=0 tid=0x00007faaf8a77800 nid=0x4e1d in Object.wait() [0x00007faa9d3d4000]
   java.lang.Thread.State: WAITING (on object monitor)
        at java.lang.Object.wait(Native Method)
        - waiting on <0x00000005cbc142f0> (a java.util.TaskQueue)
        at java.lang.Object.wait(Object.java:502)
        at java.util.TimerThread.mainLoop(Timer.java:526)
        - locked <0x00000005cbc142f0> (a java.util.TaskQueue)
        at java.util.TimerThread.run(Timer.java:505)

"Abandoned connection cleanup thread" #13 daemon prio=5 os_prio=0 tid=0x00007faaf88fa800 nid=0x4e1c in Object.wait() [0x00007faa9d6d5000]
   java.lang.Thread.State: TIMED_WAITING (on object monitor)
        at java.lang.Object.wait(Native Method)
        at java.lang.ref.ReferenceQueue.remove(ReferenceQueue.java:144)
        - locked <0x00000005cbc1d410> (a java.lang.ref.ReferenceQueue$Lock)
        at com.mysql.jdbc.AbandonedConnectionCleanupThread.run(AbandonedConnectionCleanupThread.java:64)
        at java.util.concurrent.ThreadPoolExecutor.runWorker(ThreadPoolExecutor.java:1149)
        at java.util.concurrent.ThreadPoolExecutor$Worker.run(ThreadPoolExecutor.java:624)
        at java.lang.Thread.run(Thread.java:748)

"zenith.jdbc.cancelTimer" #12 daemon prio=5 os_prio=0 tid=0x00007faaf88b8000 nid=0x4e1b in Object.wait() [0x00007faab018a000]
   java.lang.Thread.State: WAITING (on object monitor)
        at java.lang.Object.wait(Native Method)
        - waiting on <0x00000005cbc0cd90> (a java.util.TaskQueue)
        at java.lang.Object.wait(Object.java:502)
        at java.util.TimerThread.mainLoop(Timer.java:526)
        - locked <0x00000005cbc0cd90> (a java.util.TaskQueue)
        at java.util.TimerThread.run(Timer.java:505)

"Service Thread" #9 daemon prio=9 os_prio=0 tid=0x00007faaf821a800 nid=0x4dc7 runnable [0x0000000000000000]
   java.lang.Thread.State: RUNNABLE

"C1 CompilerThread3" #8 daemon prio=9 os_prio=0 tid=0x00007faaf820f000 nid=0x4dc6 waiting on condition [0x0000000000000000]
   java.lang.Thread.State: RUNNABLE

"C2 CompilerThread2" #7 daemon prio=9 os_prio=0 tid=0x00007faaf820d000 nid=0x4dc5 waiting on condition [0x0000000000000000]
   java.lang.Thread.State: RUNNABLE

"C2 CompilerThread1" #6 daemon prio=9 os_prio=0 tid=0x00007faaf820b000 nid=0x4dc4 waiting on condition [0x0000000000000000]
   java.lang.Thread.State: RUNNABLE

"C2 CompilerThread0" #5 daemon prio=9 os_prio=0 tid=0x00007faaf8208000 nid=0x4dc3 waiting on condition [0x0000000000000000]
   java.lang.Thread.State: RUNNABLE

"Signal Dispatcher" #4 daemon prio=9 os_prio=0 tid=0x00007faaf8206800 nid=0x4dc2 runnable [0x0000000000000000]
   java.lang.Thread.State: RUNNABLE

"Finalizer" #3 daemon prio=8 os_prio=0 tid=0x00007faaf81d3800 nid=0x4dc1 in Object.wait() [0x00007faae416a000]
   java.lang.Thread.State: WAITING (on object monitor)
        at java.lang.Object.wait(Native Method)
        at java.lang.ref.ReferenceQueue.remove(ReferenceQueue.java:144)
        - locked <0x00000005cbc0d7f8> (a java.lang.ref.ReferenceQueue$Lock)
        at java.lang.ref.ReferenceQueue.remove(ReferenceQueue.java:165)
        at java.lang.ref.Finalizer$FinalizerThread.run(Finalizer.java:216)

"Reference Handler" #2 daemon prio=10 os_prio=0 tid=0x00007faaf81d1000 nid=0x4dc0 in Object.wait() [0x00007faae426b000]
   java.lang.Thread.State: WAITING (on object monitor)
        at java.lang.Object.wait(Native Method)
        at java.lang.Object.wait(Object.java:502)
        at java.lang.ref.Reference.tryHandlePending(Reference.java:191)
        - locked <0x00000005cbc24210> (a java.lang.ref.Reference$Lock)
        at java.lang.ref.Reference$ReferenceHandler.run(Reference.java:153)

"main" #1 prio=5 os_prio=0 tid=0x00007faaf8009800 nid=0x4db6 waiting on condition [0x00007faaff887000]
   java.lang.Thread.State: TIMED_WAITING (sleeping)
        at java.lang.Thread.sleep(Native Method)
        at com.huawei.dss.schedule.schedule.ScheduleEngine.querySyncJob(ScheduleEngine.java:261)
        at com.huawei.dss.schedule.schedule.ScheduleEngine.startSyncJob(ScheduleEngine.java:145)
        at com.huawei.dss.schedule.DssEntrance.entry(DssEntrance.java:158)
        at com.huawei.dss.schedule.DssEntrance.main(DssEntrance.java:103)

"VM Thread" os_prio=0 tid=0x00007faaf81c7000 nid=0x4dbf runnable

"GC task thread#0 (ParallelGC)" os_prio=0 tid=0x00007faaf801e800 nid=0x4db7 runnable

"GC task thread#1 (ParallelGC)" os_prio=0 tid=0x00007faaf8020800 nid=0x4db8 runnable

"GC task thread#2 (ParallelGC)" os_prio=0 tid=0x00007faaf8022800 nid=0x4db9 runnable

"GC task thread#3 (ParallelGC)" os_prio=0 tid=0x00007faaf8024000 nid=0x4dba runnable

"GC task thread#4 (ParallelGC)" os_prio=0 tid=0x00007faaf8026000 nid=0x4dbb runnable

"GC task thread#5 (ParallelGC)" os_prio=0 tid=0x00007faaf8027800 nid=0x4dbc runnable

"GC task thread#6 (ParallelGC)" os_prio=0 tid=0x00007faaf8029800 nid=0x4dbd runnable

"GC task thread#7 (ParallelGC)" os_prio=0 tid=0x00007faaf802b800 nid=0x4dbe runnable

"VM Periodic Task Thread" os_prio=0 tid=0x00007faaf821d000 nid=0x4dc8 waiting on condition

JNI global references: 256
 posted on

 浙公网安备 33010602011771号