九、chart控件的使用(图表数据的展示)
chart属于老插件网上还有新的插件功能也更多)
Chart控件是VS自带的控件,只是比较老了,功能肯定不如现在出来的某些插件强,不过对于简单的显示还是够用;那么现在来看看chart控件的使用方法:
1.ChartAreas属性
ChartAreas属性指绘图区,一个控件可以有多个绘图区,比如我要在同一个控件内显示饼图和柱状图,肯定不能放在同一个ChartAreas区域内,应该在同一个Chart控件里增加两个ChartAreas并分别绑定Series对象。所以ChartAreas属性对应的是一个集合。
2.Series属性
Series属性就是各种图表的图形啦,比如我们要显示某月的天气变化,那么应该有这样两组数据,一组是天数,一组是每天对应的温度值,同时绑定到Series对象中,再将Series对象Add()到Chart控件的Series属性里即可。为了横向比较,例如我要看本月与上月的天气曲线变化图,并同时显示在同一个ChartAreas中,那该怎么办呢?很简单,再实例一个Series对象,将上月的天数数组与温度值数组绑定到一个新的Series2实例中,再将Series2实例Add()到Chart控件的Series属性里,此时,Chart控件的第一个绘图区ChartArea里就会有两条曲线。
3.Legends属性
Legend就是指一个图标的图例,当一个Series属性有多个Series时,或是一个Series有几组数据时,为了区分各自的颜色,通常每个Serie对象一种颜色,这就需要用到图例来指明哪个颜色的代表的是什么数据。如下图所示:
4.关于数据的绑定
将要显示的X轴和Y轴的数据分别放到两个数组里在, 然后绑定即可。
cht1.Series[0].Points.DataBindXY(x, y);
完整的代码如下:
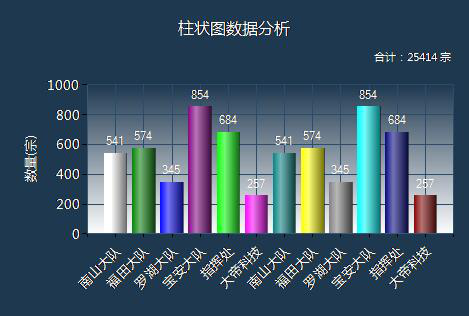
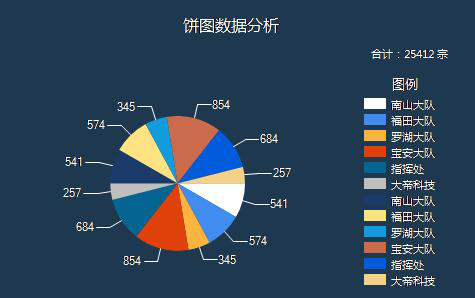
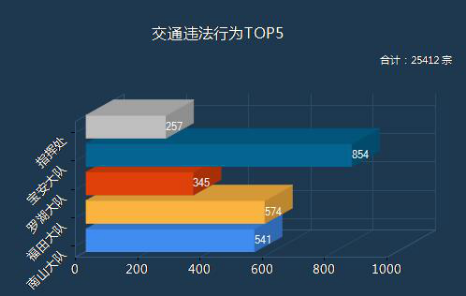
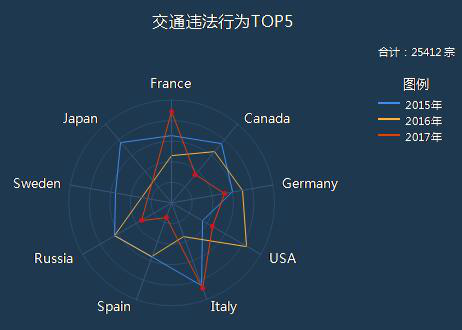
using System;

using System.Collections.Generic;

using System.Linq;

using System.Web;

using System.Web.UI;

using System.Web.UI.WebControls;

using System.Drawing;

using System.Web.UI.DataVisualization.Charting;


public partial class _Default : System.Web.UI.Page

{

    protected void Page_Load(object sender, EventArgs e)

    {

        string[] x = new string[] { "南山大队", "福田大队", "罗湖大队", "宝安大队", "指挥处", "大帝科技", "南山大队", "福田大队", "罗湖大队", "宝安大队", "指挥处", "大帝科技"};

        double[] y = new double[] { 541, 574, 345, 854, 684, 257, 541, 574, 345, 854, 684, 257 };

        string[] z = new string[] { "", "", "", "", "", "", "", "", "", "", "", "" };


        string[] a = new string[] { "南山大队", "福田大队", "罗湖大队", "宝安大队", "指挥处", };

        double[] b = new double[] { 541, 574, 345, 854, 257 };


        #region 柱状图


        //标题

        cht1.Titles.Add("柱状图数据分析");

        cht1.Titles[0].ForeColor = Color.White;

        cht1.Titles[0].Font = new Font("微软雅黑", 12f, FontStyle.Regular);

        cht1.Titles[0].Alignment = ContentAlignment.TopCenter;

        cht1.Titles.Add("合计:25414 宗");

        cht1.Titles[1].ForeColor = Color.White;

        cht1.Titles[1].Font = new Font("微软雅黑", 8f, FontStyle.Regular);

        cht1.Titles[1].Alignment = ContentAlignment.TopRight;


        //控件背景

        cht1.BackColor = Color.Transparent;

        //图表区背景

        cht1.ChartAreas[0].BackColor = Color.Transparent;

        cht1.ChartAreas[0].BorderColor = Color.Transparent;

        //X轴标签间距

        cht1.ChartAreas[0].AxisX.Interval = 1;

        cht1.ChartAreas[0].AxisX.LabelStyle.IsStaggered = true;

        cht1.ChartAreas[0].AxisX.LabelStyle.Angle = -45;

        cht1.ChartAreas[0].AxisX.TitleFont = new Font("微软雅黑", 14f, FontStyle.Regular);

        cht1.ChartAreas[0].AxisX.TitleForeColor = Color.White;


        //X坐标轴颜色

        cht1.ChartAreas[0].AxisX.LineColor = ColorTranslator.FromHtml("#38587a"); ;

        cht1.ChartAreas[0].AxisX.LabelStyle.ForeColor = Color.White;

        cht1.ChartAreas[0].AxisX.LabelStyle.Font = new Font("微软雅黑", 10f, FontStyle.Regular);

        //X坐标轴标题

        //cht1.ChartAreas[0].AxisX.Title = "数量(宗)";

        //cht1.ChartAreas[0].AxisX.TitleFont = new Font("微软雅黑", 10f, FontStyle.Regular);

        //cht1.ChartAreas[0].AxisX.TitleForeColor = Color.White;

        //cht1.ChartAreas[0].AxisX.TextOrientation = TextOrientation.Horizontal;

        //cht1.ChartAreas[0].AxisX.ToolTip = "数量(宗)";

        //X轴网络线条

        cht1.ChartAreas[0].AxisX.MajorGrid.Enabled = true;

        cht1.ChartAreas[0].AxisX.MajorGrid.LineColor = ColorTranslator.FromHtml("#2c4c6d");


        //Y坐标轴颜色

        cht1.ChartAreas[0].AxisY.LineColor = ColorTranslator.FromHtml("#38587a");

        cht1.ChartAreas[0].AxisY.LabelStyle.ForeColor = Color.White;

        cht1.ChartAreas[0].AxisY.LabelStyle.Font = new Font("微软雅黑", 10f, FontStyle.Regular);

        //Y坐标轴标题

        cht1.ChartAreas[0].AxisY.Title = "数量(宗)";

        cht1.ChartAreas[0].AxisY.TitleFont = new Font("微软雅黑", 10f, FontStyle.Regular);

        cht1.ChartAreas[0].AxisY.TitleForeColor = Color.White;

        cht1.ChartAreas[0].AxisY.TextOrientation = TextOrientation.Rotated270;

        cht1.ChartAreas[0].AxisY.ToolTip = "数量(宗)";

        //Y轴网格线条

        cht1.ChartAreas[0].AxisY.MajorGrid.Enabled = true;

        cht1.ChartAreas[0].AxisY.MajorGrid.LineColor = ColorTranslator.FromHtml("#2c4c6d");


        cht1.ChartAreas[0].AxisY2.LineColor = Color.Transparent;

        cht1.ChartAreas[0].BackGradientStyle = GradientStyle.TopBottom;

        Legend legend = new Legend("legend");

        legend.Title = "legendTitle";


        cht1.Series[0].XValueType = ChartValueType.String;  //设置X轴上的值类型

        cht1.Series[0].Label = "#VAL";                //设置显示X Y的值

        cht1.Series[0].LabelForeColor = Color.White;

        cht1.Series[0].ToolTip = "#VALX:#VAL";     //鼠标移动到对应点显示数值

        cht1.Series[0].ChartType = SeriesChartType.Column;    //图类型(折线)


        cht1.Series[0].Color = Color.Lime;

        cht1.Series[0].LegendText = legend.Name;

        cht1.Series[0].IsValueShownAsLabel = true;

        cht1.Series[0].LabelForeColor = Color.White;

        cht1.Series[0].CustomProperties = "DrawingStyle = Cylinder";

        cht1.Legends.Add(legend);

        cht1.Legends[0].Position.Auto = false;


        //绑定数据

        cht1.Series[0].Points.DataBindXY(x, y);

        cht1.Series[0].Points[0].Color = Color.White;

        cht1.Series[0].Palette = ChartColorPalette.Bright;


        #endregion


        #region 饼图


        //标题

        cht2.Titles.Add("饼图数据分析");

        cht2.Titles[0].ForeColor = Color.White;

        cht2.Titles[0].Font = new Font("微软雅黑", 12f, FontStyle.Regular);

        cht2.Titles[0].Alignment = ContentAlignment.TopCenter;

        cht2.Titles.Add("合计:25412 宗");

        cht2.Titles[1].ForeColor = Color.White;

        cht2.Titles[1].Font = new Font("微软雅黑", 8f, FontStyle.Regular);

        cht2.Titles[1].Alignment = ContentAlignment.TopRight;


        //控件背景

        cht2.BackColor = Color.Transparent;

        //图表区背景

        cht2.ChartAreas[0].BackColor = Color.Transparent;

        cht2.ChartAreas[0].BorderColor = Color.Transparent;

        //X轴标签间距

        cht2.ChartAreas[0].AxisX.Interval = 1;

        cht2.ChartAreas[0].AxisX.LabelStyle.IsStaggered = true;

        cht2.ChartAreas[0].AxisX.LabelStyle.Angle = -45;

        cht2.ChartAreas[0].AxisX.TitleFont = new Font("微软雅黑", 14f, FontStyle.Regular);

        cht2.ChartAreas[0].AxisX.TitleForeColor = Color.White;


        //X坐标轴颜色

        cht2.ChartAreas[0].AxisX.LineColor = ColorTranslator.FromHtml("#38587a"); ;

        cht2.ChartAreas[0].AxisX.LabelStyle.ForeColor = Color.White;

        cht2.ChartAreas[0].AxisX.LabelStyle.Font = new Font("微软雅黑", 10f, FontStyle.Regular);

        //X坐标轴标题

        cht2.ChartAreas[0].AxisX.Title = "数量(宗)";

        cht2.ChartAreas[0].AxisX.TitleFont = new Font("微软雅黑", 10f, FontStyle.Regular);

        cht2.ChartAreas[0].AxisX.TitleForeColor = Color.White;

        cht2.ChartAreas[0].AxisX.TextOrientation = TextOrientation.Horizontal;

        cht2.ChartAreas[0].AxisX.ToolTip = "数量(宗)";

        //X轴网络线条

        cht2.ChartAreas[0].AxisX.MajorGrid.Enabled = true;

        cht2.ChartAreas[0].AxisX.MajorGrid.LineColor = ColorTranslator.FromHtml("#2c4c6d");


        //Y坐标轴颜色

        cht2.ChartAreas[0].AxisY.LineColor = ColorTranslator.FromHtml("#38587a");

        cht2.ChartAreas[0].AxisY.LabelStyle.ForeColor = Color.White;

        cht2.ChartAreas[0].AxisY.LabelStyle.Font = new Font("微软雅黑", 10f, FontStyle.Regular);

        //Y坐标轴标题

        cht2.ChartAreas[0].AxisY.Title = "数量(宗)";

        cht2.ChartAreas[0].AxisY.TitleFont = new Font("微软雅黑", 10f, FontStyle.Regular);

        cht2.ChartAreas[0].AxisY.TitleForeColor = Color.White;

        cht2.ChartAreas[0].AxisY.TextOrientation = TextOrientation.Rotated270;

        cht2.ChartAreas[0].AxisY.ToolTip = "数量(宗)";

        //Y轴网格线条

        cht2.ChartAreas[0].AxisY.MajorGrid.Enabled = true;

        cht2.ChartAreas[0].AxisY.MajorGrid.LineColor = ColorTranslator.FromHtml("#2c4c6d");


        cht2.ChartAreas[0].AxisY2.LineColor = Color.Transparent;


        //背景渐变

        cht2.ChartAreas[0].BackGradientStyle = GradientStyle.None;


        //图例样式

        Legend legend2 = new Legend("#VALX");

        legend2.Title = "图例";

        legend2.TitleBackColor = Color.Transparent;

        legend2.BackColor = Color.Transparent;

        legend2.TitleForeColor = Color.White;

        legend2.TitleFont = new Font("微软雅黑", 10f, FontStyle.Regular);

        legend2.Font = new Font("微软雅黑", 8f, FontStyle.Regular);

        legend2.ForeColor = Color.White;


        cht2.Series[0].XValueType = ChartValueType.String;  //设置X轴上的值类型

        cht2.Series[0].Label = "#VAL";                //设置显示X Y的值

        cht2.Series[0].LabelForeColor = Color.White;

        cht2.Series[0].ToolTip = "#VALX:#VAL(宗)";     //鼠标移动到对应点显示数值

        cht2.Series[0].ChartType = SeriesChartType.Pie;    //图类型(折线)

        cht2.Series[0].Color = Color.Lime;

        cht2.Series[0].LegendText = legend2.Name;

        cht2.Series[0].IsValueShownAsLabel = true;

        cht2.Series[0].LabelForeColor = Color.White;

        cht2.Series[0].CustomProperties = "DrawingStyle = Cylinder";

        cht2.Series[0].CustomProperties = "PieLabelStyle = Outside";

        cht2.Legends.Add(legend2);

        cht2.Legends[0].Position.Auto = true;

        cht2.Series[0].IsValueShownAsLabel = true;

        //是否显示图例

        cht2.Series[0].IsVisibleInLegend = true;

        cht2.Series[0].ShadowOffset = 0;


        //饼图折线

        cht2.Series[0]["PieLineColor"] = "White";

        //绑定数据

        cht2.Series[0].Points.DataBindXY(x, y);

        cht2.Series[0].Points[0].Color = Color.White;

        //绑定颜色

        cht2.Series[0].Palette = ChartColorPalette.BrightPastel;


        #endregion


        #region Bar图


        //标题

        cht3.Titles.Add("交通违法行为TOP5");

        cht3.Titles[0].ForeColor = Color.White;

        cht3.Titles[0].Font = new Font("微软雅黑", 12f, FontStyle.Regular);

        cht3.Titles[0].Alignment = ContentAlignment.TopCenter;

        cht3.Titles.Add("合计:25412 宗 ");

        cht3.Titles[1].ForeColor = Color.White;

        cht3.Titles[1].Font = new Font("微软雅黑", 8f, FontStyle.Regular);

        cht3.Titles[1].Alignment = ContentAlignment.TopRight;


        //控件背景

        cht3.BackColor = Color.Transparent;

        //图表区背景

        cht3.ChartAreas[0].BackColor = Color.Transparent;

        cht3.ChartAreas[0].BorderColor = Color.Transparent;

        //X轴标签间距

        cht3.ChartAreas[0].AxisX.Interval = 1;

        cht3.ChartAreas[0].AxisX.LabelStyle.IsStaggered = true;

        cht3.ChartAreas[0].AxisX.LabelStyle.Angle = -45;

        cht3.ChartAreas[0].AxisX.TitleFont = new Font("微软雅黑", 14f, FontStyle.Regular);

        cht3.ChartAreas[0].AxisX.TitleForeColor = Color.White;


        //X坐标轴颜色

        cht3.ChartAreas[0].AxisX.LineColor = ColorTranslator.FromHtml("#38587a"); ;

        cht3.ChartAreas[0].AxisX.LabelStyle.ForeColor = Color.White;

        cht3.ChartAreas[0].AxisX.LabelStyle.Font = new Font("微软雅黑", 10f, FontStyle.Regular);

        //X坐标轴标题

        //cht3.ChartAreas[0].AxisX.Title = "数量(宗)";

        //cht3.ChartAreas[0].AxisX.TitleFont = new Font("微软雅黑", 10f, FontStyle.Regular);

        //cht3.ChartAreas[0].AxisX.TitleForeColor = Color.White;

        //cht3.ChartAreas[0].AxisX.TextOrientation = TextOrientation.Auto;

        //cht3.ChartAreas[0].AxisX.ToolTip = "数量(宗)";

        //X轴网络线条

        cht3.ChartAreas[0].AxisX.MajorGrid.Enabled = true;

        cht3.ChartAreas[0].AxisX.MajorGrid.LineColor = ColorTranslator.FromHtml("#2c4c6d");


        //Y坐标轴颜色

        cht3.ChartAreas[0].AxisY.LineColor = ColorTranslator.FromHtml("#38587a");

        cht3.ChartAreas[0].AxisY.LabelStyle.ForeColor = Color.White;

        cht3.ChartAreas[0].AxisY.LabelStyle.Font = new Font("微软雅黑", 10f, FontStyle.Regular);

        //Y坐标轴标题

        //cht3.ChartAreas[0].AxisY.Title = "数量(宗)";

        //cht3.ChartAreas[0].AxisY.TitleFont = new Font("微软雅黑", 10f, FontStyle.Regular);

        //cht3.ChartAreas[0].AxisY.TitleForeColor = Color.White;

        //cht3.ChartAreas[0].AxisY.TextOrientation = TextOrientation.Auto;

        //cht3.ChartAreas[0].AxisY.ToolTip = "数量(宗)";

        //Y轴网格线条

        cht3.ChartAreas[0].AxisY.MajorGrid.Enabled = true;

        cht3.ChartAreas[0].AxisY.MajorGrid.LineColor = ColorTranslator.FromHtml("#2c4c6d");


        cht3.ChartAreas[0].AxisY2.LineColor = Color.Transparent;

        cht3.ChartAreas[0].AxisX.IsMarginVisible = false;

        cht3.ChartAreas[0].Area3DStyle.Enable3D = true;

        //背景渐变

        cht2.ChartAreas[0].BackGradientStyle = GradientStyle.None;


        //图例样式

        Legend legend3 = new Legend("#VALX");

        legend3.Title = "图例";

        legend3.TitleBackColor = Color.Transparent;

        legend3.BackColor = Color.Transparent;

        legend3.TitleForeColor = Color.White;

        legend3.TitleFont = new Font("微软雅黑", 10f, FontStyle.Regular);

        legend3.Font = new Font("微软雅黑", 8f, FontStyle.Regular);

        legend3.ForeColor = Color.White;


        cht3.Series[0].XValueType = ChartValueType.String;  //设置X轴上的值类型

        cht3.Series[0].Label = "#VAL";                //设置显示X Y的值

        cht3.Series[0].LabelForeColor = Color.White;

        cht3.Series[0].ToolTip = "#VALX:#VAL(宗)";     //鼠标移动到对应点显示数值

        cht3.Series[0].ChartType = SeriesChartType.Bar;    //图类型(折线)

        cht3.Series[0].Color = Color.Lime;

        //cht3.Series[0].LegendText = legend3.Name;

        cht3.Series[0].IsValueShownAsLabel = true;

        cht3.Series[0].LabelForeColor = Color.White;

        cht3.Series[0].CustomProperties = "DrawingStyle = Cylinder";

        cht3.Series[0].CustomProperties = "PieLabelStyle = Outside";

        //cht3.Legends.Add(legend3);

        //cht3.Legends[0].Position.Auto = true;


        //是否显示图例

        cht3.Series[0].IsVisibleInLegend = true;

        cht3.Series[0].ShadowOffset = 0;


        //饼图折线

        cht3.Series[0]["PieLineColor"] = "White";

        //绑定数据

        cht3.Series[0].Points.DataBindXY(a, b);


        //cht3.Series[0].Points[0].Color = Color.White;

        //绑定颜色

        cht3.Series[0].Palette = ChartColorPalette.BrightPastel;


        //for (int n = 0; n < x.Length; n++)

        //{

        //    int ptIdx = cht3.Series[0].Points.AddY(Convert.ToDouble(y[n]));

        //    DataPoint pt = this.cht3.Series[0].Points[ptIdx];

        //    pt.LegendText = x[n] + " " + "#PERCENT{P2}" + " [ " + "#VAL{D} 次" + " ]";//右边标签列显示的文字

        //    pt.Label = x[n] + " " + "#PERCENT{P2}" + " [ " + "#VAL{D} 次" + " ]"; //圆饼外显示的信息


        //    //  pt.LabelToolTip = "#PERCENT{P2}";

        //    //pt.LabelBorderColor = Color.Red;//文字背景色

        //}


        #endregion


        #region 雷达图


       // //标题

        cht4.Titles.Add("交通违法行为TOP5");

        cht4.Titles[0].ForeColor = Color.White;

        cht4.Titles[0].Font = new Font("微软雅黑", 12f, FontStyle.Regular);

        cht4.Titles[0].Alignment = ContentAlignment.TopCenter;

        cht4.Titles.Add("合计:25412 宗 ");

        cht4.Titles[1].ForeColor = Color.White;

        cht4.Titles[1].Font = new Font("微软雅黑", 8f, FontStyle.Regular);

        cht4.Titles[1].Alignment = ContentAlignment.TopRight;


        //控件背景

        cht4.BackColor = Color.Transparent;

        cht4.ChartAreas[0].BackColor = Color.Transparent;

        cht4.ChartAreas[0].BorderColor = Color.Transparent;

        //X轴标签间距

        cht4.ChartAreas[0].AxisX.Interval = 1;

        cht4.ChartAreas[0].AxisX.LabelStyle.IsStaggered = true;

        cht4.ChartAreas[0].AxisX.LabelStyle.Angle = -45;

        cht4.ChartAreas[0].AxisX.TitleFont = new Font("微软雅黑", 14f, FontStyle.Regular);

        cht4.ChartAreas[0].AxisX.TitleForeColor = Color.White;


        //X坐标轴颜色

        cht4.ChartAreas[0].AxisX.LineColor = ColorTranslator.FromHtml("#38587a"); ;

        cht4.ChartAreas[0].AxisX.LabelStyle.ForeColor = Color.White;

        cht4.ChartAreas[0].AxisX.LabelStyle.Font = new Font("微软雅黑", 10f, FontStyle.Regular);

        //X坐标轴标题

        //cht4.ChartAreas[0].AxisX.Title = "数量(宗)";

        //cht4.ChartAreas[0].AxisX.TitleFont = new Font("微软雅黑", 10f, FontStyle.Regular);

        //cht4.ChartAreas[0].AxisX.TitleForeColor = Color.White;

        //cht4.ChartAreas[0].AxisX.TextOrientation = TextOrientation.Auto;

        //cht4.ChartAreas[0].AxisX.ToolTip = "数量(宗)";

        //X轴网络线条

        cht4.ChartAreas[0].AxisX.MajorGrid.Enabled = true;

        cht4.ChartAreas[0].AxisX.MajorGrid.LineColor = ColorTranslator.FromHtml("#2c4c6d");


        //Y坐标轴颜色

        cht4.ChartAreas[0].AxisY.LineColor = ColorTranslator.FromHtml("#38587a");

        cht4.ChartAreas[0].AxisY.LabelStyle.ForeColor = Color.White;

        cht4.ChartAreas[0].AxisY.LabelStyle.Font = new Font("微软雅黑", 10f, FontStyle.Regular);

        //Y坐标轴标题

        //cht4.ChartAreas[0].AxisY.Title = "数量(宗)";

        //cht4.ChartAreas[0].AxisY.TitleFont = new Font("微软雅黑", 10f, FontStyle.Regular);

        //cht4.ChartAreas[0].AxisY.TitleForeColor = Color.White;

        //cht4.ChartAreas[0].AxisY.TextOrientation = TextOrientation.Auto;

        //cht4.ChartAreas[0].AxisY.ToolTip = "数量(宗)";

        //Y轴网格线条

        cht4.ChartAreas[0].AxisY.MajorGrid.Enabled = true;

        cht4.ChartAreas[0].AxisY.MajorGrid.LineColor = ColorTranslator.FromHtml("#2c4c6d");


        cht4.ChartAreas[0].AxisY2.LineColor = Color.Transparent;

        cht4.ChartAreas[0].AxisX.IsMarginVisible = false;

        cht4.ChartAreas[0].Area3DStyle.Enable3D = true;

        cht4.ChartAreas[0].AxisX.IsInterlaced = false;

        cht4.ChartAreas[0].AxisX.IsMarginVisible = false;

        //刻度线

        cht4.ChartAreas[0].AxisY.MajorTickMark.Enabled = false;

        //cht4.ChartAreas[0].AxisX.MajorGrid.Enabled = false;

        //cht4.ChartAreas[0].AxisY.MajorGrid.Enabled = false;

        //cht4.ChartAreas[0].AxisX.MajorTickMark.Enabled = false;

        cht4.ChartAreas[0].AxisY.LabelStyle.Enabled = false;

        //背景渐变

        cht4.ChartAreas[0].BackGradientStyle = GradientStyle.None;

        //cht4.ChartAreas[0].AxisX2.InterlacedColor = Color.Red;

        //cht4.ChartAreas[0].AxisY2.InterlacedColor = Color.Red;

        //cht4.ChartAreas[0].BorderWidth = 0;

        //cht4.ChartAreas[0].BackSecondaryColor = Color.Red;

        //cht4.ChartAreas[0].BackImageTransparentColor = Color.Red;

        //cht4.ChartAreas[0].AxisX.InterlacedColor = Color.Red;

        //cht4.ChartAreas[0].AxisX.LineColor = Color.Red;

        //cht4.ChartAreas[0].AxisX2.LineColor = Color.Red;

        //cht4.ChartAreas[0].AxisX2.MajorGrid.LineColor = Color.Red;

        //cht4.ChartAreas[0].AxisX2.MajorTickMark.LineColor = Color.Red;

        //cht4.ChartAreas[0].AxisX2.MinorTickMark.LineColor = Color.Red;

        //cht4.ChartAreas[0].AxisY.InterlacedColor = Color.Red;

        //cht4.ChartAreas[0].AxisY.LineColor = Color.Red;

        //cht4.ChartAreas[0].AxisY2.InterlacedColor = Color.Red;

        //cht4.ChartAreas[0].AxisY2.LineColor = Color.Red;

        //cht4.ChartAreas[0].AxisY2.MajorGrid.LineColor = Color.Red;

        //cht4.ChartAreas[0].AxisY2.MajorTickMark.LineColor = Color.Red;

        //cht4.ChartAreas[0].AxisY2.MinorTickMark.LineColor = Color.Red;


        //图例样式

        Legend legend4 = new Legend();

        legend4.Title = "图例";

        legend4.TitleBackColor = Color.Transparent;

        legend4.BackColor = Color.Transparent;

        legend4.TitleForeColor = Color.White;

        legend4.TitleFont = new Font("微软雅黑", 10f, FontStyle.Regular);

        legend4.Font = new Font("微软雅黑", 8f, FontStyle.Regular);

        legend4.ForeColor = Color.White;

        cht4.Legends.Add(legend4);

        cht4.Legends[0].Position.Auto = true;


        //Series1

        cht4.Series[0].XValueType = ChartValueType.String;

        cht4.Series[0].Label = "#VAL";

        cht4.Series[0].LabelForeColor = Color.White;

        cht4.Series[0].ToolTip = "#LEGENDTEXT:#VAL(宗)";

        cht4.Series[0].ChartType = SeriesChartType.Radar;

        cht4.Series[0]["RadarDrawingStyle"] = "Line";

        cht4.Series[0].LegendText = "2015年";

        cht4.Series[0].IsValueShownAsLabel = true;


        //Series2

        cht4.Series.Add(new Series("Series2"));

        cht4.Series[1].Label = "#VAL";

        cht4.Series[1].LabelForeColor = Color.White;

        cht4.Series[1].ToolTip = "#LEGENDTEXT:#VAL(宗)";

        cht4.Series[1].ChartType = SeriesChartType.Radar;

        cht4.Series[1]["RadarDrawingStyle"] = "Line";

        cht4.Series[1].LegendText = "2016年";

        cht4.Series[1].IsValueShownAsLabel = true;


        //Series3

        cht4.Series.Add(new Series("Series3"));

        cht4.Series[2].Label = "#VAL";

        cht4.Series[2].LabelForeColor = Color.White;

        cht4.Series[2].ToolTip = "#LEGENDTEXT:#VAL(宗)";

        cht4.Series[2].ChartType = SeriesChartType.Radar;

        cht4.Series[2]["RadarDrawingStyle"] = "Line";

        cht4.Series[2].LegendText = "2017年";

        cht4.Series[2].IsValueShownAsLabel = true;


        double[] yValues = { 65.62, 75.54, 60.45, 34.73, 85.42, 55.9, 63.6, 55.2, 77.1 };

        string[] xValues = { "France", "Canada", "Germany", "USA", "Italy", "Spain", "Russia", "Sweden", "Japan" };


        //Seris2

        double[] y2 = { 45.62, 65.54, 70.45, 84.73, 35.42, 55.9, 63.6 };

        double[] y3 = { 88.62, 35.54, 52.45, 45.73, 88.42, 14.9, 33.6 };

        this.cht4.Series[0].Points.DataBindXY(xValues, yValues);

        this.cht4.Series[1].Points.DataBindY(y2);

        this.cht4.Series[2].Points.DataBindY(y3);


        //设置X轴显示间隔为1,X轴数据比较多的时候比较有用

        cht4.ChartAreas[0].AxisX.LabelStyle.Interval = 1;

        //设置XY轴标题的名称所在位置位远

        cht4.ChartAreas[0].AxisX.TitleAlignment = StringAlignment.Near;


        for (int i = 0; i < cht4.Series[2].Points.Count; i++)

        {

            cht4.Series[2].Points[i].MarkerStyle = MarkerStyle.Circle;//设置折点的风格

            cht4.Series[2].Points[i].MarkerColor = Color.Red;//设置seires中折点的颜色

        //    cht4.Series[1].Points[i].MarkerStyle = MarkerStyle.Square;//设置折点的风格

        //    cht4.Series[1].Points[i].MarkerColor = Color.Blue;//设置seires中折点的颜色

        //    cht4.Series[2].Points[i].MarkerStyle = MarkerStyle.Square;//设置折点的风格

        //    cht4.Series[2].Points[i].MarkerColor = Color.Green;//设置seires中折点的颜色          }

        for (int i = 0; i < cht4.Series.Count; i++)

        {

            for (int j = 0; j < cht4.Series[i].Points.Count; j++)

            {

                cht4.Series[i].Points[j].Label = " ";

                //cht4.Series[i].Points[j].LabelToolTip = "string.Empty";            }

        }

        //cht4.ImageType = ChartImageType.Jpeg;

        //反锯齿

        cht4.AntiAliasing = AntiAliasingStyles.All;

        //调色板 磨沙:SemiTransparent

        cht4.Palette = ChartColorPalette.BrightPastel;

        cht4.Series[0].ChartType = SeriesChartType.Radar;

        cht4.Series[1].ChartType = SeriesChartType.Radar;

        cht4.Series[2].ChartType = SeriesChartType.Radar;

        cht4.Width = 500;

        cht4.Height = 350;
        #endregion
        /*

             #VALX      显示当前图例的X轴的对应文本(或数据)

             #VAL, #VALY,  显示当前图例的Y轴的对应文本(或数据)

             #VALY2, #VALY3, 显示当前图例的辅助Y轴的对应文本(或数据)

             #SER:      显示当前图例的名称

             #LABEL       显示当前图例的标签文本

             #INDEX      显示当前图例的索引

             #PERCENT       显示当前图例的所占的百分比

             #TOTAL      总数量

             #LEGENDTEXT      图例文本

             */
    }
}

 浙公网安备 33010602011771号