linux free 命令下free/available区别
例子
[root@VM_16_17_centos bin]# free
              total        used        free      shared  buff/cache   available
Mem:        1882892      785272      280428       40496      817192      852060
Swap:             0           0           0
先说明一些基本概念
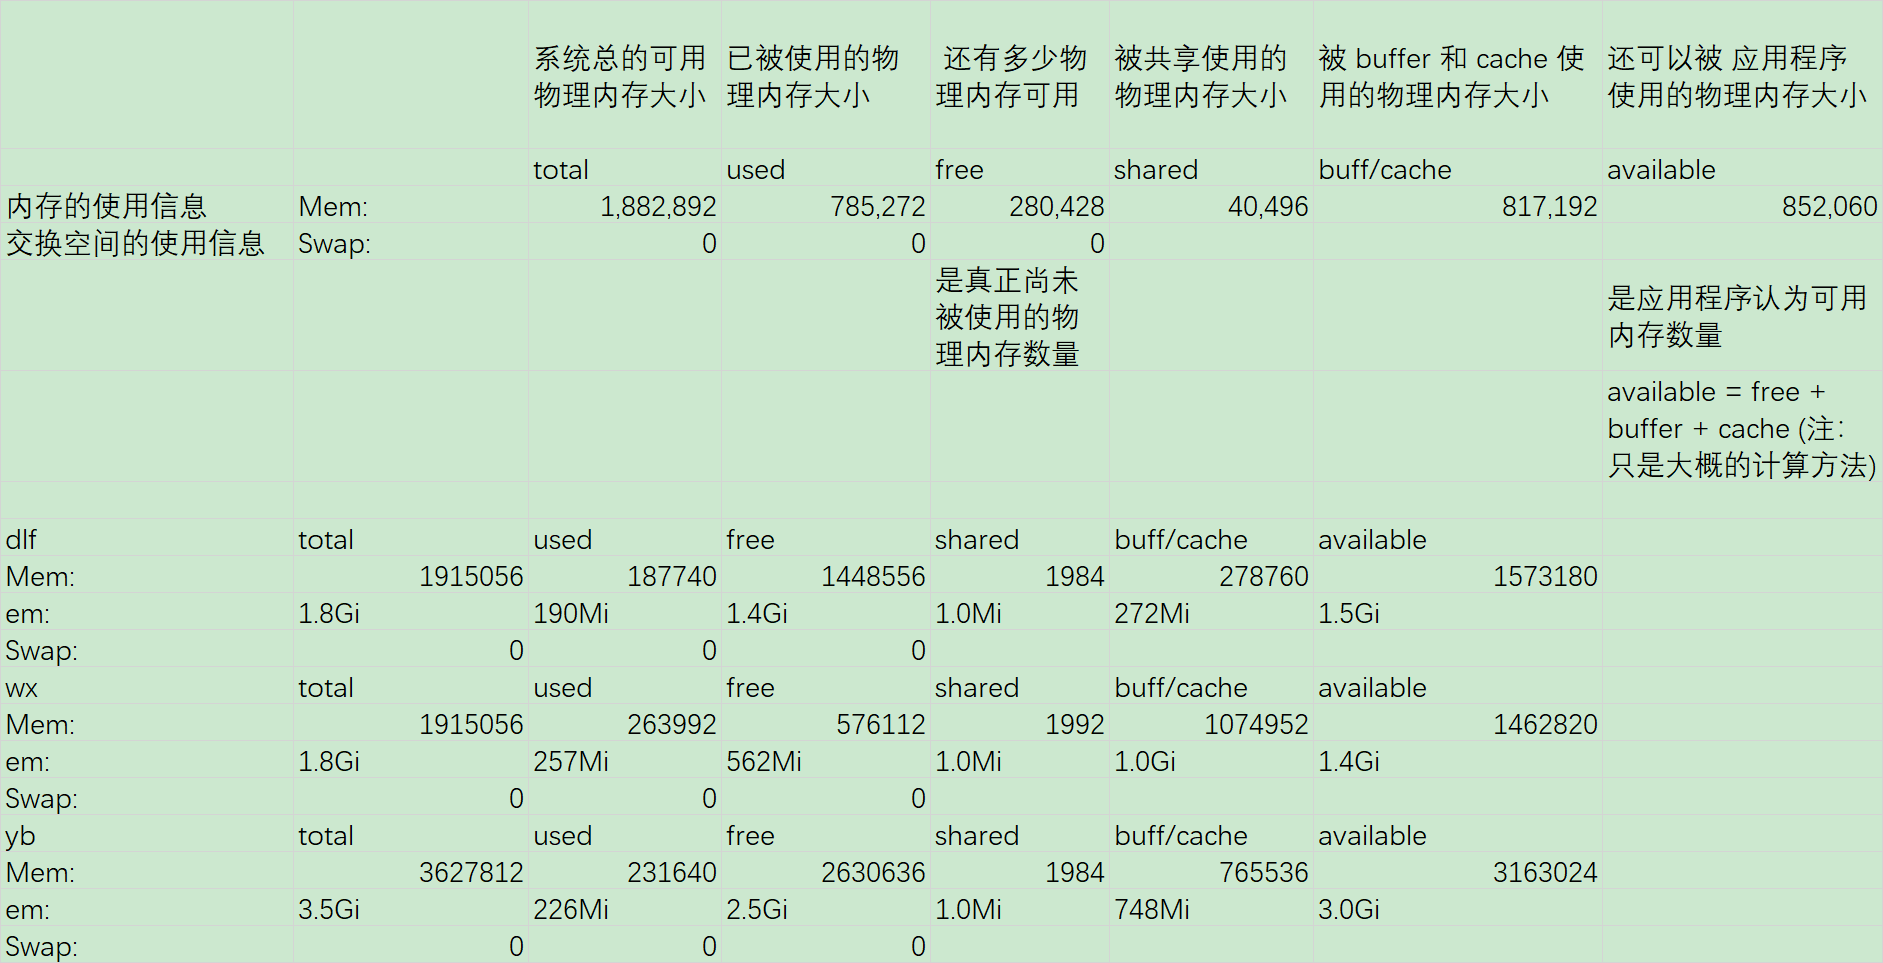
第一列Mem 内存的使用信息Swap 交换空间的使用信息
第一行total 系统总的可用物理内存大小used 已被使用的物理内存大小free 还有多少物理内存可用shared 被共享使用的物理内存大小buff/cache 被 buffer 和 cache 使用的物理内存大小available 还可以被 应用程序 使用的物理内存大小
其中有两个概念需要注意
free 与 available 的区别
free 是真正尚未被使用的物理内存数量。available 是应用程序认为可用内存数量,available = free + buffer + cache (注:只是大概的计算方法)
Linux 为了提升读写性能,会消耗一部分内存资源缓存磁盘数据,对于内核来说,buffer 和 cache 其实都属于已经被使用的内存。但当应用程序申请内存时,如果 free 内存不够,内核就会回收 buffer 和 cache 的内存来满足应用程序的请求。这就是稍后要说明的 buffer 和 cache。
buff 和 cache 的区别
以下内容来自# buffer和cache怎么让你们解释的那么难理解?
从字面上和语义来看,buffer名为缓冲,cache名为缓存。我们知道各种硬件存在制作工艺上的差别,所以当两种硬件需要交互的时候,肯定会存在速度上的差异,而且只有交互双方都完成才可以各自处理别的其他事务。假如现在有两个需要交互的设备A和B,A设备用来交互的接口速率为1000M/s,B设备用来交互的接口速率为500M/s,那他们彼此访问的时候都会出现以下两种情况:(以A来说)
一.A从B取一个1000M的文件结果需要2s,本来需要1s就可以完成的工作,却还需要额外等待1s,B设备把剩余的500M找出来,这等待B取出剩下500M的空闲时间内(1s)其他的事务还干不了
二.A给B一个1000M的文件结果也需要2s,本来需要也就1s就可以完成的工作,却由于B,1s内只能拿500M,剩下的500M还得等下一个1sB来取,这等待下1s的时间还做不了其他事务。
那有什么方法既可以让A在‘取’或‘给’B的时候既能完成目标任务又不浪费那1s空闲等待时间去处理其他事务呢?我们知道产生这种结果主要是因为B跟不上A的节奏,但即使这样A也得必须等B处理完本次事务才能干其他活(单核cpu来说),除非你有三头六臂。那有小伙伴可能会问了,能不能在A和B之间加一层区域比如说ab,让ab既能跟上A的频率也会照顾B的感受,没错我们确实可以这样设计来磨合接口速率上的差异,你可以这样想象,在区域ab提供了两个交互接口一个是a接口另一个是b接口,a接口的速率接近A,b接口的速率最少等于B,然后我们把ab的a和A相连,ab的b和B相连,ab就像一座桥把A和B链接起来,并告知A和B通过他都能转发给对方,文件可以暂时存储,最终拓扑大概如下:

现在我们再来看上述两种情况:
对于第一种情况A要B:当A从B取一个1000M的文件,他把需求告诉了ab,接下来ab通过b和B进行文件传送,由于B本身的速率,传送第一次ab并没有什么卵用,对A来说不仅浪费了时间还浪费了感情,ab这家伙很快感受到了A的不满,所以在第二次传送的时候,ab背着B偷偷缓存了一个一模一样的文件,而且只要从B取东西,ab都会缓存一个拷贝下来放在自己的大本营,如果下次A或者其他C来取B的东西,ab直接就给A或C一个货真价实的赝品,然后把它通过a接口给了A或C,由于a的速率相对接近A的接口速率,所以A觉得不错为他省了时间,最终和ab的a成了好基友,说白了此时的ab提供的就是一种缓存能力,即cache,绝对的走私!因为C取的是A执行的结果。所以在这种工作模式下,怎么取得的东西是最新的也是我们需要考虑的,一般就是清cache。例如cpu读取内存数据,硬盘一般都提供一个内存作为缓存来增加系统的读取性能
对于第二种情况A给B:当A发给B一个1000M的文件,因为A知道通过ab的a接口就可以转交给B,而且通过a接口要比通过B接口传送文件需要等待的时间更短,所以1000M通过a接口给了ab ,站在A视图上他认为已经把1000M的文件给了B,但对于ab并不立即交给B,而是先缓存下来,除非B执行sync命令,即使B马上要,但由于b的接口速率最少大于B接口速率,所以也不会存在漏洞时间,但最终的结果是A节约了时间就可以干其他的事务,说白了就是推卸责任,哈哈而ab此时提供的就是一种缓冲的能力,即buffer,它存在的目的适用于当速度快的往速度慢的输出东西。例如内存的数据要写到磁盘,cpu寄存器里的数据写到内存。
看了上面这个例子,那我们现在看一下在计算机领域,在处理磁盘IO读写的时候,cpu,memory,disk基于这种模型给出的一个实例。我们先来一幅图:(我从别家当来的,我觉得,看N篇文档 不如瞄此一图)
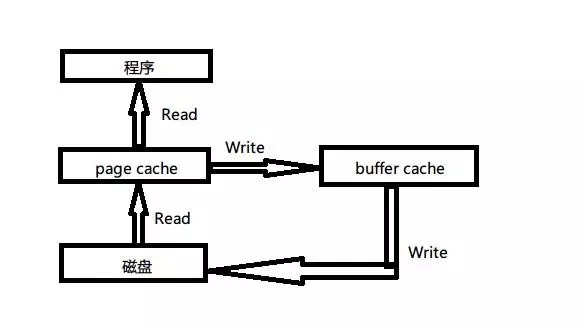
page cache:文件系统层级的缓存,从磁盘里读取的内容是存储到这里,这样程序读取磁盘内容就会非常快,比如使用grep和find等命令查找内容和文件时,第一次会慢很多,再次执行就快好多倍,几乎是瞬间。但如上所说,如果对文件的更新不关心,就没必要清cache,否则如果要实施同步,必须要把内存空间中的cache clean下
buffer cache:磁盘等块设备的缓冲,内存的这一部分是要写入到磁盘里的。这种情况需要注意,位于内存buffer中的数据不是即时写入磁盘,而是系统空闲或者buffer达到一定大小统一写到磁盘中,所以断电易失,为了防止数据丢失所以我们最好正常关机或者多执行几次sync命令,让位于buffer上的数据立刻写到磁盘里。
man free
FREE(1) User Commands FREE(1)
NAME
free - Display amount of free and used memory in the system
SYNOPSIS
free [options]
DESCRIPTION
free displays the total amount of free and used physical and swap memory in the system, as well as the buffers and
caches used by the kernel. The information is gathered by parsing /proc/meminfo. The displayed columns are:
total Total installed memory (MemTotal and SwapTotal in /proc/meminfo)
used Used memory (calculated as total - free - buffers - cache)
free Unused memory (MemFree and SwapFree in /proc/meminfo)
shared Memory used (mostly) by tmpfs (Shmem in /proc/meminfo)
buffers
Memory used by kernel buffers (Buffers in /proc/meminfo)
cache Memory used by the page cache and slabs (Cached and SReclaimable in /proc/meminfo)
buff/cache
Sum of buffers and cache
available
Estimation of how much memory is available for starting new applications, without swapping. Unlike the data
provided by the cache or free fields, this field takes into account page cache and also that not all
reclaimable memory slabs will be reclaimed due to items being in use (MemAvailable in /proc/meminfo, avail‐
able on kernels 3.14, emulated on kernels 2.6.27+, otherwise the same as free)
OPTIONS
-b, --bytes
Display the amount of memory in bytes.
-k, --kibi
Display the amount of memory in kibibytes. This is the default.
-m, --mebi
Display the amount of memory in mebibytes.
-g, --gibi
Display the amount of memory in gibibytes.
--tebi Display the amount of memory in tebibytes.
--pebi Display the amount of memory in pebibytes.
--kilo Display the amount of memory in kilobytes. Implies --si.
--mega Display the amount of memory in megabytes. Implies --si.
--giga Display the amount of memory in gigabytes. Implies --si.
--tera Display the amount of memory in terabytes. Implies --si.
--peta Display the amount of memory in petabytes. Implies --si.
-h, --human
Show all output fields automatically scaled to shortest three digit unit and display the units of print out.
Following units are used.
B = bytes
K = kibibyte
M = mebibyte
G = gibibyte
T = tebibyte
P = pebibyte
If unit is missing, and you have exbibyte of RAM or swap, the number is in tebibytes and columns might not be
aligned with header.
-w, --wide
Switch to the wide mode. The wide mode produces lines longer than 80 characters. In this mode buffers and
cache are reported in two separate columns.
-c, --count count
Display the result count times. Requires the -s option.
-l, --lohi
Show detailed low and high memory statistics.
-s, --seconds delay
Continuously display the result delay seconds apart. You may actually specify any floating point number for
delay using either . or , for decimal point. usleep(3) is used for microsecond resolution delay times.
--si Use kilo, mega, giga etc (power of 1000) instead of kibi, mebi, gibi (power of 1024).
-t, --total
Display a line showing the column totals.
--help Print help.
-V, --version
Display version information.
FILES
/proc/meminfo
memory information
BUGS
The value for the shared column is not available from kernels before 2.6.32 and is displayed as zero.
Please send bug reports to
⟨procps@freelists.org⟩
SEE ALSO
ps(1), slabtop(1), top(1), vmstat(8).
procps-ng 2016-06-03 FREE(1)
--- free(1) - Linux manual page
FREE(1) User Commands FREE(1)
NAME top
free - Display amount of free and used memory in the system
SYNOPSIS top
free [options]
DESCRIPTION top
       free displays the total amount of free and used physical and swap
       memory in the system, as well as the buffers and caches used by
       the kernel. The information is gathered by parsing /proc/meminfo.
       The displayed columns are:

       total  Total installed memory (MemTotal and SwapTotal in
              /proc/meminfo)

       used   Used memory (calculated as total - free - buffers - cache)

       free   Unused memory (MemFree and SwapFree in /proc/meminfo)

       shared Memory used (mostly) by tmpfs (Shmem in /proc/meminfo)

       buffers
              Memory used by kernel buffers (Buffers in /proc/meminfo)

       cache  Memory used by the page cache and slabs (Cached and
              SReclaimable in /proc/meminfo)

       buff/cache
              Sum of buffers and cache

       available
              Estimation of how much memory is available for starting
              new applications, without swapping. Unlike the data
              provided by the cache or free fields, this field takes
              into account page cache and also that not all reclaimable
              memory slabs will be reclaimed due to items being in use
              (MemAvailable in /proc/meminfo, available on kernels 3.14,
              emulated on kernels 2.6.27+, otherwise the same as free)
OPTIONS top
       -b, --bytes
              Display the amount of memory in bytes.

       -k, --kibi
              Display the amount of memory in kibibytes.  This is the
              default.

       -m, --mebi
              Display the amount of memory in mebibytes.

       -g, --gibi
              Display the amount of memory in gibibytes.

       --tebi Display the amount of memory in tebibytes.

       --pebi Display the amount of memory in pebibytes.

       --kilo Display the amount of memory in kilobytes. Implies --si.

       --mega Display the amount of memory in megabytes. Implies --si.

       --giga Display the amount of memory in gigabytes. Implies --si.

       --tera Display the amount of memory in terabytes. Implies --si.

       --peta Display the amount of memory in petabytes. Implies --si.

       -h, --human
              Show all output fields automatically scaled to shortest
              three digit unit and display the units of print out.
              Following units are used.

                B = bytes
                Ki = kibibyte
                Mi = mebibyte
                Gi = gibibyte
                Ti = tebibyte
                Pi = pebibyte

              If unit is missing, and you have exbibyte of RAM or swap,
              the number is in tebibytes and columns might not be
              aligned with header.

       -w, --wide
              Switch to the wide mode. The wide mode produces lines
              longer than 80 characters. In this mode buffers and cache
              are reported in two separate columns.

       -c, --count count
              Display the result count times.  Requires the -s option.

       -l, --lohi
              Show detailed low and high memory statistics.

       -s, --seconds delay
              Continuously display the result delay  seconds apart.  You
              may actually specify any floating point number for delay
              using either . or , for decimal point.  usleep(3) is used
              for microsecond resolution delay times.

       --si   Use kilo, mega, giga etc (power of 1000) instead of kibi,
              mebi, gibi (power of 1024).

       -t, --total
              Display a line showing the column totals.

       --help Print help.

       -V, --version
              Display version information.
FILES top
       /proc/meminfo
              memory information
BUGS top
       The value for the shared column is not available from kernels
       before 2.6.32 and is displayed as zero.

       Please send bug reports to
              ⟨procps@freelists.org⟩
SEE ALSO top
ps(1), slabtop(1), top(1), vmstat(8).
COLOPHON top
       This page is part of the procps-ng (/proc filesystem utilities)
       project.  Information about the project can be found at
       ⟨https://gitlab.com/procps-ng/procps⟩.  If you have a bug report
       for this manual page, see
       ⟨https://gitlab.com/procps-ng/procps/blob/master/Documentation/bugs.md⟩.
       This page was obtained from the project's upstream Git repository
       ⟨https://gitlab.com/procps-ng/procps.git⟩ on 2021-08-27.  (At
       that time, the date of the most recent commit that was found in
       the repository was 2021-08-24.)  If you discover any rendering
       problems in this HTML version of the page, or you believe there
       is a better or more up-to-date source for the page, or you have
       corrections or improvements to the information in this COLOPHON
       (which is not part of the original manual page), send a mail to
       man-pages@man7.org

procps-ng                      2018-05-31                        FREE(1)

 浙公网安备 33010602011771号