1、首先配置左侧菜单栏children、路由、添加components里面的文件夹和页面noise.vue略)
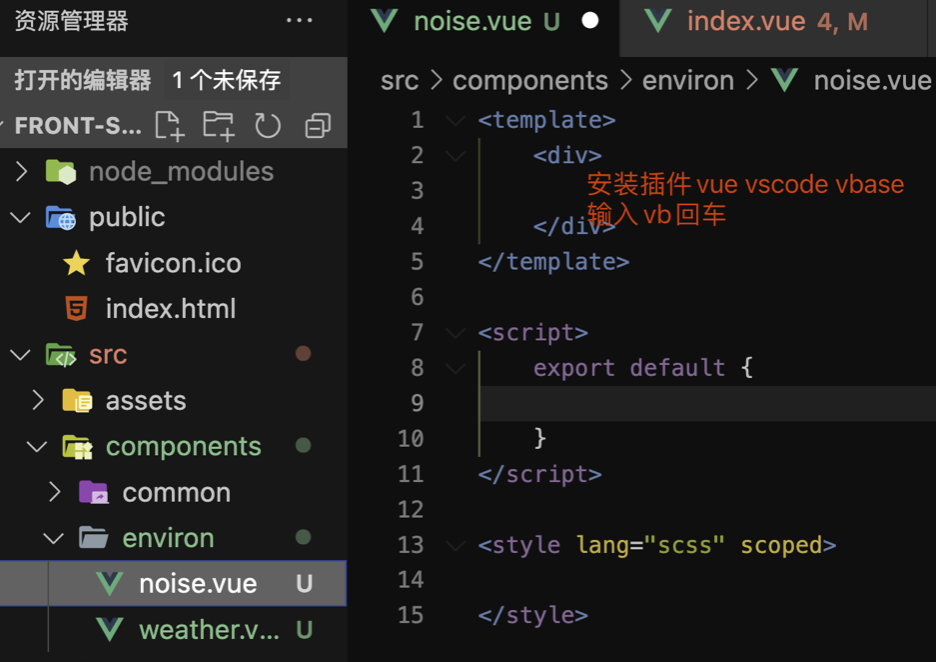
2、安装插件vue vscode vbase
![]()
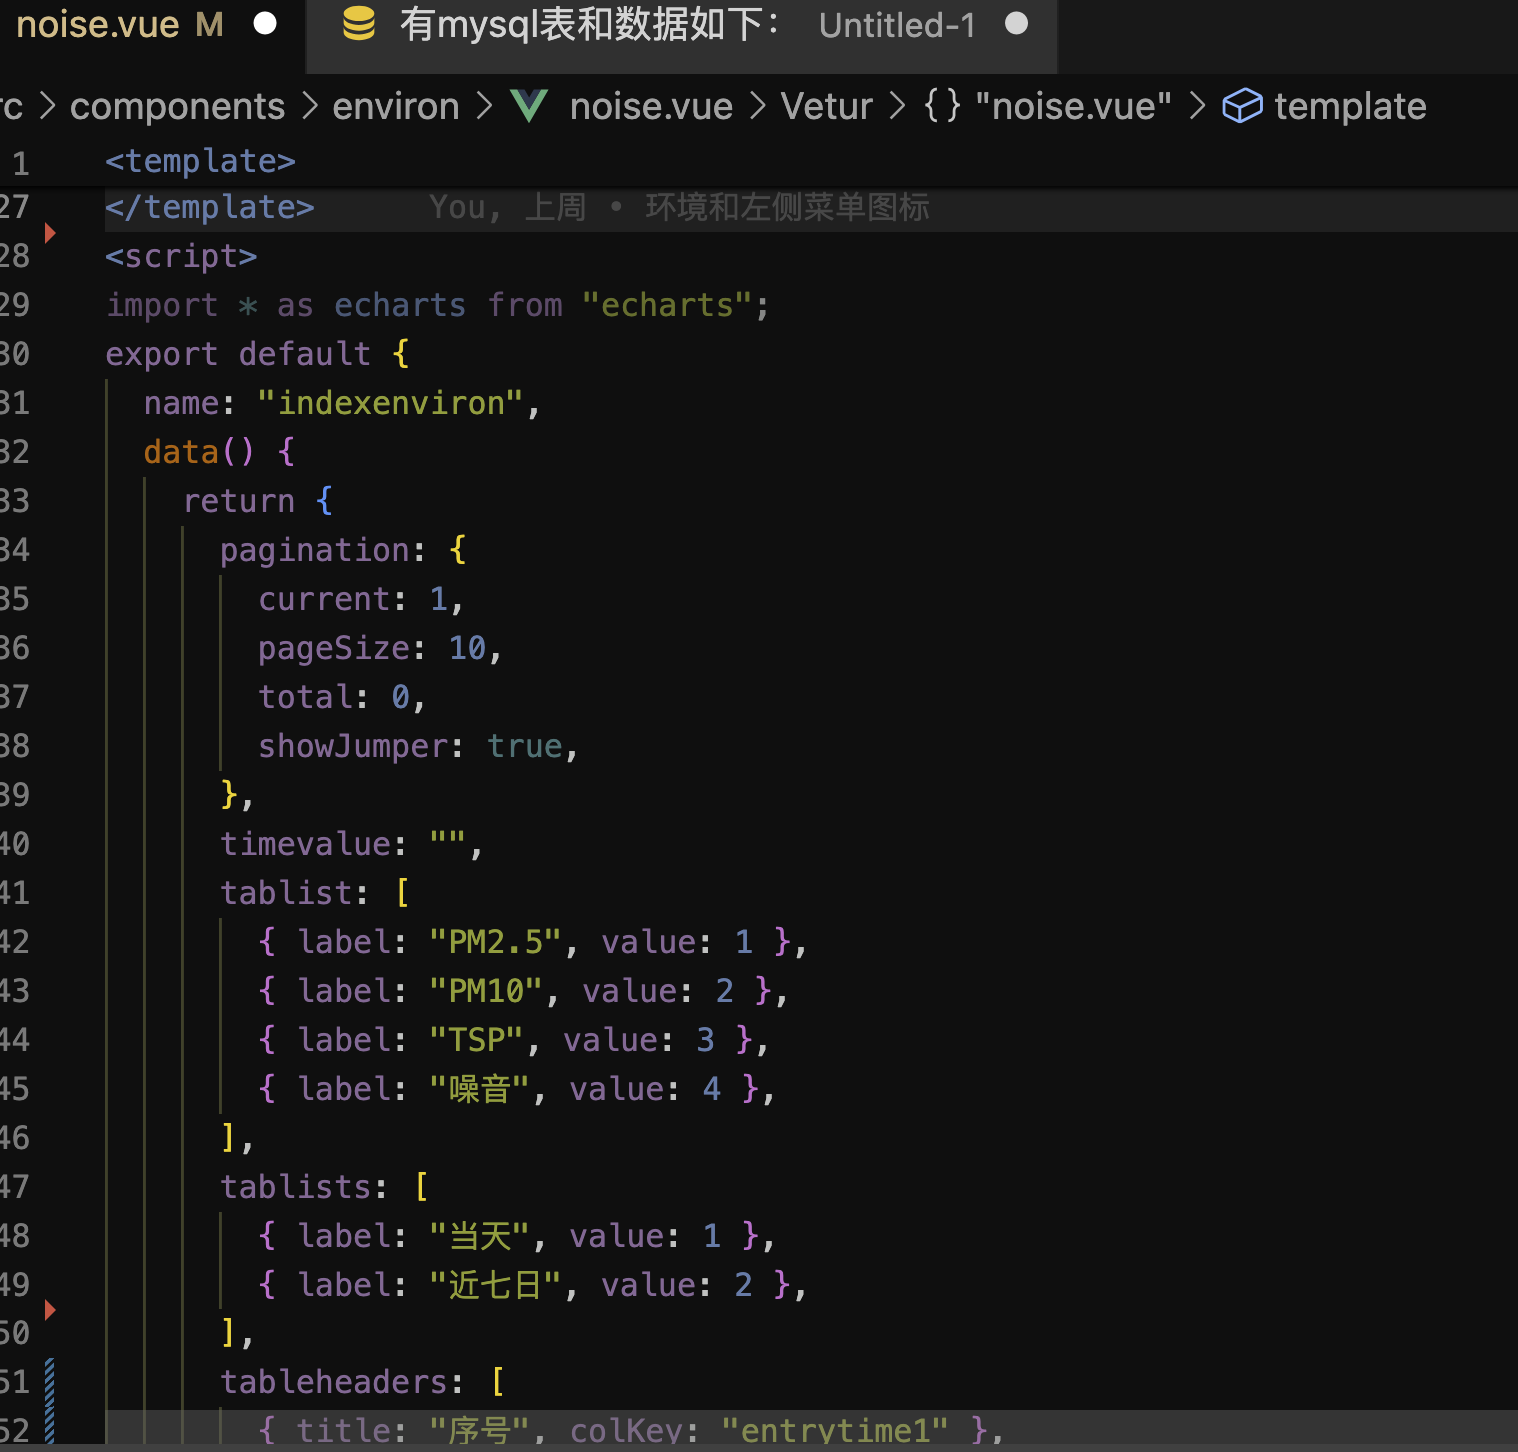
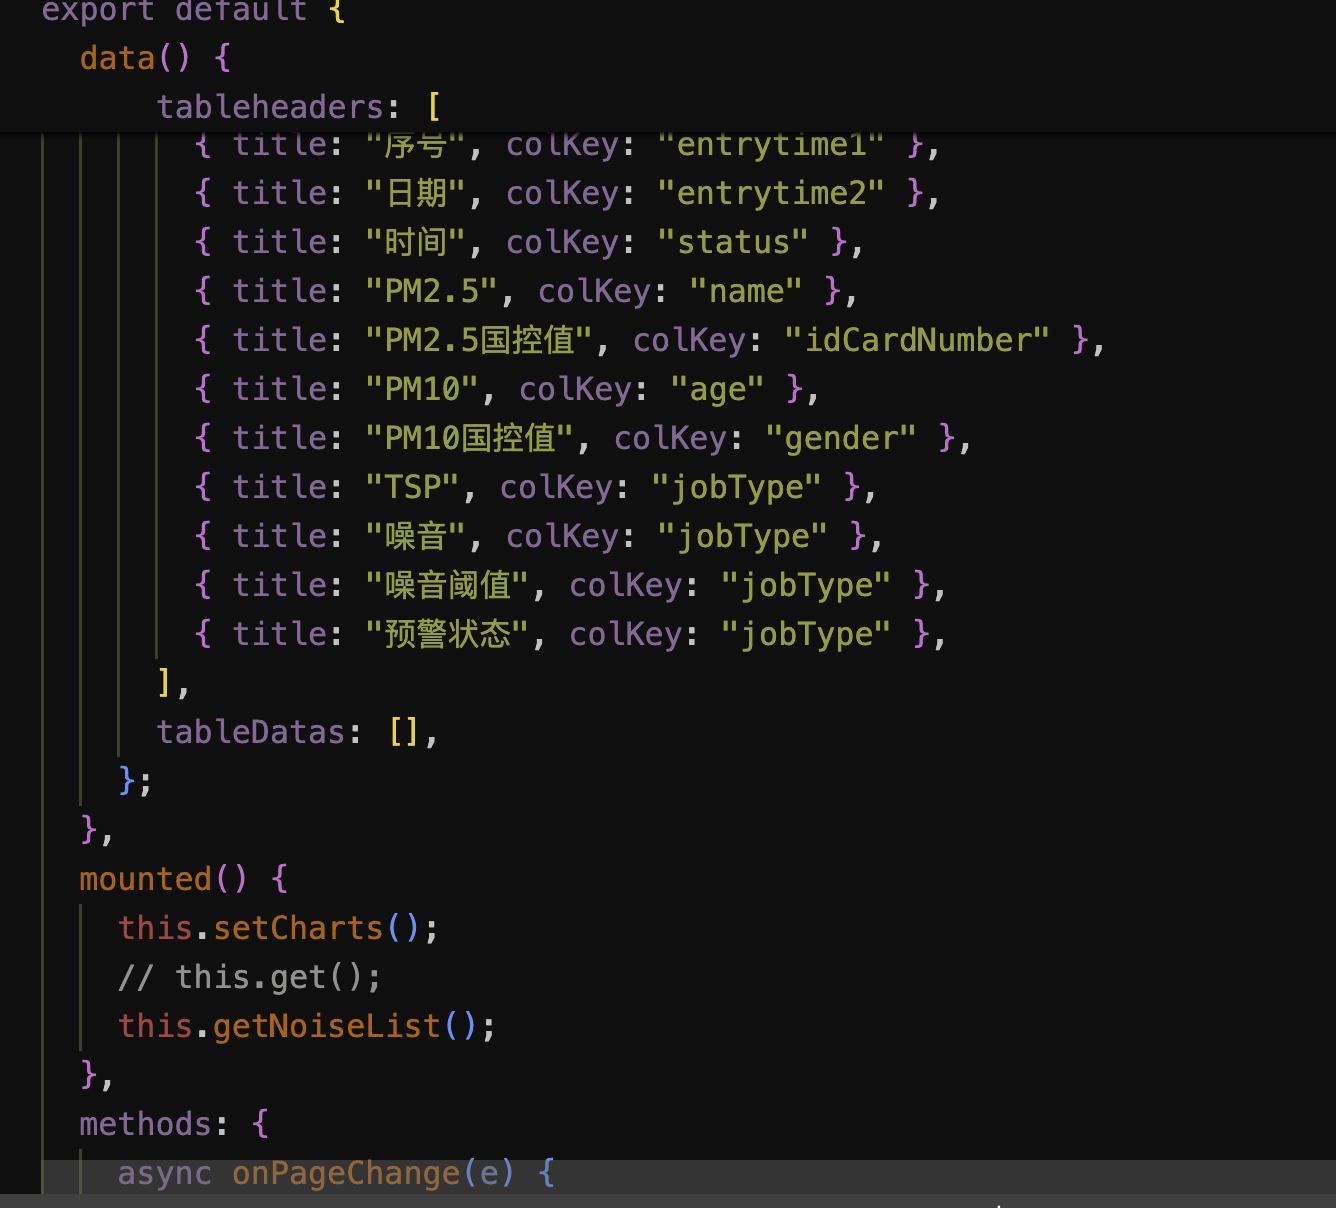
3、按UI设计图编写页面的div排版
![]()
![]()
![]()
![]()
![]()
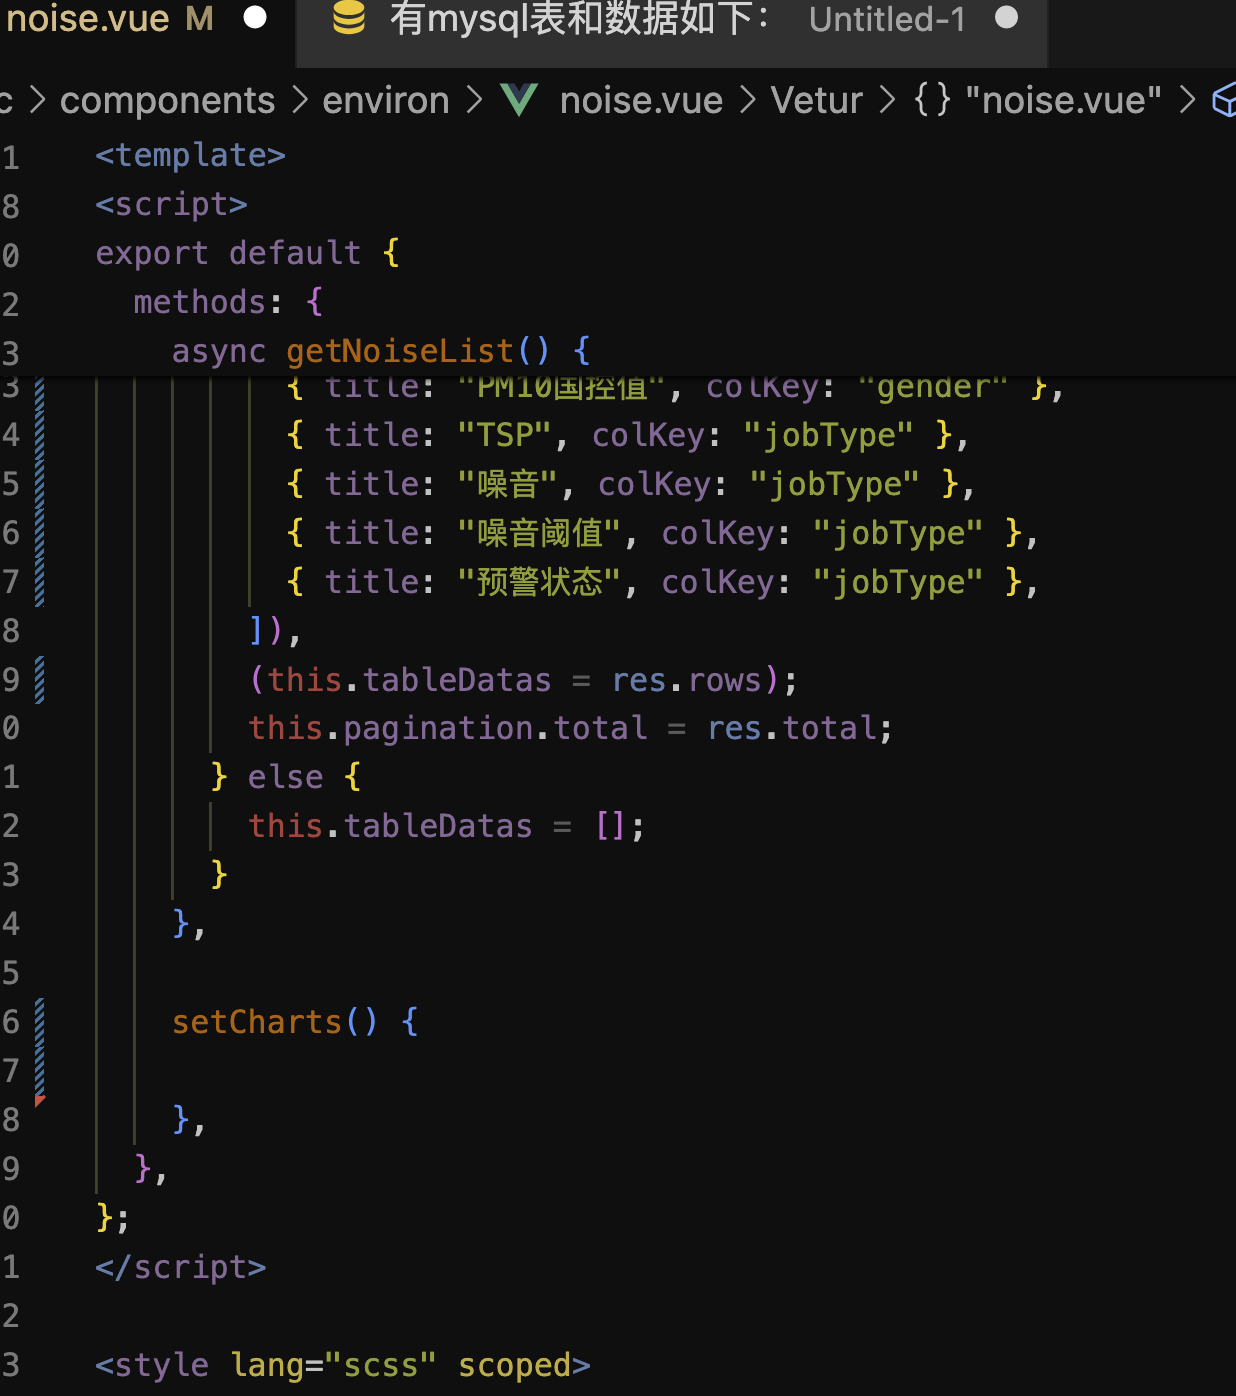
4、前提:先简单写了一些静态的数据到静态页面上,包括getNoiseList函数和setCharts函数,然后再问编写询问GPT的语句,尽量包含上下文
一、有mysql表和数据如下:
CREATE TABLE `meteorological_data` (
`id` bigint(20) NOT NULL AUTO_INCREMENT COMMENT '主键',
`date` date NOT NULL COMMENT '日期',
`pm25` decimal(10,2) DEFAULT NULL COMMENT 'PM2.5',
`pm25_standard` decimal(10,2) DEFAULT NULL COMMENT 'PM2.5国控值',
`pm10` decimal(10,2) DEFAULT NULL COMMENT 'PM10',
`pm10_standard` decimal(10,2) DEFAULT NULL COMMENT 'PM10国控值',
`tsp` decimal(10,2) DEFAULT NULL COMMENT 'TSP',
`noise` decimal(10,2) DEFAULT NULL COMMENT '噪音',
`noise_threshold` decimal(10,2) DEFAULT NULL COMMENT '噪音阈值',
`warning_status` varchar(255) DEFAULT NULL COMMENT '预警状态',
PRIMARY KEY (`id`)
) ENGINE=InnoDB AUTO_INCREMENT=21 DEFAULT CHARSET=utf8mb4 COMMENT='噪音实况监测表';
INSERT INTO `meteorological_data` VALUES (45, '2024-03-23 00:00:00', 65.41, NULL, 116.74, NULL, 45.63, NULL, NULL, NULL);
INSERT INTO `meteorological_data` VALUES (46, '2024-03-22 23:00:00', 66.54, NULL, 124.00, NULL, 50.79, NULL, NULL, NULL);
INSERT INTO `meteorological_data` VALUES (47, '2024-03-26 22:00:00', 57.34, NULL, 106.82, NULL, 51.02, NULL, NULL, NULL);
INSERT INTO `meteorological_data` VALUES (48, '2024-03-26 21:00:00', 55.14, NULL, 101.47, NULL, 51.95, NULL, NULL, NULL);
INSERT INTO `meteorological_data` VALUES (49, '2024-03-22 20:00:00', 61.35, NULL, 93.82, NULL, 52.08, NULL, NULL, NULL);
INSERT INTO `meteorological_data` VALUES (50, '2024-03-22 19:00:00', 58.92, NULL, 89.12, NULL, 54.42, NULL, NULL, NULL);
INSERT INTO `meteorological_data` VALUES (51, '2024-03-22 18:00:00', 57.17, NULL, 85.24, NULL, 56.77, NULL, NULL, NULL);
INSERT INTO `meteorological_data` VALUES (52, '2024-03-22 17:00:00', 57.59, NULL, 90.16, NULL, 57.32, NULL, NULL, NULL);
INSERT INTO `meteorological_data` VALUES (53, '2024-03-22 16:00:00', 56.78, NULL, 84.98, NULL, 57.72, NULL, NULL, NULL);
INSERT INTO `meteorological_data` VALUES (54, '2024-03-22 15:00:00', 57.22, NULL, 82.46, NULL, 58.06, NULL, NULL, NULL);
INSERT INTO `meteorological_data` VALUES (55, '2024-03-26 14:00:00', 55.11, NULL, 80.07, NULL, 57.25, NULL, NULL, NULL);
INSERT INTO `meteorological_data` VALUES (56, '2024-03-22 13:00:00', 55.64, NULL, 82.66, NULL, 54.98, NULL, NULL, NULL);
INSERT INTO `meteorological_data` VALUES (57, '2024-03-22 12:00:00', 52.81, NULL, 80.69, NULL, 54.89, NULL, NULL, NULL);
INSERT INTO `meteorological_data` VALUES (58, '2024-03-26 11:00:00', 62.68, NULL, 97.51, NULL, 57.75, NULL, NULL, NULL);
INSERT INTO `meteorological_data` VALUES (59, '2024-03-22 09:00:00', 79.89, NULL, 129.67, NULL, 58.35, NULL, NULL, NULL);
INSERT INTO `meteorological_data` VALUES (60, '2024-03-22 08:00:00', 86.17, NULL, 145.80, NULL, 59.20, NULL, NULL, NULL);
INSERT INTO `meteorological_data` VALUES (61, '2024-03-22 07:00:00', 102.47, NULL, 157.71, NULL, 53.09, NULL, NULL, NULL);
INSERT INTO `meteorological_data` VALUES (62, '2024-03-22 06:00:00', 109.46, NULL, 165.56, NULL, 47.72, NULL, NULL, NULL);
INSERT INTO `meteorological_data` VALUES (63, '2024-03-22 05:00:00', 105.12, NULL, 159.32, NULL, 44.76, NULL, NULL, NULL);
INSERT INTO `meteorological_data` VALUES (64, '2024-03-22 04:00:00', 95.14, NULL, 149.62, NULL, 43.61, NULL, NULL, NULL);
INSERT INTO `meteorological_data` VALUES (65, '2024-03-26 03:00:00', 92.45, NULL, 148.59, NULL, 43.31, NULL, NULL, NULL);
INSERT INTO `meteorological_data` VALUES (66, '2024-03-22 02:00:00', 89.08, NULL, 146.72, NULL, 42.86, NULL, NULL, NULL);
INSERT INTO `meteorological_data` VALUES (67, '2024-03-22 01:00:00', 81.92, NULL, 139.78, NULL, 43.08, NULL, NULL, NULL);
INSERT INTO `meteorological_data` VALUES (68, '2024-03-26 00:00:00', 76.01, NULL, 128.69, NULL, 44.23, NULL, NULL, NULL);
二、有vue代码如下:
<template>
<div>
<div>
<div class="header flex jb" style="height: 1.67vw">
<bluetitle name="噪音实况分析" />
<div style="gap: 0.52vw" class="flex">
<bluetabs :tabList="tablist" :active="activeTab" @tabchange="tabchange" />
<bluetabs :tabList="tablists" :active="activeTabSub" @tabchange="tabchanges" />
</div>
</div>
<div id="main" style="
width: 60.63vw;
height: 22.29vw;
margin-top: 1.04vw;
width: 100%;
background: #282828;
margin-bottom: 1.04vw;
"></div>
<div class="flex jb">
<bluetitle name="噪音实况记录" />
</div>
<t-table rowKey="index" :data="tableDatas" :columns="tableheaders" table-layout="fixed" :pagination="pagination"
@page-change="onPageChange">
</t-table>
</div>
</div>
</template>
<script>
import * as echarts from "echarts";
export default {
name: "indexenviron",
data() {
return {
pagination: {
current: 1,
pageSize: 10,
total: 0,
showJumper: true,
},
timevalue: "",
tablist: [
{ label: "PM2.5", value: 1 },
{ label: "PM10", value: 2 },
{ label: "TSP", value: 3 },
{ label: "噪音", value: 4 },
],
tablists: [
{ label: "当天", value: 1 },
{ label: "近七日", value: 2 },
{ label: "近一月", value: 3 },
{ label: "近一年", value: 4 },
],
activeTab: 1, // 默认选中"PM2.5"
activeTabSub: 1, // 默认选中"当天"
tableheaders: [],
tableDatas: [],
};
},
mounted() {
this.setCharts(this.data);
// this.get();
this.getNoiseList();
},
methods: {
async onPageChange(e) {
this.pagination = e;
let str = `?pageNum=${e.current}&pageSize=${e.pageSize}`;
},
tabchange(value) {
this.activeTab = value;
this.getNoiseList();
},
tabchanges(e) {
this.pagination.current = 1;
this.getNoiseList();
},
//噪音实况表
async getNoiseList() {
let params = {
primaryTab: this.activeTab,
secondaryTab: this.activeTabSub,
pageNum: this.pagination.current,
pageSize: this.pagination.pageSize,
};
let res = await this.$https.post(this.$url.environ.noise.list, params);
if (res.code == 200) {
const processedRows = res.rows.map(row => {
// 假设row.date格式为"2024-02-27 10:30:12"
const regex = /(\d{4}-\d{2}-\d{2}) (\d{2}:\d{2}:\d{2})/;
const match = row.date.match(regex);
if (match) {
return {
...row,
dateOnly: match[1], // 匹配到的日期部分
timeOnly: match[2] // 匹配到的时间部分
};
}
return row; // 如果没有匹配到,则返回原始行
});
(this.tableheaders = [
{ title: "序号", colKey: "id" },
{ title: "日期", colKey: "dateOnly" },
{ title: "时间", colKey: "timeOnly" },
{ title: "PM2.5", colKey: "pm25" },
{ title: "PM2.5国控值", colKey: "pm25Standard" },
{ title: "PM10", colKey: "pm10" },
{ title: "PM10国控值", colKey: "pm10Standard" },
{ title: "TSP", colKey: "tsp" },
{ title: "噪音", colKey: "noise" },
{ title: "噪音阈值", colKey: "noiseThreshold" },
{ title: "预警状态", colKey: "warningStatus" },
]),
this.tableDatas = processedRows; // 使用处理后的数据
this.pagination.total = res.total;
} else {
this.tableDatas = [];
}
},
async setCharts(data) {
var myChart = echarts.init(document.getElementById("main"));
// 生成横坐标数组,表示0点到23点
const hours = Array.from({ length: 24 }, (_, index) => `${index}:00`);
let params = {
primaryTab: this.activeTab,
secondaryTab: this.activeTabSub,
pageNum: this.pagination.current,
pageSize: this.pagination.pageSize,
};
let res = await this.$https.post(this.$url.environ.noise.list, params);
console.log("res"+res);
let option = {
tooltip: {
trigger: "axis",
axisPointer: {
type: "cross",
label: {
backgroundColor: "#6a7985",
},
},
},
xAxis: {
type: "category",
boundaryGap: false,
data: hours,
},
yAxis: {
type: "value",
},
series: [
{
data: [820, 932, 901, 934, 1290, 1330, 1320],
type: "line",
areaStyle: {},
},
],
};
myChart.setOption(option);
},
},
};
</script>
<style lang="scss" scoped>
</style>
三、查询后端接口this.$https.post(this.$url.environ.noise.list, params)时返回obj的res如下:
{
"total": 24,
"rows": [
{
"id": 45,
"date": "2024-03-23 00:00:00",
"pm25": 65.41,
"pm25Standard": null,
"pm10": 116.74,
"pm10Standard": null,
"tsp": 45.63,
"noise": null,
"noiseThreshold": null,
"warningStatus": null
},
{
"id": 46,
"date": "2024-03-22 23:00:00",
"pm25": 66.54,
"pm25Standard": null,
"pm10": 124.0,
"pm10Standard": null,
"tsp": 50.79,
"noise": null,
"noiseThreshold": null,
"warningStatus": null
},
{
"id": 47,
"date": "2024-03-26 22:00:00",
"pm25": 57.34,
"pm25Standard": null,
"pm10": 106.82,
"pm10Standard": null,
"tsp": 51.02,
"noise": null,
"noiseThreshold": null,
"warningStatus": null
},
{
"id": 48,
"date": "2024-03-26 21:00:00",
"pm25": 55.14,
"pm25Standard": null,
"pm10": 101.47,
"pm10Standard": null,
"tsp": 51.95,
"noise": null,
"noiseThreshold": null,
"warningStatus": null
},
{
"id": 49,
"date": "2024-03-22 20:00:00",
"pm25": 61.35,
"pm25Standard": null,
"pm10": 93.82,
"pm10Standard": null,
"tsp": 52.08,
"noise": null,
"noiseThreshold": null,
"warningStatus": null
},
{
"id": 50,
"date": "2024-03-22 19:00:00",
"pm25": 58.92,
"pm25Standard": null,
"pm10": 89.12,
"pm10Standard": null,
"tsp": 54.42,
"noise": null,
"noiseThreshold": null,
"warningStatus": null
},
{
"id": 51,
"date": "2024-03-22 18:00:00",
"pm25": 57.17,
"pm25Standard": null,
"pm10": 85.24,
"pm10Standard": null,
"tsp": 56.77,
"noise": null,
"noiseThreshold": null,
"warningStatus": null
},
{
"id": 52,
"date": "2024-03-22 17:00:00",
"pm25": 57.59,
"pm25Standard": null,
"pm10": 90.16,
"pm10Standard": null,
"tsp": 57.32,
"noise": null,
"noiseThreshold": null,
"warningStatus": null
},
{
"id": 53,
"date": "2024-03-22 16:00:00",
"pm25": 56.78,
"pm25Standard": null,
"pm10": 84.98,
"pm10Standard": null,
"tsp": 57.72,
"noise": null,
"noiseThreshold": null,
"warningStatus": null
},
{
"id": 54,
"date": "2024-03-22 15:00:00",
"pm25": 57.22,
"pm25Standard": null,
"pm10": 82.46,
"pm10Standard": null,
"tsp": 58.06,
"noise": null,
"noiseThreshold": null,
"warningStatus": null
}
],
"code": 200,
"msg": "查询成功"
}
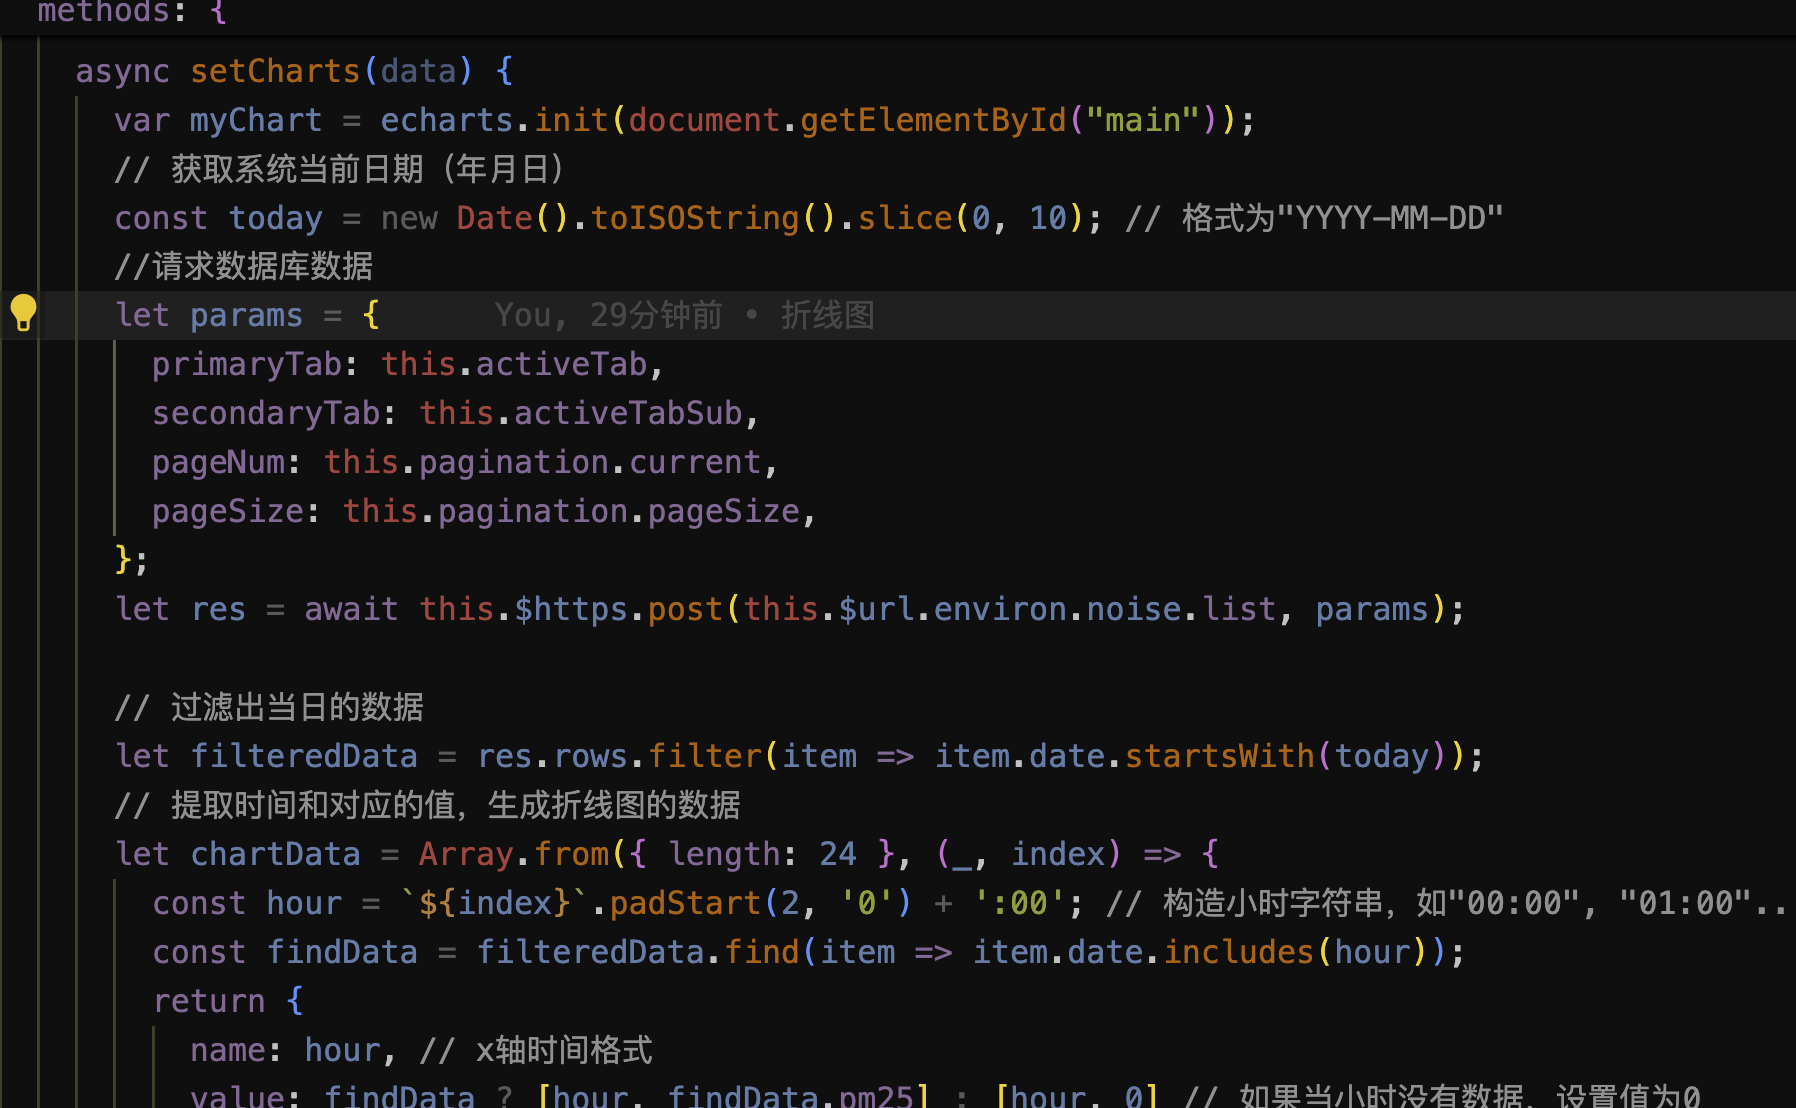
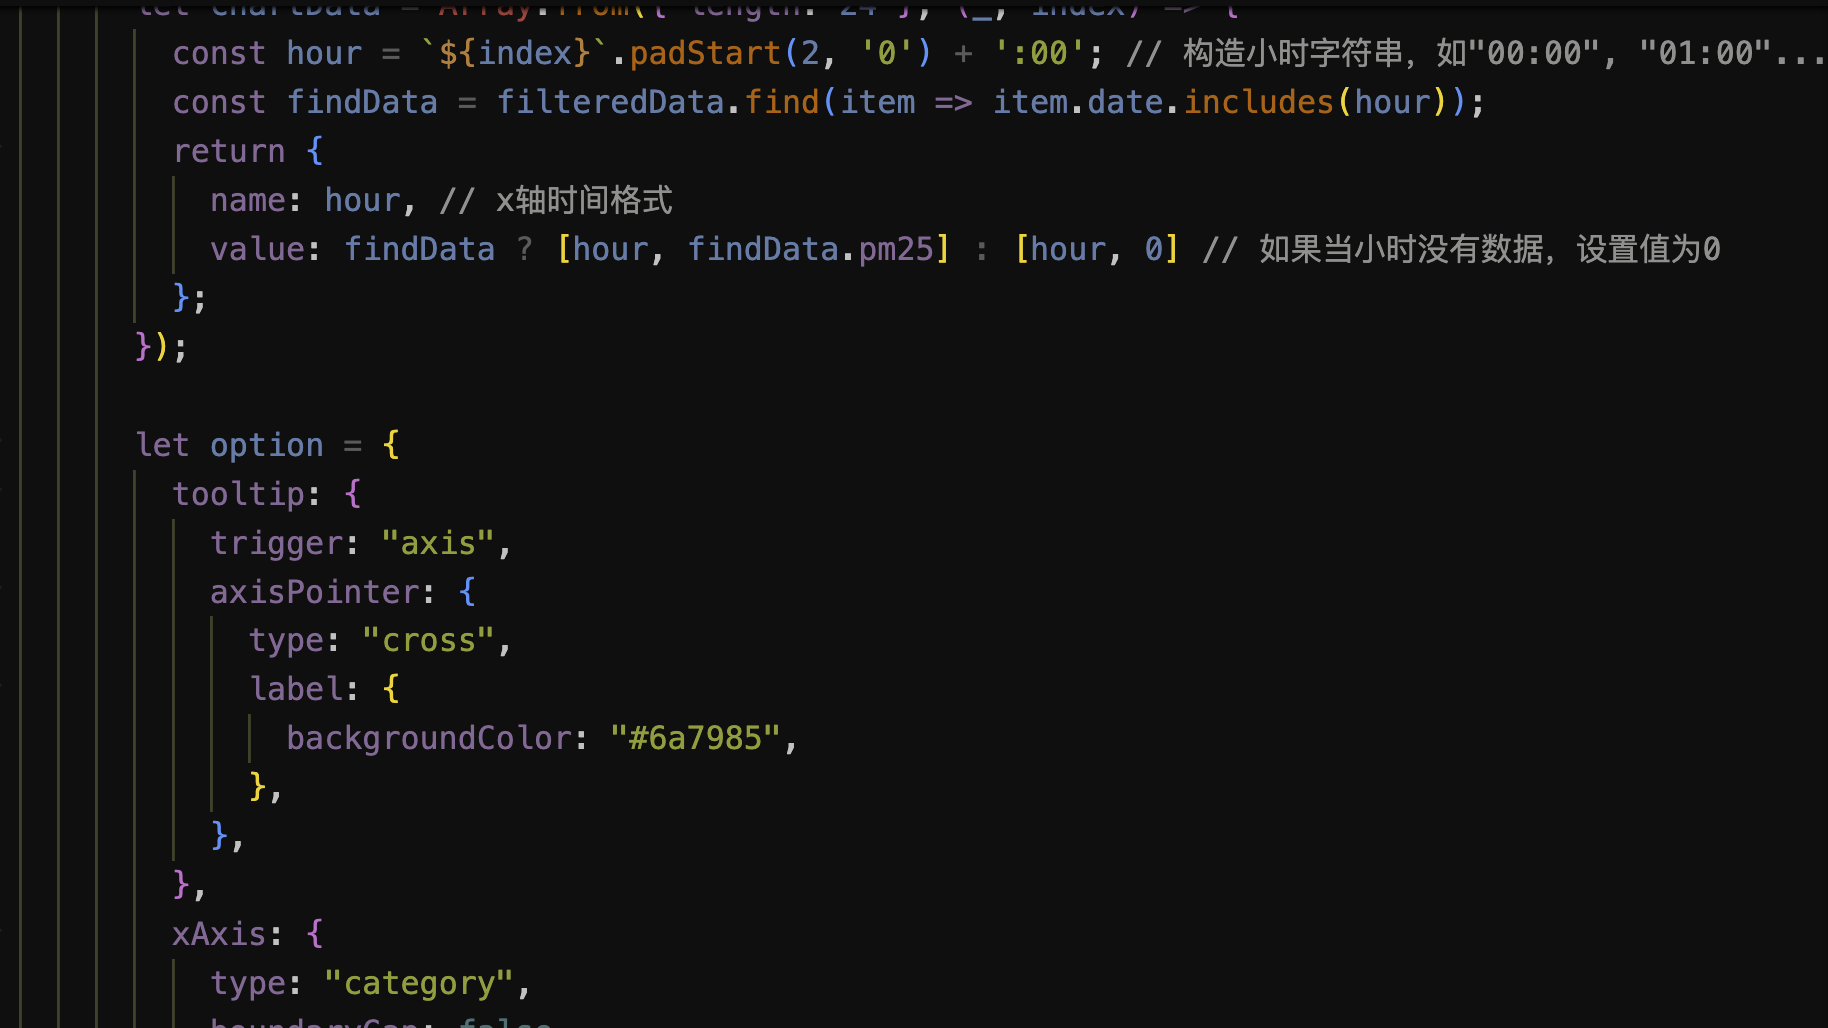
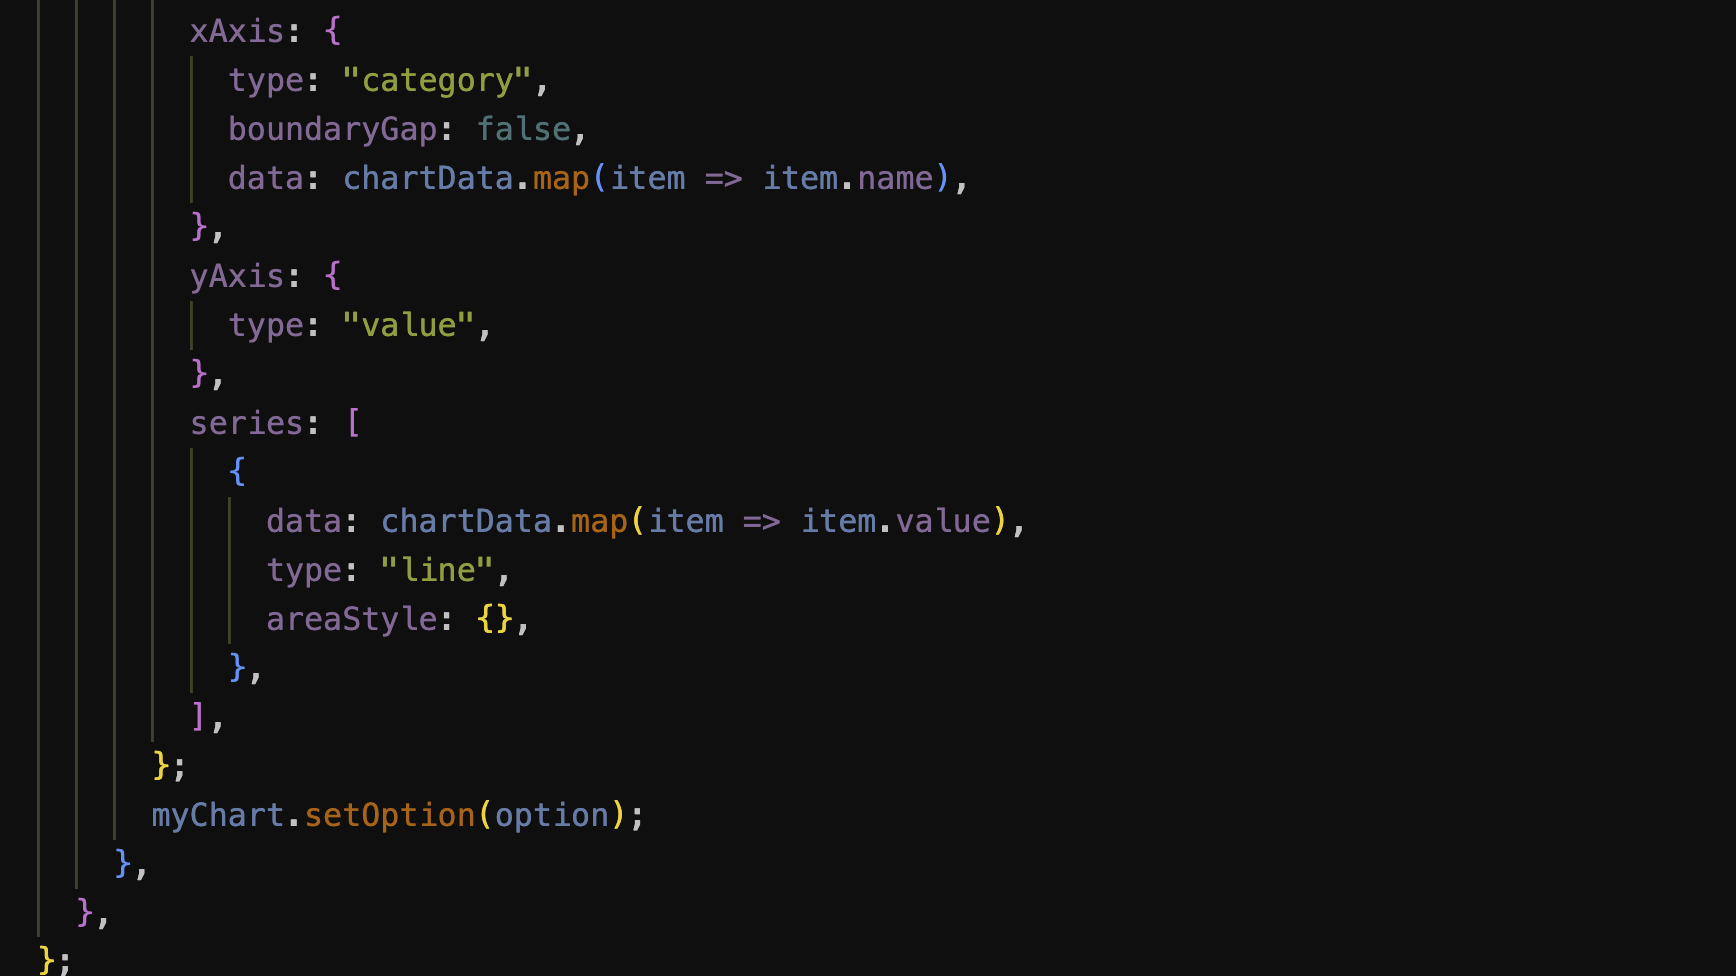
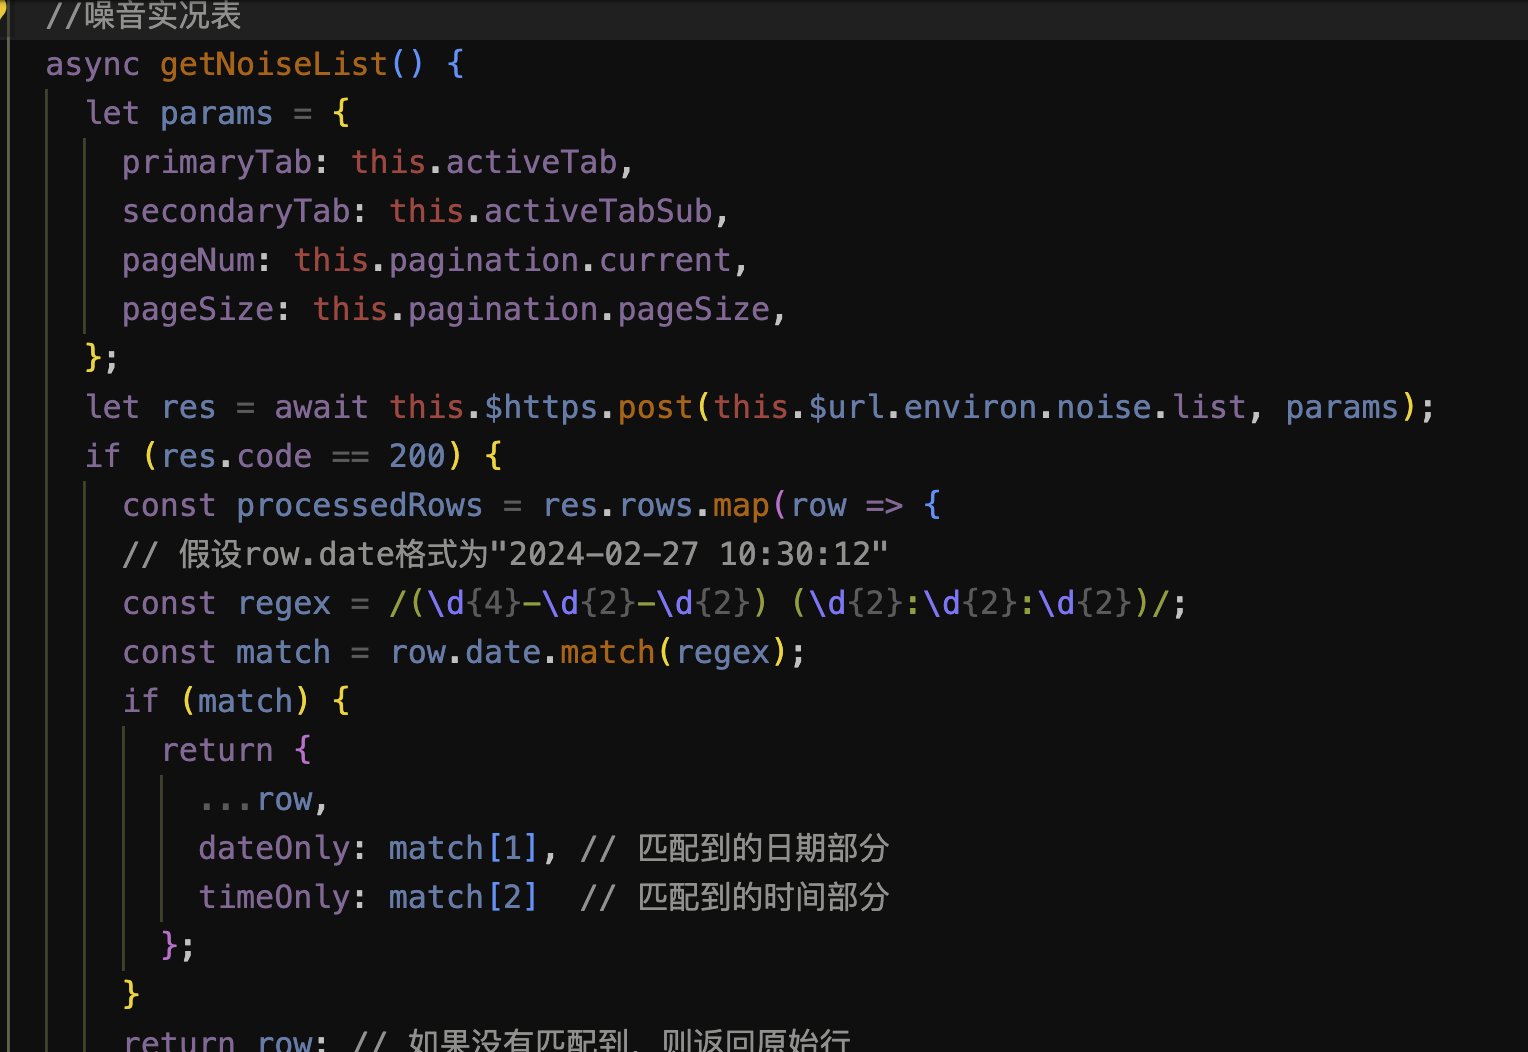
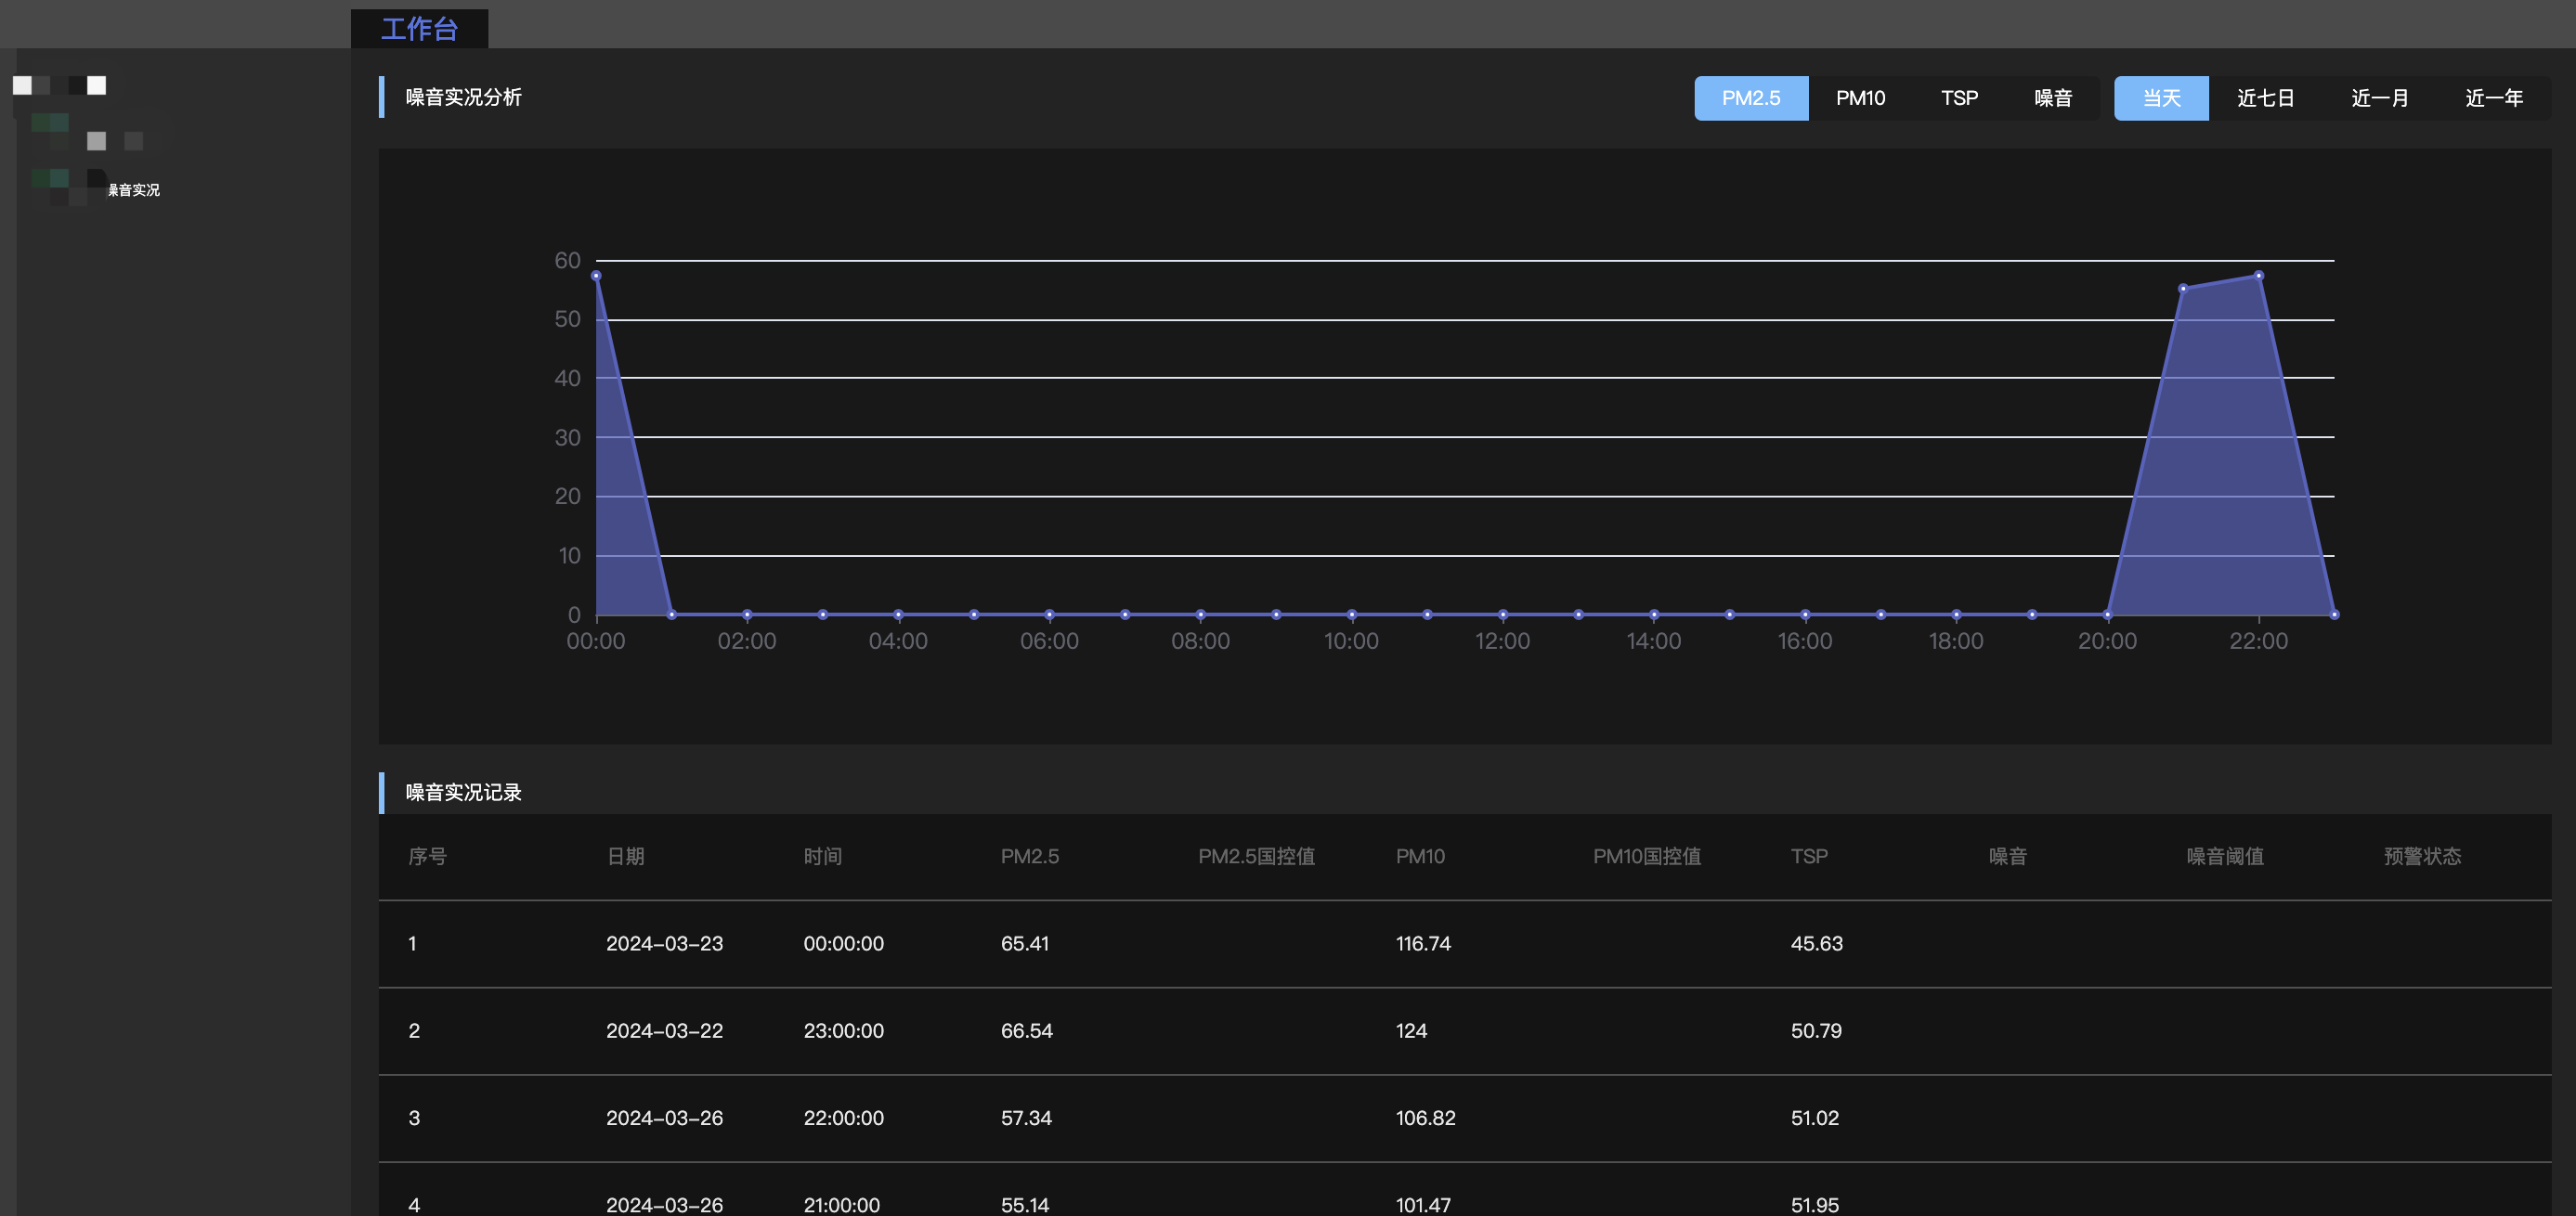
四、问:根据后端返回数据生成列表和折线图,折线图中如果后端返回的date不是系统的日期,则没有折线数据,有整点的数据就标上折线,比如:如果有3点、11点的数据,那折线图就只有这两个点;如果当天没有任何时间点的数据,则没有折线数据。我改如何改写上面的代码使其满足要求。最后得到修改后的代码如下:
![]()
![]()
![]()
![]()
![]()
最后前台显示如图:
![]()
总结:现在GPT对CSS支持还没那么好,但是已经对JS支持非常完善,在自己写静态页面后,去和后端调测接口并修改页面显示完全可以用上GPT,当然用GPT的原则是用新不用旧。
现在已经有一些AI能直接通过传入UI设计图自动生成静态页面,但是感觉不太友好(比如CSS的命名是XX1到XX1000,无法人工修改),能够部分节约开发者的时间也是一件好事儿。
发表于
2024-03-26 10:27
豆汤
阅读( 301)
评论()
收藏
举报
|
|


 浙公网安备 33010602011771号