


[Graphviz]一些简单的例子(未完待续)
1.设置点和线的形状和颜色
简单的例子
- digraph是有向图,graph是无向图。->用在有向图中,—用在无向图中,不能混用。
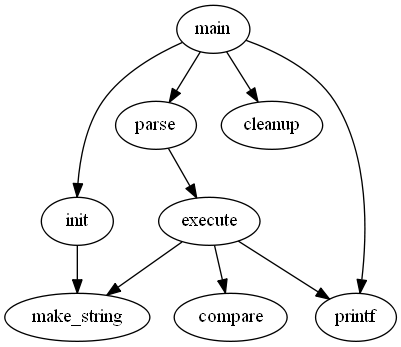
digraph G {                      //给出了图的类型和名字
main -> parse -> execute;        //当一个点第一次出现,它就被创建了
main -> init;                    //用->标识符创建一条边
main -> cleanup;
execute -> make_string;
execute -> printf
init -> make_string;
main -> printf;
execute -> compare;
}
- 得到的图像
![]()
稍复杂一点的例子
- 边的属性:在每条边后面的双括号里设置边的属性。也可以用edge设置边的默认值。
- 点的属性:必须给每个点单独地设置一个属性,node表示点的默认值。
- Rmk
- 点的默认参数是shape=ellipse, width=.75, height=.5 and labeled by the node name.
- 一些点的形状在appendix.h中,一些常用的形状有bos, circle, record, plaintext.
digraph G {
size="4,4";                                            //把图的尺寸设为4 inch * 4 inch
main [shape=box]; /*this is a comment*/                //把main点的形状设为方形
main -> parse [weight=8];                              //weight是设置了这条边的重要程度,默认是1
parse -> execute;
main -> init [style=dotted];                           //让这条线是点状的
main -> cleanup;
execute -> { make_string;printf}                       //这条语句一次连了两条线
init -> make_string;
edge[color=red]; //so is this                          //把边的默认颜色设为了red
main -> printf [style=bold,label="100 times"];         //label就是在边上写了一行字
make_string [label="make a\nstring"];                  //让make_string变成了一个两行的字符串(注意其中的\n)
node [shape=box,style=filled,color="0.7 .3 1.0"];      //设置了点的默认参数,蓝色,被用在了compare中
execute -> compare;
}
- 得到的图像
![]()

关于边的例子
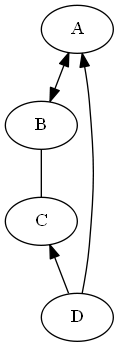
- 可以设置每条边箭头的方向,用dir,有forward(default),back,both,none四种
digraph html {
A -> B [dir = both];
B -> C [dir = none];
C -> D [dir = back];
D -> A [dir = forward];
}
- 得到的图像
![]()
关于点的例子
- 点的shape除了record和Mrecord这两种之外,其他的形状都是多边形,而我们可以对多边形进行属性上的设置,shape=polygon。
- Sides用于设置它的边数
- peripheries用于设置多边形的外框的层数
- regular=true可以让你的多边形是规则的
- orientation=*,可以让你的多边形旋转一个角度,如orientation=15就是旋转了15度
- Skew后面跟一个(-1.0,1.0)的小数,能让你的图形斜切一个角度
- distortion是让你的图形产生透视效果
digraph G {
a -> b -> c;
b -> d;
a [shape = polygon, sides = 5, peripheries = 3, color = lightblue, style = filled];
c [shape = polygon, sides = 4, skew = .4, label = "hello world"]
d [shape = invtriangle];
e [shape = polygon, sides = 4, distortion = .7];
}
- 得到的图像
![]()

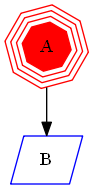
再一个关于点的例子
digraph A {
A -> B;
A [orientation = 15, regular = true, shape = polygon, sides = 8, peripheries = 4, color = red, style = filled];
B [shape = polygon, sides = 4, skew = 0.5, color = blue];
}
- 得到的图像
![]()
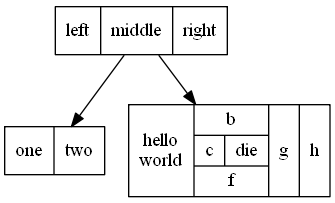
record的例子
- record和Mrecord的区别 Mrecord的角是圆的,record是由横的和竖的矩形组成的图形。
digraph structs {
node [shape = record];
struct1 [shape = record, label = "<f0> left|<f1> mid\dle|<f2> right"];
struct2 [shape = record, label = "<f0> one|<f1> two"];
struct3 [shape = record, label = "hello\nworld|{b|{c|<here> die}|f}|g|h"];
struct1 -> struct2;
struct1 -> struct3;
}
- 得到的图形
![]()
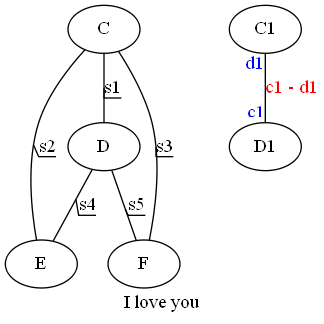
线上写字的例子
- Rmk:当你的线和线label比较多时,可以给线的属性decorate=true,使得每条线的label与所属线之间连线。你还可以给每条线加上headlabel和taillabel,给每条线的起始点和终点加上label,他们的颜色由labelfontcolor来决定,而label的颜色由fontcolor来决定。
graph A {
label = "I love you";
labelloc = b;
labeljust = 1;
edge [decorate = true];
C -- D [label = "s1"];
C -- E [label = "s2"];
C -- F [label = "s3"];
D -- E [label = "s4"];
D -- F [label = "s5"];
edge [decorate = false, labelfontcolor = blue, fontcolor = red];
C1 -- D1 [headlabel = "c1", taillabel = "d1", label = "c1 - d1"];
}
- 得到的图形
![]()
用html语言
- Rmk:在dot中我们可以用html语言写一个table。在label后用<>而不是””就可以引入html语言。
digraph html {
abc [shape = none, margin = 0, label =<
<TABLE BORDER="0" CELLBORDER="1" CELLSPACING="0" CELLPADDING="4">
<TR><TD ROWSPAN="3"><FONT COLOR="red">hello</FONT><BR/>world</TD>
<TD COLSPAN="3">b</TD>
<TD ROWSPAN="3" BGCOLOR="lightgrey">g</TD>
<TD COLSPAN="3">h</TD>
</TR>
<TR><TD>c</TD>
<TD PORT="here">d</TD>
<TD>e</TD>
</TR>
<TR><TD COLSPAN="3">f</TD>
</TR>
</TABLE>>];
}
-
得到的图形
![]()
-
下面我们创造了一个5*5的表格,我们可以在表格中打字。

digraph html {
abc [shape = none, margin = 0, label =<
<TABLE BORDER="0" CELLBORDER="1" CELLSPACING="0" CELLPADDING="4">
<TR><TD>0</TD><TD>1</TD><TD>2</TD><TD>3</TD><TD>4</TD>
</TR>
<TR><TD>1</TD><TD></TD><TD></TD><TD></TD><TD></TD>
</TR>
<TR><TD>2</TD><TD></TD><TD></TD><TD></TD><TD></TD>
</TR>
<TR><TD>3</TD><TD></TD><TD></TD><TD></TD><TD></TD>
</TR>
<TR><TD>4</TD><TD></TD><TD></TD><TD></TD><TD></TD>
</TR>
</TABLE>>];
}
- 得到的图形
![]()

2.设置点和线的位置(子图的概念)
- 默认时图中的线都是从上到下的,可以改为从左到右。在文件的最上层加上rankdir=LR就是从左到右,默认shiTB(top->bottom),也可以是RL,BT。
- 当图中有时间轴之类的时,我们会需要点能排在一行(列),这时要用到rank,用花括号吧rank=same,然后把需要并排的点一次输入。

 浙公网安备 33010602011771号