Prometeheus
Prometheus 是⼀款基于时序数据库的开源监控告警系统,⾮常适合Kubernetes集群的监控。Prometheus的基本
原理是通过HTTP协议周期性抓取被监控组件的状态,任意组件只要提供对应的HTTP接⼝就可以接⼊监控。不需要
任何SDK或者其他的集成过程。这样做⾮常适合做虚拟化环境监控系统,⽐如VM、Docker、Kubernetes等。输出
被监控组件信息的HTTP接⼝被叫做exporter 。⽬前互联⽹公司常⽤的组件⼤部分都有exporter可以直接使⽤,⽐
如Varnish、Haproxy、Nginx、MySQL、Linux系统信息(包括磁盘、内存、CPU、⽹络等等)。
Promethus有以下特点:
⽀持多维数据模型:由度量名和键值对组成的时间序列数据
内置时间序列数据库TSDB
⽀持PromQL查询语⾔,可以完成⾮常复杂的查询和分析,对图表展示和告警⾮常有意义
⽀持HTTP的Pull⽅式采集时间序列数据
⽀持PushGateway采集瞬时任务的数据
⽀持服务发现和静态配置两种⽅式发现⽬标
⽀持接⼊Grafana
(⼀)指标暴露
每⼀个被Prometheus监控的服务都是⼀个Job,Prometheus为这些Job 提供了官⽅的SDK ,利⽤这个SDK可以⾃
定义并导出⾃⼰的业务指标,也可以使⽤Prometheus官⽅提供的各种常⽤组件和中间件的Exporter(⽐如常⽤的
MySQL,Consul等等)。对于短时间执⾏的脚本任务或者不好直接 Pull指标的服务,Prometheus提供了
PushGateWay⽹关给这些任务将服务指标主动推Push到⽹关,Prometheus再从这个⽹关⾥Pull指标。
(⼆)指标抓取
上⾯提到了Push和Pull,其实这是两种指标抓取模型。
Pull模型:监控服务主动拉取被监控服务的指标。
被监控服务⼀般通过主动暴露metrics端⼝或者通过Exporter的⽅式暴露指标,监控服务依赖服务发现模块发现被
监控服务,从⽽去定期的抓取指标。
Push模型:被监控服务主动将指标推送到监控服务,可能需要对指标做协议适配,必须得符合监控服务要求
的指标格式。
对于Prometheus中的指标抓取,采⽤的是Pull模型,默认是⼀分钟去拉取⼀次指标,通过Prometheus.yaml配置
⽂件中的scrape_interval配置项配置,Prometheus对外都是⽤的Pull模型,⼀个是Pull Exporter的暴露的指标,
⼀个是Pull PushGateway暴露的指标。
(三)指标存储和查询
指标抓取后会存储在内置的时序数据库中,Prometheus也提供了PromQL 查询语⾔给我们做指标的查询,我们可
以在Prometheus的WebUI上通过 PromQL,可视化查询我们的指标,也可以很⽅便的接⼊第三⽅的可视化⼯具,
例如grafana。
(四)监控告警
prometheus提供了alertmanageer基于PromQL来做系统的监控告警,当promql查询出来的指标超过我们定义的
阈值时,prometheus会发送⼀条告警信息到alertmanager,manager会将告警下发到配置好的邮箱或者微信。
(五)服务发现
Kubernetes_sd: ⽀持从Kubernetes中⾃动发现服务和采集信息。⽽Zabbix监控项原型就不适合Kubernets,因为
随着Pod的重启或者升级,Pod的名称是会随机变化的。
file_sd: 通过配置⽂件来实现服务的⾃动发现
(六)图形化展示
通过ProQL语句查询指标信息,并在⻚⾯展示。虽然Prometheus⾃带UI界⾯,但是⼤部分都是使⽤Grafana出
图。另外第三⽅也可以通过 API 接⼝来获取监控指标。
对⽐Zabbix
主要使⽤场景区别是,Zabbix适合⽤于虚拟机、物理机的监控,因为每个监控指标是以 IP 地址作为标识进⾏区分
的。⽽Prometheus的监控指标是由多个 label 组成,IP地址并不是唯⼀的区分指标,Prometheus 强⼤在可以⽀
持⾃动发现规则,因此适合于容器环境。
从⾃定义监控项⻆度⽽⾔,Prometheus 开发难度较⼤,zabbix配合shell脚本更加⽅便。Prometheus在监控虚拟
机上业务时,可能需要安装多个 exporter,⽽zabbix只需要安装⼀个 Agent。
Prometheus 采⽤拉数据⽅式,即使采⽤的是push-gateway,prometheus也是从push-gateway拉取数据。⽽
Zabbix可以推可以拉
Metric指标
 数据模型
Prometheus采集的所有指标都是以时间序列的形式进⾏存储,每⼀个时间序列有三部分组成:

- 指标名和指标标签集合:metric_name{<label1=v1>,<label2=v2>....},指标名:表示这个指标是监控哪⼀⽅
   ⾯的状态,⽐如http_request_total表示:请求数量;指标标签,描述这个指标有哪些维度,⽐如
   http_request_total这个指标,有请求状态码code= 200/400/500,请求⽅式:method=get/post等,实际上
   指标名称实际上是以标签的形式保存,这个标签是name,即:name=。

- 时间戳:描述当前时间序列的时间,单位:毫秒。

- 样本值:当前监控指标的具体数值,⽐如http_request_total的值就是请求数是多少。

可以通过查看Prometheus的metrics接⼝查看所有上报的指标:

所有的指标也都是通过如下所示的格式来标识的:
# HELP // HELP:这⾥描述的指标的信息,表示这个是⼀个什么指标,统计什么的
# TYPE // TYPE:这个指标是什么类型的
<metric name>{<label name>=<label value>, ...} value // 指标的具体格式,<指标名>{标签集
合} 指标值

指标类型
Prometheus 底层存储上其实并没有对指标做类型的区分,都是以时间序列的形式存储,但是为了⽅便⽤户的使⽤
和理解不同监控指标之间的差异,Prometheus 定义了 4 种不同的指标类型:计数器 counter,仪表盘 gauge,直
⽅图 histogram,摘要 summary。
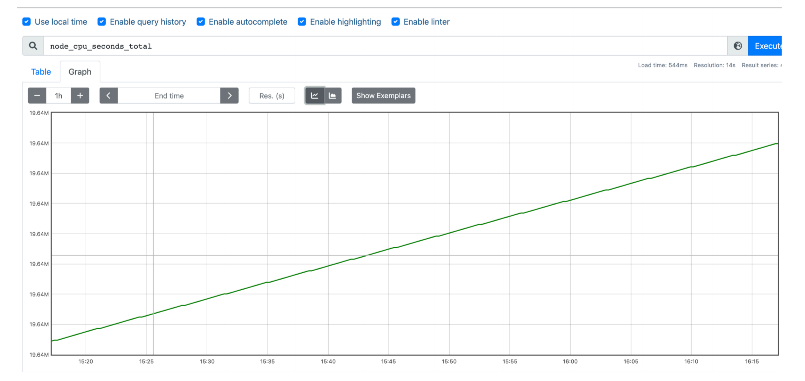
Counter 计数器:
Counter 类型和 redis 的⾃增命令⼀样,只增不减,通过 Counter 指标可以统计 Http 请求数量,请求错误数,接
⼝调⽤次数等单调递增的数据。同时可以结合 increase 和 rate 等函数统计变化速率,后续我们会提到这些内置函
数。
# HELP node_cpu_seconds_total Seconds the CPUs spent in each mode.
# TYPE node_cpu_seconds_total counter
node_cpu_seconds_total{cpu="0",mode="idle"} 103131.82
node_cpu_seconds_total{cpu="0",mode="iowait"} 12.93
node_cpu_seconds_total{cpu="0",mode="irq"} 0
node_cpu_seconds_total{cpu="0",mode="nice"} 1.47
node_cpu_seconds_total{cpu="0",mode="softirq"} 57.99
node_cpu_seconds_total{cpu="0",mode="steal"} 0
node_cpu_seconds_total{cpu="0",mode="system"} 545.18
node_cpu_seconds_total{cpu="0",mode="user"} 629.29
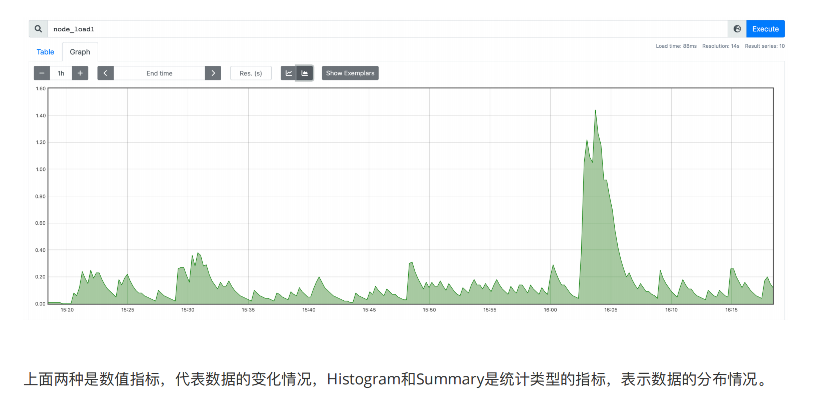
Gauge仪表盘
和Counter不同,Gauge是可增可减的,可以反映⼀些动态变化的数据,例如当前内存占⽤,CPU利⽤,Gc次数等
动态可上升可下降的数据,在Prometheus上通过Gauge,可以不⽤经过内置函数直观的反映数据的变化情况,如
下图表示堆可分配的空间⼤⼩:
# HELP node_load1 1m load average.
# TYPE node_load1 gauge
node_load1 0.55
Histogram 直⽅图
Histogram 是⼀种直⽅图类型,可以观察到指标在各个不同的区间范围的分布情况,如下图所示:可以观察到请求
耗时在各个桶的分布。

# HELP http_request_duration_seconds HTTP request duration in seconds.
# TYPE http_request_duration_seconds histogram
http_request_duration_seconds_bucket{le="0.1"} 0
http_request_duration_seconds_bucket{le="0.2"} 1
http_request_duration_seconds_bucket{le="0.5"} 2
http_request_duration_seconds_bucket{le="1"} 2
http_request_duration_seconds_bucket{le="+Inf"} 3
http_request_duration_seconds_sum 0.3
http_request_duration_seconds_count 3

示例中定义了⼀个名为 http_request_duration_seconds 的Histogram指标类型,⽤于记录HTTP请求的响应时
间分布情况。根据设置,该指标会将响应时间分为0-0.1秒、0.1-0.2秒、0.2-0.5秒、0.5-1秒和1秒以上五个桶,并
记录每个桶中的请求次数。 在示例中,第⼀个桶(0-0.1秒)中没有请求,第⼆个桶(0.1-0.2秒)中有1个请求,第
三个桶(0.2-0.5秒)中有2个请求,第四个桶(0.5-1秒)中有0个请求,第五个桶(1秒以上)中有0个请求。因
此,总请求数为3。同时,响应时间总和为0.3秒。 通过这些数据,我们可以计算出中位数、平均响应时间等统计数
据,从⽽更好地了解系统的性能状况。
Summary 摘要
Summary 也是⽤来做统计分析的,和 Histogram 区别在于,Summary 直接存储的就是百分位数,如下所示:可
以直观的观察到样本的中位数,P90 和 P99。

# HELP api_request_duration_seconds API request duration in seconds.
# TYPE api_request_duration_seconds summary
api_request_duration_seconds{quantile="0.5"} 0.2
api_request_duration_seconds{quantile="0.9"} 0.3
api_request_duration_seconds{quantile="0.99"} 0.31
api_request_duration_seconds_sum 1.3
api_request_duration_seconds_count 10

定义了⼀个名为 api_request_duration_seconds 的Summary指标类型,⽤于记录API请求的响应时间分布情
况。与Histogram不同的是,Summary不会将值分为多个桶,⽽是直接记录样本值和分位数(quantile)信息。
在示例中,分别记录了50th、90th和99th分位数对应的响应时间,以及总响应时间和请求数。根据这些数据,我
们可以计算出中位数、90th分位数、99th分位数、平均响应时间等统计数据,从⽽更好地了解API的性能状况。
指标导出
1 Exporter的来源
指标导出有两种⽅式,⼀种是使⽤ Prometheus 社区提供的定制好的 Exporter 对⼀些组件诸如 MySQL,Kafka 等
的指标作导出,也可以利⽤社区提供的 Client 来⾃定义指标导出。

从Exporter的来源上来讲,主要分为两类:

社区提供的
Prometheus社区提供了丰富的Exporter实现,涵盖了从基础设施,中间件以及⽹络等各个⽅⾯的监控功能。这些
Exporter可以实现⼤部分通⽤的监控需求。下表列举⼀些社区中常⽤的Exporter:
范围 		常用Exporter
数据库 		MySQL Exporter, Redis Exporter, MongoDB Exporter, MSSQL Exporter等
硬件 		Apcupsd Exporter, loT Edison Exporter, IPMl Exporter, Node Exporter等
消息队列 	Beanstalkd Exporter, Kafka Exporter, NSQ Exporter, RabbitMQ Exporter等
存储 		Ceph Exporter, Gluster Exporter, HDFS Exporter, ScalelO Exporter等
HTTP服务 	Apache Exporter, HAProxy Exporter, Nginx Exporter等
API服务 		AWS ECS Exporter, Docker Cloud Exporter, Docker Hub Exporter, GitHub Exporter等
日志 		Fluentd Exporter, Grok Exporter等
监控系统 	Collectd Exporter, Graphite Exporter, InfluxDB Exporter, Nagios Exporter, SNMP Exporter等
其它 		Blockbox Exporter, JIRA Exporter, Jenkins Exporter, Confluence Exporter等

⽤户⾃定义的
除了直接使⽤社区提供的Exporter程序以外,⽤户还可以基于Prometheus提供的Client Library创建⾃⼰的
Exporter程序,⽬前Promthues社区官⽅提供了对以下编程语⾔的⽀持:Go、Java/Scala、Python、Ruby。同时
还有第三⽅实现的如:Bash、C++、Common Lisp、Erlang,、Haskeel、Lua、Node.js、PHP、Rust等

go开发web应⽤集成prometheus sdk metrics:
github.com/prometheus/client_golang/prometheus/promhttp

go程序的集成promethe sdk:
package main
import (
 "fmt"
 "net/http"
 "github.com/prometheus/client_golang/prometheus"
 "github.com/prometheus/client_golang/prometheus/promhttp"
)
var (
 MyCounter prometheus.Counter
Count int = 0
)
// init 注册指标
func init() {
 // 1.定义指标(类型,名字,帮助信息)
 MyCounter = prometheus.NewCounter(prometheus.CounterOpts{
 Name: "my_counter_total",
 Help: "⾃定义counter",
 })
 // 2.注册指标
 prometheus.MustRegister(MyCounter)
}
// Sayhello
func Sayhello(w http.ResponseWriter, r *http.Request) {
 // 接⼝请求量递增
 MyCounter.Inc()
 Count++
 fmt.Fprintf(w, "Hello Wrold! counter:%v ", Count)
}
func main() {
 http.Handle("/metrics", promhttp.Handler())
 http.HandleFunc("/counter", Sayhello)
 http.ListenAndServe(":8080", nil)
}

127.0.0.1:8080/metrics 监控metrics指标接⼝
127.0.0.1:8080/counter 访问这个接⼝来进⾏计数
Prometheus简单部署
此处仅简单部署Promethues监控,⽤于熟悉Prometheus查询语句和配置⽂件。

1. 部署Prometheus
部署环境依赖
环境依赖: docker docker-compose
请⾃⾏安装,参考如下:
https://blog.csdn.net/u010734213/article/details/124844470

1. 部署和配置prometheus
Prometheus + Altermanage+pushgateway+blackbox

docker-compose:
version: '3'

networks:
   monitor:
       driver: bridge

services:
    prometheus:
        build: ./prometheus/soft/prometheus-dockerfile/
        container_name: prometheus
        hostname: prometheus
        restart: always
        environment:
            - TZ=Asia/Shanghai
        volumes:
            - /etc/timezone:/etc/timezone
            - /etc/localtime:/etc/localtime
            - ./prometheus/prometheus.yml:/prometheus/prometheus.yml
            - ./prometheus/rules:/prometheus/rules
            - ./prometheus/data/:/prometheus/data/
            - ./prometheus/sd_config/:/prometheus/sd_config/
        ports:
            - "9090:9090"
        networks:
            - monitor
    grafana:
        image: grafana/grafana
        container_name: grafana
        hostname: grafana
        restart: always
        environment:
            - TZ=Asia/Shanghai
        volumes:
            - /etc/localtime:/etc/localtime
            - ./grafana:/var/lib/grafana/
        ports:
            - "3000:3000"
        networks:
            - monitor
    alertmanager:
        image: prom/alertmanager:latest
        container_name: alertmanager
        hostname: alertmanager
        restart: always
        environment:
            - TZ=Asia/Shanghai
        volumes:
            - ./alertmanager/:/etc/alertmanager/
        ports:
            - "9093:9093"
            - "9094:9094"
        networks:
            - monitor

      #主动推送数据
    pushgateway:
        image: prom/pushgateway
        container_name: pushgateway
        hostname: pushgateway
        restart: always
        environment:
            - TZ=Asia/Shanghai
        volumes:
            - /etc/localtime:/etc/localtime
        ports:
            - "9091:9091"
        networks:
            - monitor

      #⿊盒探测
    blackbox-exporter:
        image: prom/blackbox-exporter:v0.21.1
        container_name: blackbox-exporter
        environment:
            - TZ=Asia/Shanghai
        ports:
            - 9115:9115
        networks:
            - monitor

prometheus 配置⽂件:
global:
  scrape_interval: 15s #数据抓取间隔
  evaluation_interval: 15s #告警规则评估间隔

#alertmanagers 关联prometheus
alerting:
  alertmanagers:
  - static_configs:
    - targets:
      - alertmanager:9093 #alertmanager地址

#告警规则
rule_files:
  - "./rules/*.yml"

#抓取配置
scrape_configs:
  #默认的metrics_path=/metrics
  - job_name: 'prometheus'
    static_configs:
    - targets: ['prometheus:9090']

  - job_name: 'node'
    file_sd_configs:
    - files: ['./sd_config/node.yml']
      refresh_interval: 15s

  - job_name: 'alertmanager'
    static_configs:
    - targets: ['alertmanager:9093']

  - job_name: 'pushgateway'
    scrape_interval: 5s
    static_configs:
    - targets: ['pushgateway:9091']
    honor_labels: true

  - job_name: 'cadvisor'
    file_sd_configs:
    - files: ['./sd_config/cadvisor.yml']
      refresh_interval: 15s

  - job_name: 'redis'
    file_sd_configs:
    - files: ['./sd_config/redis.yml']
      refresh_interval: 15s

  - job_name: 'mysql'
    file_sd_configs:
    - files: ['./sd_config/mysqld.yml']
      refresh_interval: 15s

  - job_name: 'nginx'
    file_sd_configs:
    - files: ['./config/nginx-hosts.yml']
      refresh_interval: 15s

  - job_name: 'nacos'
    metrics_path: /nacos/actuator/prometheus
    file_sd_configs:
    - files: ['./sd_config/nacos.yml']
      refresh_interval: 15s

  - job_name: 'process'
    file_sd_configs:
    - files: ['./sd_config/process.yml']
      refresh_interval: 15s


 #http探测
  - job_name: 'blackbox-http'
    metrics_path: /probe
    params:
      module: [http_2xx]
    file_sd_configs:
      - files: ['./sd_config/blackbox-http.yml']
        refresh_interval: 5s
    relabel_configs:
      - source_labels: [__address__]
        target_label: __param_target
      - source_labels: [__param_target]
        target_label: instance
      - target_label: __address__
        replacement: blackbox-exporter:9115

 #tcp 探测
  - job_name: 'blackbox-tcp'
    metrics_path: /probe
    params:
      module: [tcp_connect]

    file_sd_configs:
      - files:
        - './sd_config/blackbox-tcp.yml'
        - './sd_config/cc-*.yml'
        - './sd_config/nacos.yml'
        refresh_interval: 5s

    relabel_configs:
      - source_labels: [__address__]
        target_label: __param_target
      - source_labels: [__param_target]
        target_label: instance
      - target_label: __address__
        replacement: blackbox-exporter:9115

2 部署 Exporter
在部署Prometheus后,发现图像界⾯的Target中node状态异常,因为prometheus⽆法通过 http://192.168.9.3:9100/metrics

[root@nginx node-exporter]# cd /app/compose/prom/exporter/node-exporter && dockercompose up -d

[root@nginx node-exporter]# docker ps |egrep node-ex
cf5e91439d8f quay.io/prometheus/node-exporter "/bin/node_exporter …" 2 hours ago
 Up 2 hours
 node-exporter
mysql监控
mysql创建权限说明
CREATE USER 'exporter'@'%' IDENTIFIED BY 'exporter123' WITH MAX_USER_CONNECTIONS 3;
GRANT PROCESS, REPLICATION CLIENT, SELECT ON *.* TO 'exporter'@'%';

mysql-exporter/docker-compose.yml:
version: '3'

networks:
    monitor:
        driver: bridge

services:
    mysqlexporter:
        image: prom/mysqld-exporter                  #镜像需要选择合适的版本否则有问题
        container_name: mysqld-exporter
        ports:
            - "9104:9104"
        environment:
            - TZ=Asia/Shanghai
            - DATA_SOURCE_NAME=root:Wazx@123(127.0.0.1:3306)/newfs      #写正确的用户密码和ip端口
        networks:
            - monitor

配置promethes
#/app/compose/prom/prometheus/prometheus.yml
 - job_name: 'mysql'
 file_sd_configs:
 - files: ['./sd_config/mysqld.yml']
 refresh_interval: 15s

[root@nginx prometheus]# cat ./sd_config/mysqld.yml
- targets: ['192.168.9.3:9104']
 labels:
 app: mysql

check
有如下输出说明安装成功
[root@10-1-106-77 mysqld-exporter]# docker-compose ps
NAME COMMAND SERVICE STATUS
PORTS
mysqld-exporter "/bin/mysqld_exporter" mysqlexporter running
0.0.0.0:9104->9104/tcp

[root@10-1-106-77 mysqld-exporter]# ss -lntup |egrep $(docker-compose ps | awk
'NR>1{print $NF}' | sed -r 's#(.*:)(.*)(-.*)#\2#g')
tcp LISTEN 0 4096 *:9104 *:* users:
(("docker-proxy",pid=5237,fd=4))

[yun@10-1-106-77 ~]$ curl -s 127.0.0.1:9104/metrics | head -n 3
# HELP go_gc_cycles_automatic_gc_cycles_total Count of completed GC cycles generated by
the Go runtime.
# TYPE go_gc_cycles_automatic_gc_cycles_total counter
go_gc_cycles_automatic_gc_cycles_total 33317
redis 监控
redis-exporter/docker-compose.yml备注说明
version: '3'

networks:
   monitor:
       driver: bridge

services:
    redis-exporter:
      image: bitnami/redis-exporter:latest
      container_name: redis_exporter
      hostname: redis_exporter
      environment:
          - TZ=Asia/Shanghai
      ports:
          - "9121:9121"
      networks:
          - monitor
      command: [ "-redis.addr", "redis://172.21.16.15:6379", "-redis.password", "123456"]


配置promethes
#/app/compose/prom/prometheus/prometheus.yml
 - job_name: 'redis'
 file_sd_configs:
 - files: ['./sd_config/redis.yml']
 refresh_interval: 15s

[root@nginx prometheus]# cat ./sd_config/redis.yml
- targets:
 - 172.21.16.15:9121
 labels:
 app: redis
zk 监控
docker run --name zookeeper -p2181:2181 -e "ZOO_4LW_COMMANDS_WHITELIST=*" --restart always -d zookeeper

zk-exporter/docker-compose.yml备注说明
version: '3'

networks:
    monitor:
        driver: bridge

services:
    zookeeperexporter:
        image: dabealu/zookeeper-exporter
        container_name: zookeeper-exporter
        ports:
            - 9141:9141
        environment:
            - TZ=Asia/Shanghai
        networks:
            - monitor
        command: --zk-hosts="172.21.16.15:2181"


配置promethes
#/app/compose/prom/prometheus/prometheus.yml
 - job_name: 'redis'
 file_sd_configs:
 - files: ['./sd_config/redis.yml']
 refresh_interval: 15s

[root@nginx prometheus]# cat ./sd_config/redis.yml
- targets:
 - 192.168.9.3:9121
 labels:
 app: redis
nginx监控
nginx-module-vts模块介绍:
这是⼀个Nginx模块,提供对虚拟主机状态信息的访问。它包含当前状态,例如servers, upstreams, caches。这类
似于nginx plus的实时活动监视。内置的html和旧版本的演示⻚⾯也保持⼀致。这个模块主要就是来监控nginx虚
拟主机状态的。
⾸先,指令vhost_traffic_status_zone是必需的,如果指令vhost_traffic_status_display被设置,可以通过下⽅式
访问:
/status/format/json
请求/status/format/json将⽤⼀个包含当前活动数据的json⽂档进⾏响应,以便在实时仪表板和三⽅监视⼯具中使
⽤。
/status/format/html
请求/status/format/html将会⽤⼀个内置的内置的html仪表板⽹⻚进⾏响应,该仪表盘的内部请求
⾛/status/format/json。
/status/format/jsonp
请求/status/format/jsonp将⽤⼀个jsonp回调函数进⾏响应,该函数包含⽤于实时仪表板和三⽅监视⼯具的当前活
动数据。
/status/format/prometheus
请求/status/format/prometheus将⽤包含当前活动数据的prometheus⽂档来响应。
/status/control
请求/status/control将返回基于查询语句字符串重置或删除区域后的JSON⽂档。更多可以参考Control

下载
https://github.com/vozlt/nginx-module-vts

#nginx编译新增模块
./configure --add-module=/root/middleware/nginx/nginx-module-vts-0.2.1
make && make install

#新的编译
./configure --prefix=/usr/local/nginx --with-http_stub_status_module --withhttp_ssl_module --with-http_gzip_static_module --addmodule=/root/middleware/nginx/nginx-module-vts-0.2.1
make && make install

检查是否开启 nginx-module-vts
#如果输出结果有包含 rhs-module-vts 说明已经集成
./nginx -V 2>&1 | grep -o nginx-module-vts

nginx 中新增配置在listen 80中添加如下配置(cc.conf)
vim /usr/local/nginx//conf/nginx.conf

http {
 vhost_traffic_status_zone; --添加
 ...

 server {
 listen 80 ;
 location /status {
 vhost_traffic_status_display; #添加
 vhost_traffic_status_display_format html; #添加
 }
 }
}

nginx-exporter/docker-compose.yml 备注说明
version: '3'

networks:
   montior:
      driver: bridge

services:
     nginxexporter:
         image: sophos/nginx-vts-exporter
         container_name: nginx-vts-exporter
         ports:
             - 9913:9913
         environment:
             - TZ=Asia/Shanghai
             - NGINX_STATUS=http://82.156.244.3/status/fortmat/json
         networks:
             - montior

配置promethes
#/app/compose/prom/prometheus/prometheus.yml
 - job_name: 'nginx'
 file_sd_configs:
 - files: ['./sd_config/nginx-hosts.yml']
 refresh_interval: 15s

[root@nginx prometheus]# cat ./sd_config/nginx-host.yaml
- targets: ['82.156.244.3:9913']
 labels:
 app: nginx
PromQL
PromQL(Prometheus Query Language)是⼀种⽤于查询和分析Prometheus监控数据的查询语⾔。PromQL提
供了⼀系列功能强⼤的操作符和函数,可以实现灵活、⾼效的数据查询和聚合操作。
<metric_name>{<label_name>=<label_value>,...}[<time_range>]

<metric_name> 表示要查询的指标名称,如 prometheus_http_requests_total 。
<label_name> 和 <label_value> 表示指标的标签名称和对应的值,⽤于对指标进⾏分类和区分。多个标
签之间⽤逗号分隔,如 {method="GET", status="200"} 。
<time_range> 表示查询的时间范围,可以是⼀个时间段,如 [5m] 表示过去5分钟的数据,或是⼀个时间
戳区间,如 timestamp1..timestamp2 。

查询⽅式
瞬时向量:某⼀时刻的时序数据
区间向量:某⼀时间区间内的时序数据集合

1 PromQL 中的指标标签通常可以分为以下⼏类
1. 主机相关标签:以 node_ 开头的标签,⽤于标识被监控主机的相关信息,例如 node_hostname 表示被监控
主机的主机名, node_role 表示被监控主机的⻆⾊等。
2. 应⽤程序相关标签:⽤于标识被监控应⽤程序的相关信息,例如 app_name 表示应⽤程序名
称, app_version 表示应⽤程序版本等。
3. HTTP 相关标签:⽤于标识 HTTP 请求的相关信息,例如 http_method 表示 HTTP 请求⽅
法, http_status_code 表示 HTTP 响应状态码等。
4. RPC 相关标签:⽤于标识远程过程调⽤(RPC)的相关信息,例如 rpc_service 表示 RPC 服务名
称, rpc_method 表示 RPC ⽅法名称等。
5. 数据库相关标签:⽤于标识数据库的相关信息,例如 db_name 表示数据库名称, db_instance 表示数据库
实例名称等。
6. Kubernetes 相关标签:⽤于标识 Kubernetes 集群和容器的相关信息,例如 kubernetes_namespace 表示
Kubernetes 命名空间, container_name 表示容器名称等。 在实际的 PromQL 查询中,可以使⽤这些标签
来筛选出所需的指标数据,通常可以使⽤ label_name="label_value" 的⽅式进⾏筛选。例
如, node_cpu_usage{mode="idle"} 表示筛选出 node_cpu_usage 指标中 mode 标签值为 idle 的数据
点。
7. 状态相关标签:⽤于标识被监控对象的状态信息,例如 status 表示状态, health 表示健康状况等。
8. 时间相关标签:⽤于标识时间信息,例如 timestamp 表示数据点的时间戳, scrape_duration_seconds
表示数据采集时间等。

2 PromQL的聚合函数
PromQL⽀持多种聚合操作,⽤于对指标数据进⾏统计和分析。常⽤的聚合操作包括:
sum :求和操作,⽤于将指标在所有时间序列上的值相加。
avg :平均值操作,⽤于计算指标在所有时间序列上的平均值。
max :最⼤值操作,⽤于计算指标在所有时间序列上的最⼤值。
min :最⼩值操作,⽤于计算指标在所有时间序列上的最⼩值。
count :计数操作,⽤于计算指标在所有时间序列上的数据点数量。
rate :计算指标的速率,⽤于计算指标在⼀段时间内的平均增⻓速率。
irate 通常⽤于计算指标在最近⼀段时间内的瞬时增⻓率,例如,某个服务的请求数在最近⼀分钟内的瞬时
增⻓率,或者某个系统的 CPU 使⽤率在最近 5 秒内的瞬时增⻓率等。

瞬时查询
直接通过指标名即可进⾏查询,查询结果是当前指标最新的时间序列,⽐如查询 Load15分钟:
node_load15

我们可以看到查询出来有多个同名指标结果,可以⽤{}做标签过滤查询:⽐如我们想查指定实例的指标。
node_load15{app="node", env="dev", group="dev", instance="10.1.106.76:9101",job="node"}

⽽且也⽀持则表达式,通过=~指定正则表达式,如下所示:查询所有 instance 是 10.1.106 开头的指标。
node_load15{ instance=~"10.1.106.*"}

范围查询
范围查询的结果集就是区间向量,可以通过[]指定时间来做范围查询,查询15 分钟load值
node_load15{ instance="10.1.106.76:9101"}[5m]

注意:这⾥范围查询第⼀个点并不⼀定精确到刚刚好 5 分钟前的那个时序样本点,他是以 5 分钟作为⼀个区间,寻
找这个区间的第⼀个点到最后⼀个样本点。

时间单位:
d:天,h:⼩时,m:分钟,ms:毫秒,s:秒,w:周,y:年

同样⽀持类似 SQL 中的 offset 查询,如下:查询⼀天前当前 5 分钟前的时序数据集
node_load15{ instance="10.1.106.76:9101"}[5m] offset 1d
promql 常⻅的函数说明
 PromQL的查询示例
下⾯是⼀些常⽤的PromQL查询示例:
查询指标的值: prometheus_http_requests_total
查询指标的某个标签值: prometheus_http_requests_total{handler="/api/v1/query"}
查询指标的时间范围: prometheus_http_requests_total[5m]
计算指标的速率: rate(prometheus_http_requests_total[5m])
计算指标的平均值: avg(prometheus_http_requests_total)
计算指标的总和: sum(prometheus_http_requests_total)
计算指标的增量: delta(prometheus_http_requests_total[5m])
计算指标的标准差: stddev_over_time(prometheus_http_requests_total[5m])

以下是⼀些关于node相关的PromQL查询示例:
1. 查看当前阶段系统负载
node_load1

2. 查询当前节点的CPU使⽤率
100 - (avg by(instance) (irate(node_cpu_seconds_total{mode="idle"}[5m])) * 100)

3. 查询当前节点内存使⽤率
100 - ((node_memory_MemAvailable_bytes) / node_memory_MemTotal_bytes) * 100

4. 查询当前节点磁盘使⽤率
100 - (node_filesystem_avail_bytes{mountpoint="/"} * 100 /
node_filesystem_size_bytes{mountpoint="/"})
监控告警
AlertManager 是 prometheus 提供的告警信息下发组件,包含了对告警信息的分组,下发,静默等策略。配置完
成后可以在 webui 上看到对应的告警策略信息。告警规则也是基于 PromQL 进⾏定制的。

编写告警配置:当 Http_srv 这个服务挂了,Prometheus 采集不到指标,并且持续时间 1 分钟,就会触发告警
groups:
- name: simulator-alert-rule
 rules:
 - alert: HttpSimulatorDown
 expr: sum(up{job="http_srv"}) == 0
 for: 1m
 labels:
 severity: critical

在 prometheus.yml 中配置告警配置⽂件,需要配置上 alertmanager 的地址和告警⽂件的地址
 - job_name: 'alertmanager'
 static_configs:
 - targets: ['alertmanager:9093']
 #告警规则
 rule_files:
 - "./rules/*.yml"

配置告警信息,例如告警发送地址,告警内容模版,分组策略等都在 alertmanager 的配置⽂件中配置:
global:
  resolve_timeout: 5m
  smtp_smarthost: 'smtp.qq.com:465'             #邮箱smtp服务器代理,启用SSL发信, 端口一般是465
  smtp_from: '10206334.qq.com'              #发送邮箱名称
  smtp_auth_username: '10206334.qq.com'              #邮箱名称
  smtp_auth_password: 'bcntgtlpseuibiee'            #邮箱密码或授权码
  smtp_require_tls: false
  wechat_api_url: "https://qyapi.weixin.qq.com/cgi-bin/"
  wechat_api_secret: "gPsT2lT1IsspzE5xOqeHC9UvYPkhMuFTgx-pzQKv0fg"
  wechat_api_corp_id: "ww6dc192d32e82b054"      # 企业微信中企业ID
templates:
  - '/etc/alertmanager/template/wechat.tmpl'
route:
  receiver: wechat # 设置默认接收人
  group_wait: 10s  #组告警等待时间。也就是告警产生后等待10s,如果有同组告警一起发出
  group_interval: 1m  # 如果有不同的组,两组告警的间隔时间
  repeat_interval: 1m # 重复告警的间隔时间,减少相同邮件的发送频率
  group_by: ['env','instance','type','group','job','alertname']  #采用哪个标签来作为分组依据

  #进行分组发送到不同的人  job: pushgateway媒体发送到不同的开发
  routes:
    - receiver: 'email'
      group_wait: 15s
      match:
        alertname: HostContextSwitching

#如果另一个警报正在触发,则禁止规则允许将一组警报静音,如果同一警报已经严重,我们将使用此选项禁用任何警告级别的通知
inhibit_rules:
- source_match:
    severity: 'critical'
  target_match:
    severity: 'warning'
  equal: ['alertname', 'instance']

receivers:
- name: 'default'
  email_configs:
  - to: '10206334@qq.com'
    html: '{{ template "email.default.message" . }}'
    send_resolved: true

- name: wechat
  wechat_configs:
  - corp_id: "ww6dc192d32e82b054"
    to_party: "1"
    agent_id: "1000002"
    api_secret: "iRJkafC4zs_4vQFCa1tfx7WUj6wG5geewggCvu0ZMT0"
    message: '{{ template "wechat.default.message" . }}'
    send_resolved: true


- name: 'email'
  email_configs:
  - to: '10206334@qq.com'
    html: '{{ template "email.default.message" . }}'
    send_resolved: true

 浙公网安备 33010602011771号