Prometheus+Grafana+node-exporter监控
一、安装 Prometheus Server
1.1、运行用户创建
groupadd prometheus
useradd -g prometheus -d /opt/prometheus/ -s /sbin/nologin prometheus
1.2、prometheus server安装
下载地址:https://github.com/prometheus/prometheus/releases/tag/v2.24.1
# 解压缩到指定目录
tar xzf prometheus-2.24.1.linux-amd64.tar.gz -C /opt/
# 创建软链接
ln -sv /opt/prometheus-2.24.1.linux-amd64/ /opt/prometheus
# 如果node_exporter目录已经存在了,则先删除该目录后再创建软链接
1.3、prometheus配置语法校验
# 建议每次修改prometheus配置之后, 都进行语法校验, 以免导致 prometheus server无法启动
./promtool check config prometheus.yml
1.4、启动prometheus
# 此时采用默认配置启动prometheus server,端口默认9090
./prometheus --config.file=prometheus.yml
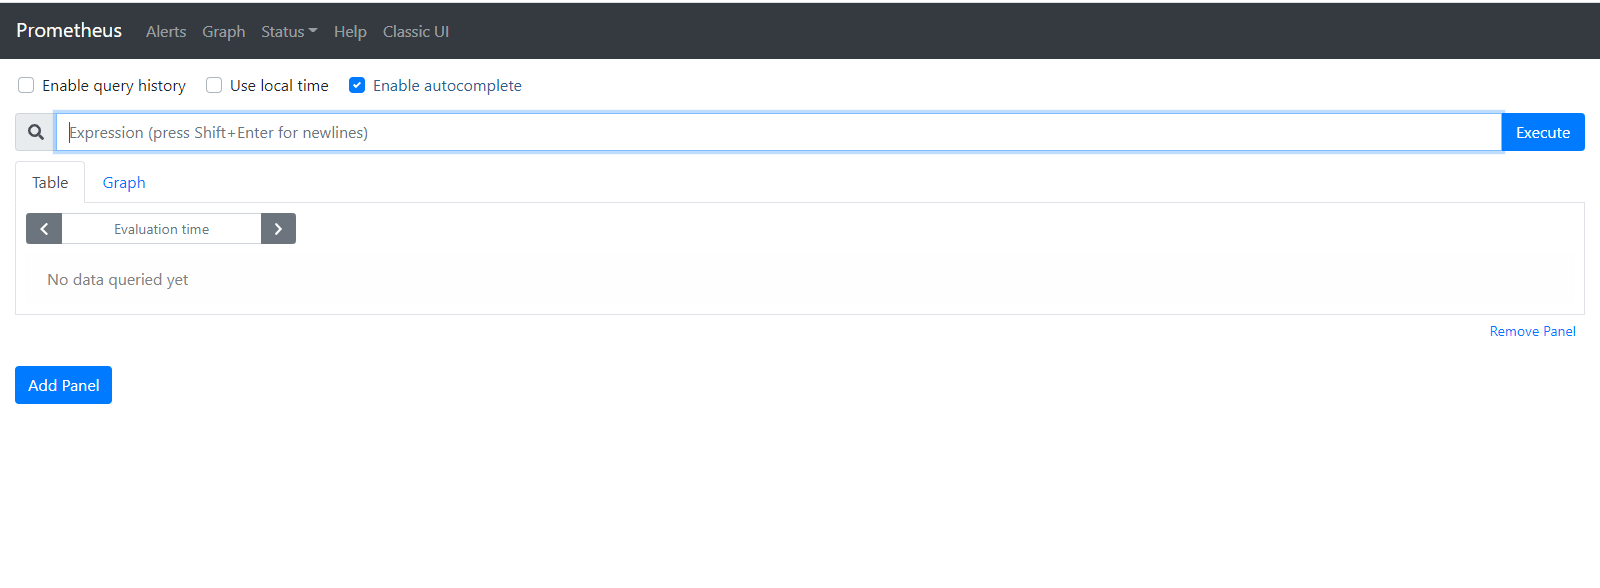
1.5、访问prometheus
http://localhost:9090
1.6、设置prometheus系统服务,并配置开机启动
# 创建服务文件
touch /usr/lib/systemd/system/prometheus.service
chown prometheus:prometheus /usr/lib/systemd/system/prometheus.service
将如下配置写入prometheus.servie
[Unit]
Description=Prometheus
Documentation=https://prometheus.io/
After=network.target

[Service]
Type=simple
User=prometheus
# --storage.tsdb.path=/opt/prometheus/data是可选项,默认数据目录在运行目录的./dada目录中
ExecStart=/opt/prometheus/prometheus --config.file=/opt/prometheus/prometheus.yml --web.enable-lifecycle --storage.tsdb.path=/opt/prometheus/data --storage.tsdb.retention=60d
Restart=on-failure

[Install]
WantedBy=multi-user.target
注意:
如果使用了--storage.tsdb.path参数,则需要给后面路径加上用户权限,如:
chown -R prometheus:prometheus /opt/prometheus/data
Prometheus启动参数说明
- --config.file -- 指明prometheus的配置文件路径
- --web.enable-lifecycle -- 指明prometheus配置更改后可以进行热加载
- --storage.tsdb.path -- 指明监控数据存储路径
- --storage.tsdb.retention --指明数据保留时间
1.7、设置开机启动
systemctl daemon-reload
systemctl enable prometheus.service
systemctl restart prometheus.service
systemctl status prometheus.service
二、配置监控其它linux服务器-安装node_exporter
2.1、监控服务器安装node_exporter
# 运行用户添加
groupadd prometheus
useradd -g prometheus -d /usr/local/node_exporter/ -s /sbin/nologin prometheus
2.2、node_exporter安装
下载地址:https://prometheus.io/download/#node_exporter
# 解压到指定目录
tar -xzf node_exporter-1.1.1.linux-amd64.tar.gz -C /usr/local/
# 删除文件夹
rm -rf /usr/local/node_exporter
# 创建软链接
ln -sv /usr/local/node_exporter-1.1.1.linux-amd64/ /usr/local/node_exporter

# 如果node_exporter目录已经存在了,则先删除该目录后再创建软链接
2.3、设置node_exporter系统服务,并配置开机启动
#创建服务文件
touch /usr/lib/systemd/system/node_exporter.service
chown prometheus:prometheus /usr/lib/systemd/system/node_exporter.service
chown -R prometheus:prometheus /usr/local/node_exporter*
将如下配置写入node_exporter.service
vi /usr/lib/systemd/system/node_exporter.service
[Unit]
Description=node_exporter
After=network.target
[Service]
Type=simple
User=prometheus
ExecStart=/usr/local/node_exporter/node_exporter
Restart=on-failure
[Install]
WantedBy=multi-user.target
2.4、设置开机启动(端口默认9100)
systemctl daemon-reload
systemctl enable node_exporter.service
systemctl start node_exporter.service
systemctl status node_exporter.service
访问API:http://localhost:9100/metrics
三、监控服务器加入prometheus
3.1、在prometheus服务器服务目录添加自定义配置文件
touch /opt/prometheus/personal_config.yml
personal_config.yml添加如下内容:
- targets: ['node_exporter服务器IP:9100']
  labels:
    nodename: node_exporter服务器IP

- targets: ['node_exporter服务器IP:9100']
  labels:
    nodename: node_exporter服务器IP
prometheus.yml添加如下内容:
- job_name: 'prometheus-node'
  file_sd_configs:
  - files: ['/opt/prometheus/personal_config.yml']
    refresh_interval: 5s
prometheus服务器配置文件更新
curl -X POST http://localhost:9090/-/reload
刷新prometheus服务器页面后如下:

四、数据展示Grafana安装配置
下载地址:https://grafana.com/grafana/download
wget https://dl.grafana.com/oss/release/grafana-7.4.2-1.x86_64.rpm
sudo yum install grafana-7.4.2-1.x86_64.rpm
4.1、设置开机启动
sudo /bin/systemctl daemon-reload
sudo /bin/systemctl enable grafana-server.service
sudo /bin/systemctl start grafana-server.service
sudo /bin/systemctl status grafana-server.service
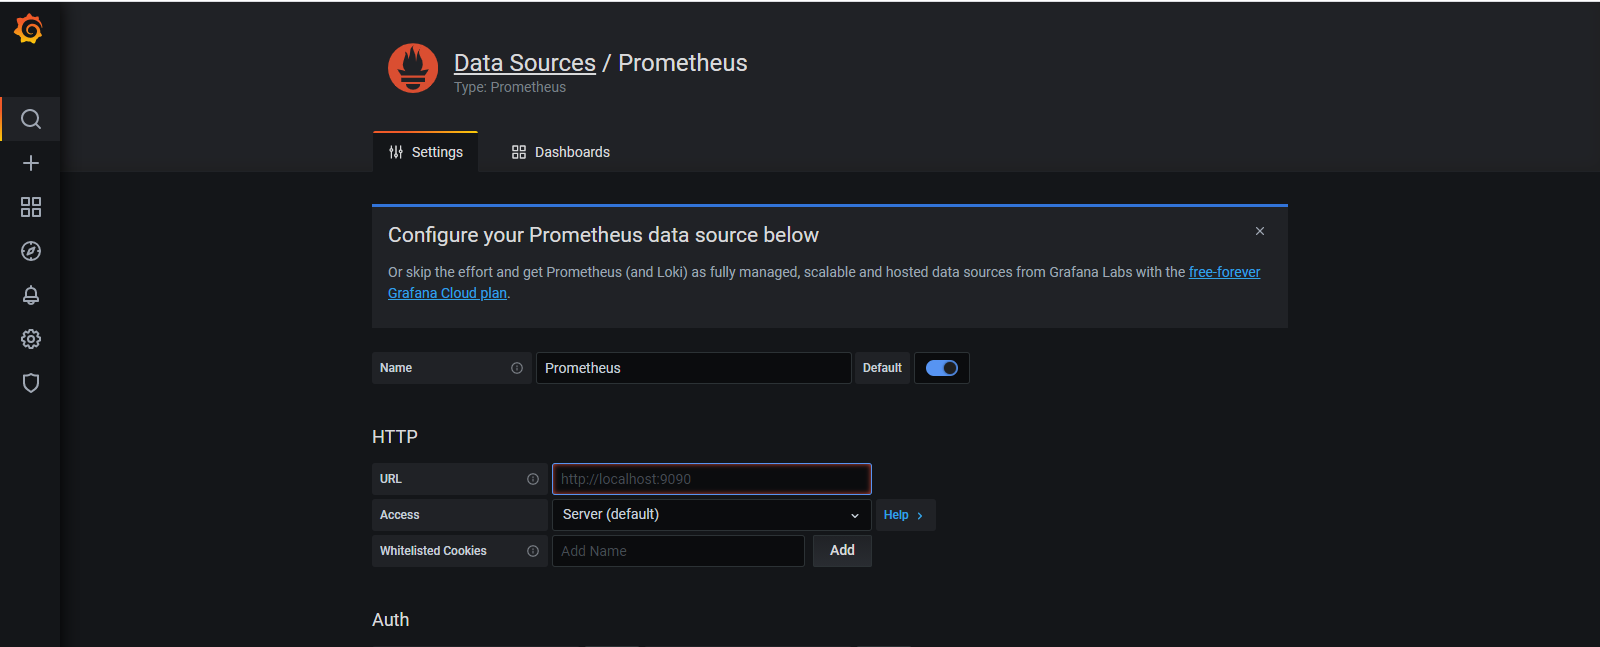
4.2、配置数据源
Grafana默认端口3000,访问地址:http://localhost:3000/,默认用户名密码:admin/admin
在左侧功能栏里找到“Data Sources”,选择“Prometheus”,输入主要信息“Name”和“URL”
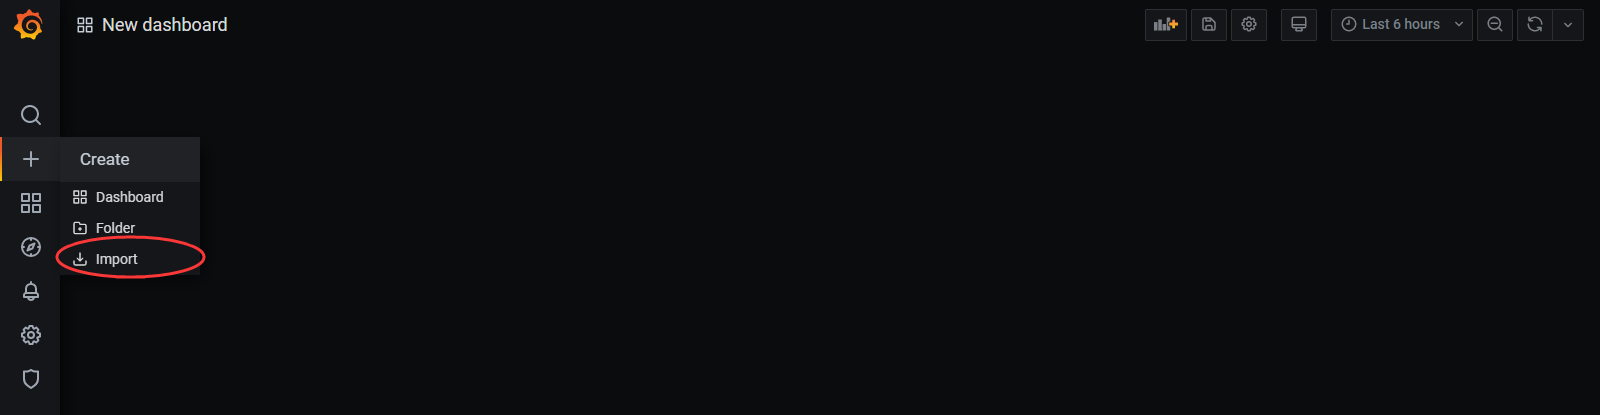
在左侧功能栏里找到“+”,选择“Import”,输入"11074",(此处需要等一会,下载模板)导入Linux监控模板. 并配置数据源为Prometheus,即上一步中的name。
【可选】中文面板:导入时输入以下json即可,不需要输入ID,链接地址:https://grafana.com/api/dashboards/8919/revisions/24/download
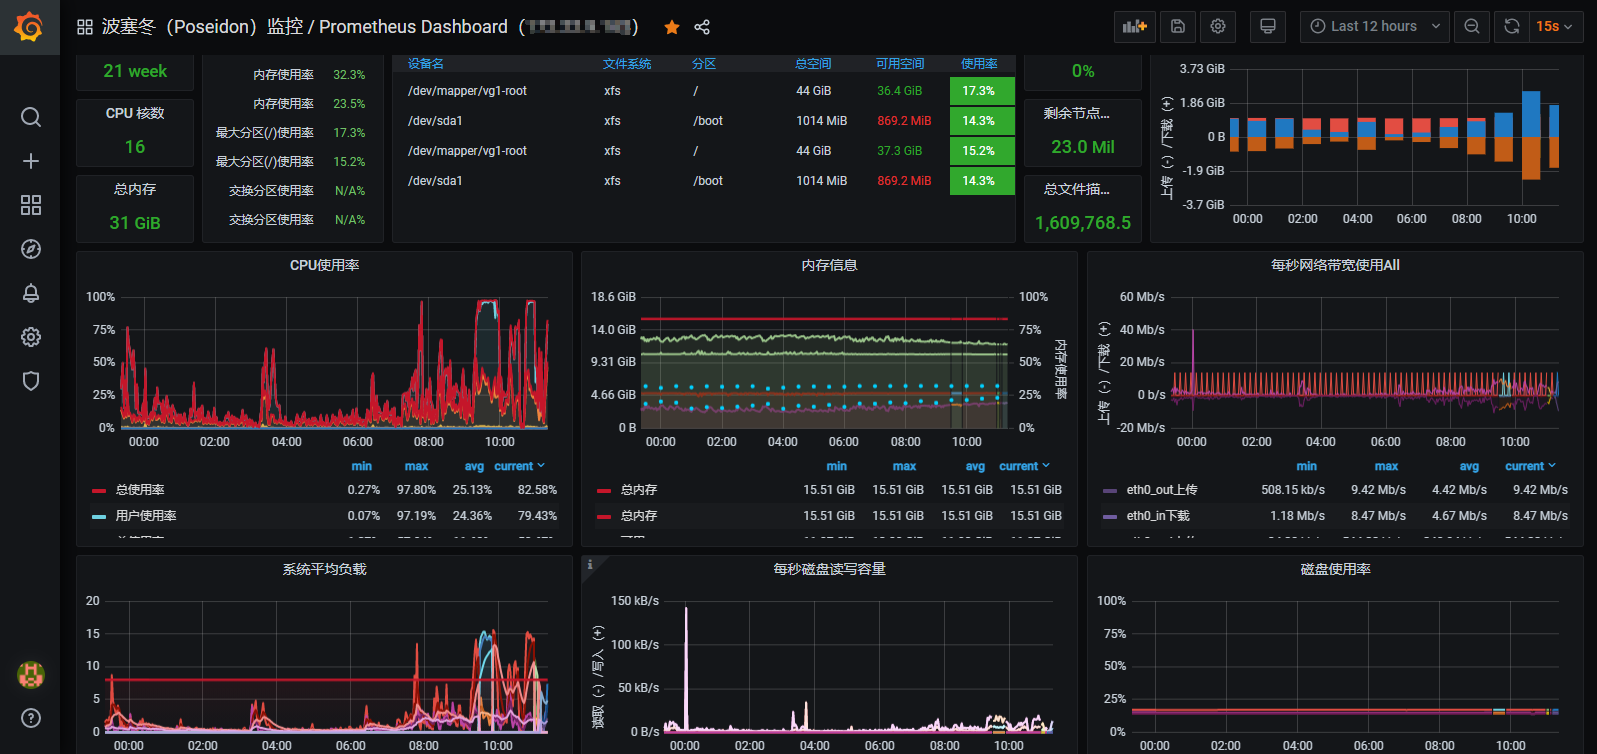
配置完保存后即可看到逼格非常高的系统主机节点监控信息,包括系统运行时间, 内存和CPU的配置, CPU、内存、磁盘、网络流量等信息, 以及磁盘IO、CPU温度等信息。

 浙公网安备 33010602011771号