zabbix 历史数据存入elasticsearch
应用版本信息:
zabbix 版本:4.4.3
elasticsearch 版本:6.8.5
kibana 版本: 6.8.5
系统版本:Centos: 7.7
服务分布:
elasticsearch 192.168.1.105 端口:9500,9100
kibana 192.168.1.105 端口:5601
zabbix_server 192.168.1.103 端口:80
zabbix elasticsearch、kibana安装这里不阐述
配置:
zabbix 配置支持elasticsearch
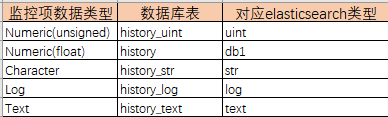
elasticsearch支持的监控项类型:uint,dbl,str,log,text
监控项数据类型|数据库表|对应elasticsearch类型:
修改zabbix_server.conf
Mandatory: no
Default:
HistoryStorageURL=http://192.168.1.105:9500
Option: HistoryStorageTypes
Comma separated list of value types to be sent to the history storage.
Mandatory: no
Default:
HistoryStorageTypes=uint,dbl,str,log,text
Option: HistoryStorageDateIndex
Enable preprocessing of history values in history storage to store values in different indices based on date.
0 - disable
1 - enable
Mandatory: no
Default:
HistoryStorageDateIndex=1
修改 zabbix.conf.php配置文件,增加以下参数:
global $DB, $HISTORY; // 一定要加上$HISTORY,否则不生效
$HISTORY['url'] = 'http://192.168.1.105:9500';
$HISTORY['types'] = ['uint', 'text', 'log', 'str', 'dbl'];
修改示例:
<?php
// Zabbix GUI configuration file.
global $DB, $HISTORY;
$DB['TYPE'] = 'MYSQL';
$DB['SERVER'] = 'localhost';
$DB['PORT'] = '3306';
$DB['DATABASE'] = 'zabbix';
$DB['USER'] = 'zabbix';
$DB['PASSWORD'] = 'zabbix';
// Schema name. Used for IBM DB2 and PostgreSQL.
$DB['SCHEMA'] = '';
$ZBX_SERVER = '192.168.1.103';
$ZBX_SERVER_PORT = '10051';
$ZBX_SERVER_NAME = 'zabbix';
$IMAGE_FORMAT_DEFAULT = IMAGE_FORMAT_PNG;
$HISTORY['url'] = 'http://192.168.1.105:9500';
$HISTORY['types'] = ['uint', 'text', 'log', 'str', 'dbl'];
保存并启动zabbix_server
添加Elasticsearch mapping
curl -H "Content-Type:application/json" -XPUT http://192.168.1.105:9500/uint -d ' { "settings" : { "index" : { "number_of_replicas" : 1, "number_of_shards" : 5 } }, "mappings" : { "values" : { "properties" : { "itemid" : { "type" : "long" }, "clock" : { "format" : "epoch_second", "type" : "date" }, "value" : { "type" : "long" } } } } } '
curl -H "Content-Type:application/json" -XPUT http://192.168.1.105:9500/dbl -d ' { "settings" : { "index" : { "number_of_replicas" : 1, "number_of_shards" : 5 } }, "mappings" : { "values" : { "properties" : { "itemid" : { "type" : "long" }, "clock" : { "format" : "epoch_second", "type" : "date" }, "value" : { "type" : "double" } } } } } '
curl -H "Content-Type:application/json" -XPUT http://192.168.1.105:9500/log -d ' { "settings" : { "index" : { "number_of_replicas" : 1, "number_of_shards" : 5 } }, "mappings" : { "values" : { "properties" : { "itemid" : { "type" : "long" }, "clock" : { "format" : "epoch_second", "type" : "date" }, "value" : { "fields" : { "analyzed" : { "index" : true, "type" : "text", "analyzer" : "standard" } }, "index" : false, "type" : "text" } } } } } '
curl -H "Content-Type:application/json" -XPUT http://192.168.1.105:9500/text -d ' { "settings" : { "index" : { "number_of_replicas" : 1, "number_of_shards" : 5 } }, "mappings" : { "values" : { "properties" : { "itemid" : { "type" : "long" }, "clock" : { "format" : "epoch_second", "type" : "date" }, "value" : { "fields" : { "analyzed" : { "index" : true, "type" : "text", "analyzer" : "standard" } }, "index" : false, "type" : "text" } } } } } '
curl -H "Content-Type:application/json" -XPUT http://192.168.1.105:9500/str -d ' { "settings" : { "index" : { "number_of_replicas" : 1, "number_of_shards" : 5 } }, "mappings" : { "values" : { "properties" : { "itemid" : { "type" : "long" }, "clock" : { "format" : "epoch_second", "type" : "date" }, "value" : { "fields" : { "analyzed" : { "index" : true, "type" : "text", "analyzer" : "standard" } }, "index" : false, "type" : "text" } } } } } '
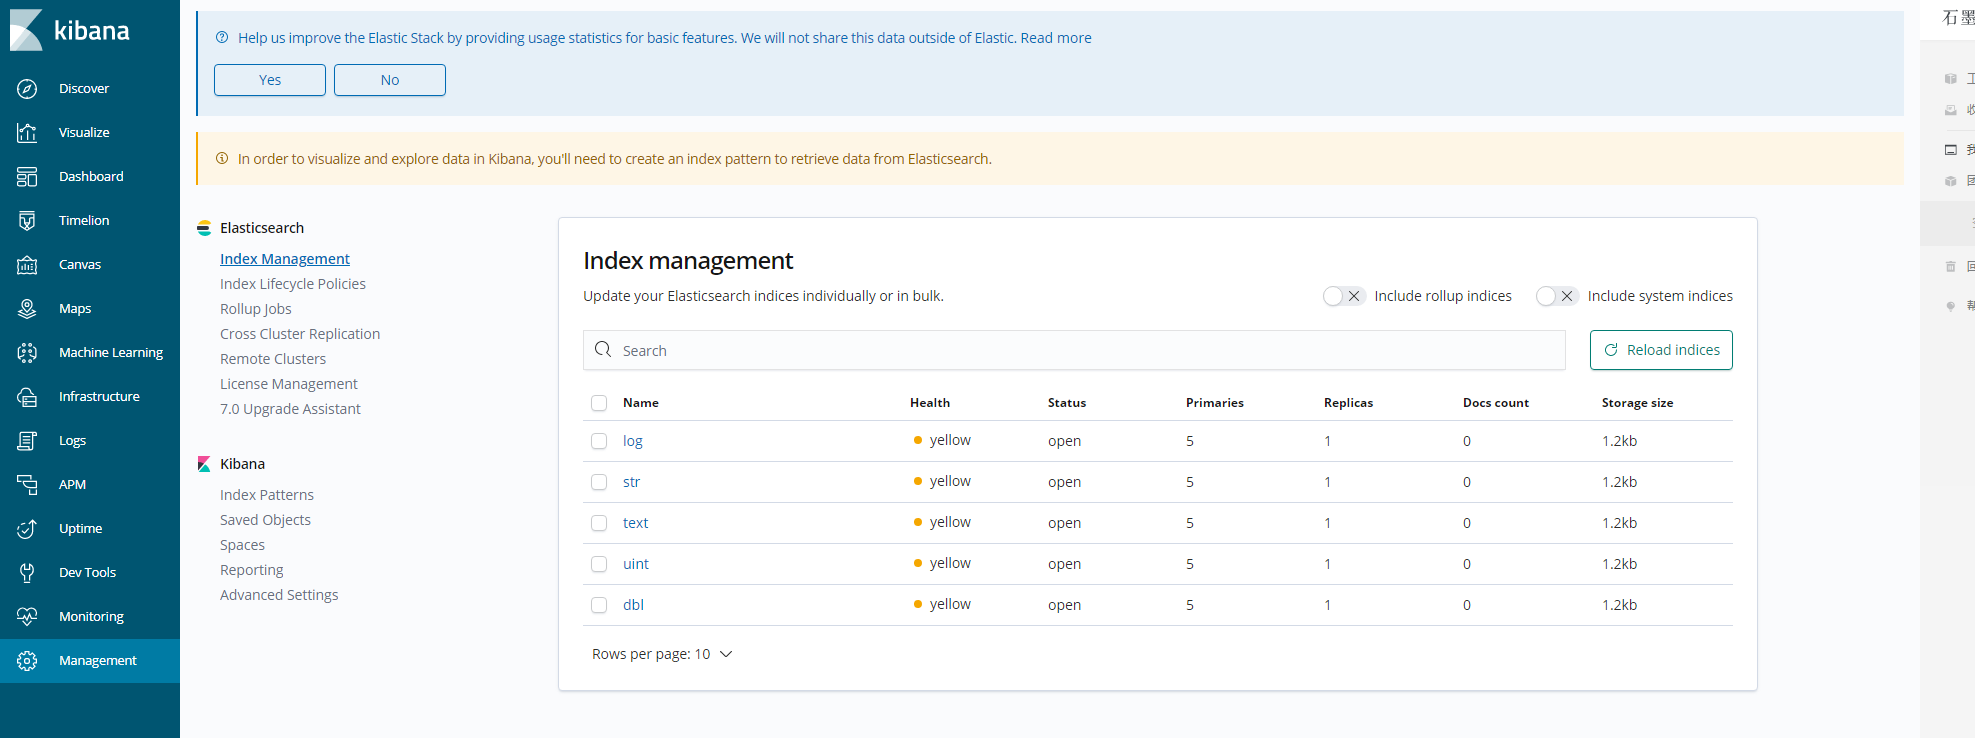
打开kibana或elasticsearch 验证索引:
http:/192.168.1.105:9500,http://192.168.1.105:5601
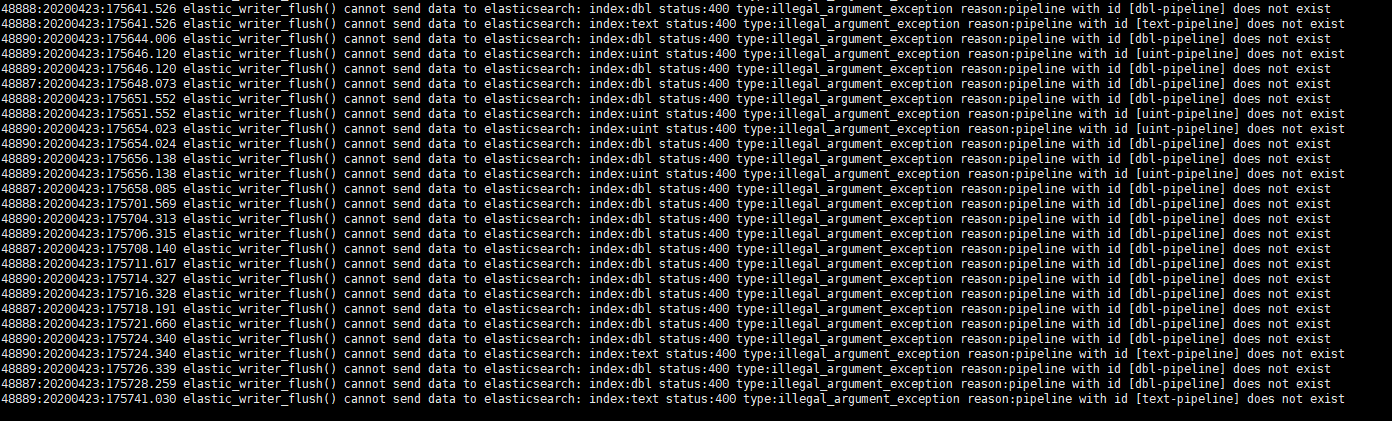
创建Pipeline索引(如果不创建,会报错)
curl -X PUT
http://192.168.1.105:9500/_ingest/pipeline/uint-pipeline
-H 'content-type:application/json'
-d '{
"description": "daily uint index naming",
"processors": [
{
"date_index_name": {
"field": "clock",
"date_formats": ["UNIX"],
"index_name_prefix": "uint-",
"date_rounding": "d"
}
}
]
}'
curl -X PUT
http://192.168.1.105:9500/_ingest/pipeline/dbl-pipeline
-H 'content-type:application/json'
-d '{
"description": "daily uint index naming",
"processors": [
{
"date_index_name": {
"field": "clock",
"date_formats": ["UNIX"],
"index_name_prefix": "uint-",
"date_rounding": "d"
}
}
]
}'
curl -X PUT
http://192.168.1.105:9500/_ingest/pipeline/text-pipeline
-H 'content-type:application/json'
-d '{
"description": "daily uint index naming",
"processors": [
{
"date_index_name": {
"field": "clock",
"date_formats": ["UNIX"],
"index_name_prefix": "uint-",
"date_rounding": "d"
}
}
]
}'
curl -X PUT
http://192.168.1.105:9500/_ingest/pipeline/str-pipeline
-H 'content-type:application/json'
-d '{
"description": "daily uint index naming",
"processors": [
{
"date_index_name": {
"field": "clock",
"date_formats": ["UNIX"],
"index_name_prefix": "uint-",
"date_rounding": "d"
}
}
]
}'
curl -X PUT
http://192.168.1.105:9500/_ingest/pipeline/log-pipeline
-H 'content-type:application/json'
-d '{
"description": "daily uint index naming",
"processors": [
{
"date_index_name": {
"field": "clock",
"date_formats": ["UNIX"],
"index_name_prefix": "uint-",
"date_rounding": "d"
}
}
]
}'
输出以下内容,说明Pipeline就创建成功了
{"acknowledged":true}
创建template
curl -XPUT "http://192.168.1.105:9500/_template/text_template" -H 'Content-Type: application/json' -d'
{
"template": "text",
"index_patterns": ["text"],
"settings" : {
"index" : {
"number_of_replicas" : 1,
"number_of_shards" : 5
}
},
"mappings" : {
"values" : {
"properties" : {
"itemid" : {
"type" : "long"
},
"clock" : {
"format" : "epoch_second",
"type" : "date"
},
"value" : {
"fields" : {
"analyzed" : {
"index" : true,
"type" : "text",
"analyzer" : "standard"
}
},
"index" : false,
"type" : "text"
}
}
}
}
}'
{"acknowledged":true}
创建完以后zabbix server日志正常

配置完成以后出现一个问题,就是zabbix server 已经收集到数据,但是在监控面板不显示数据
在Kibana上可以看到收集到的数据
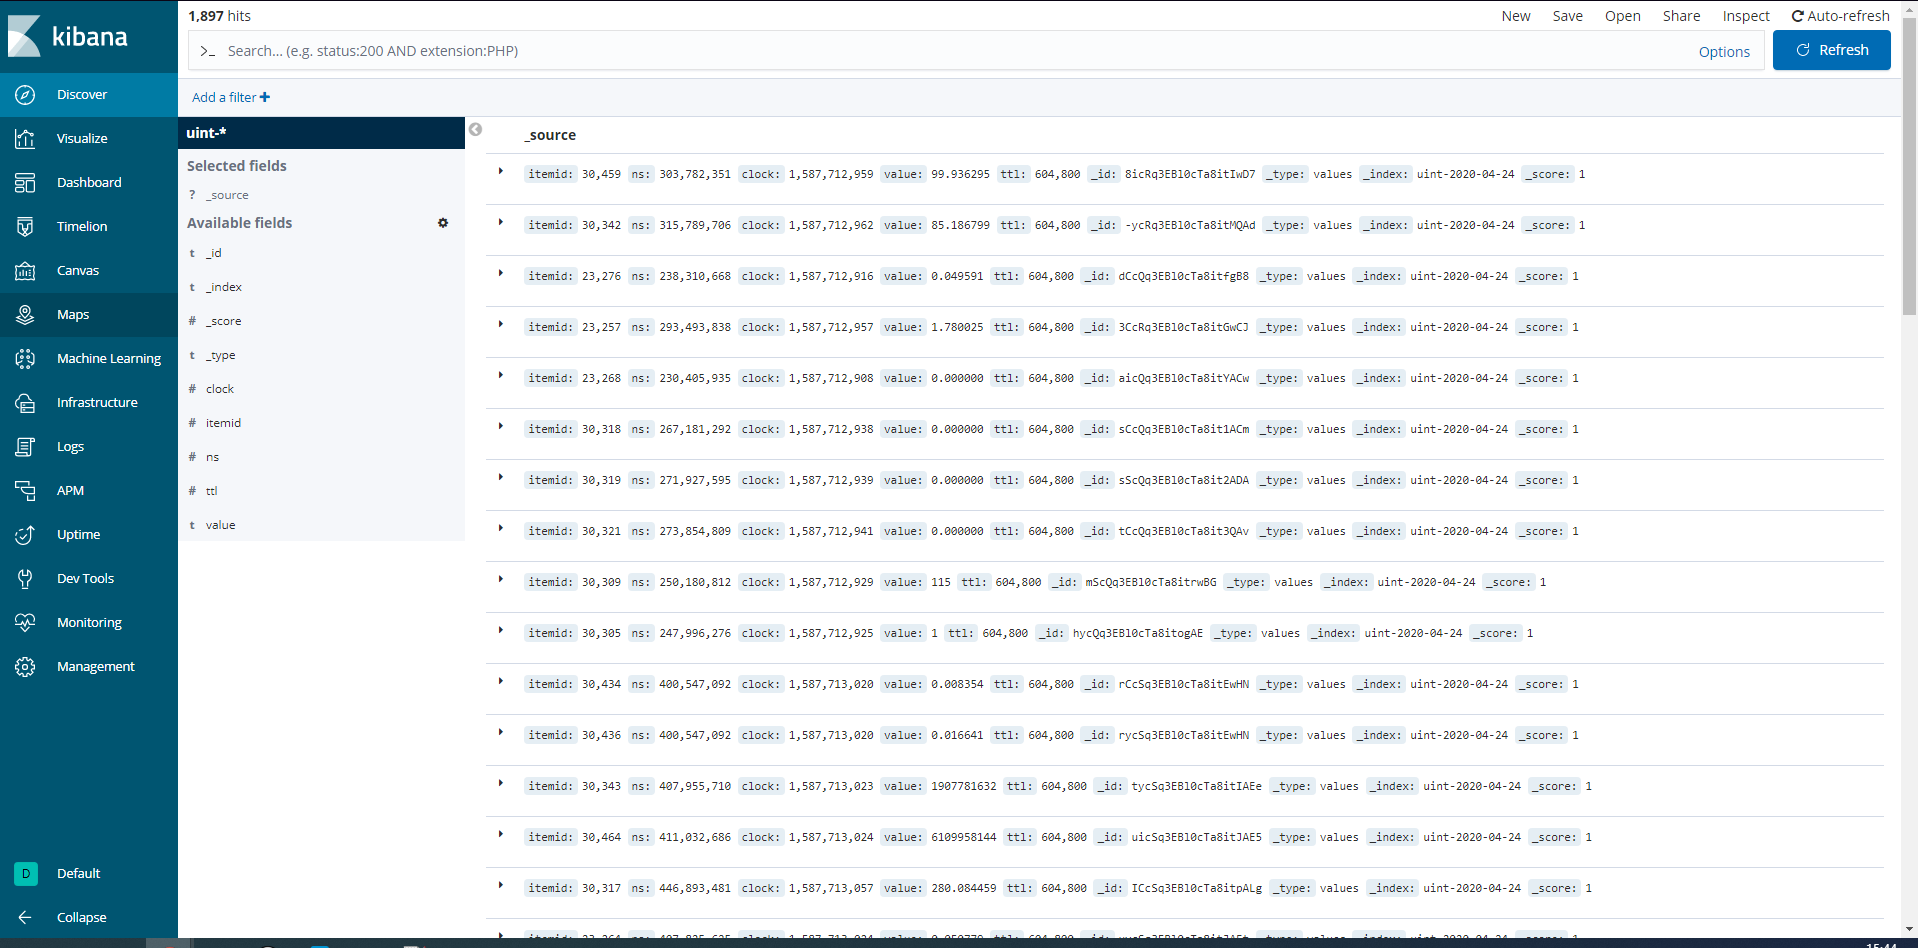
zabbix server监控面板上不显示
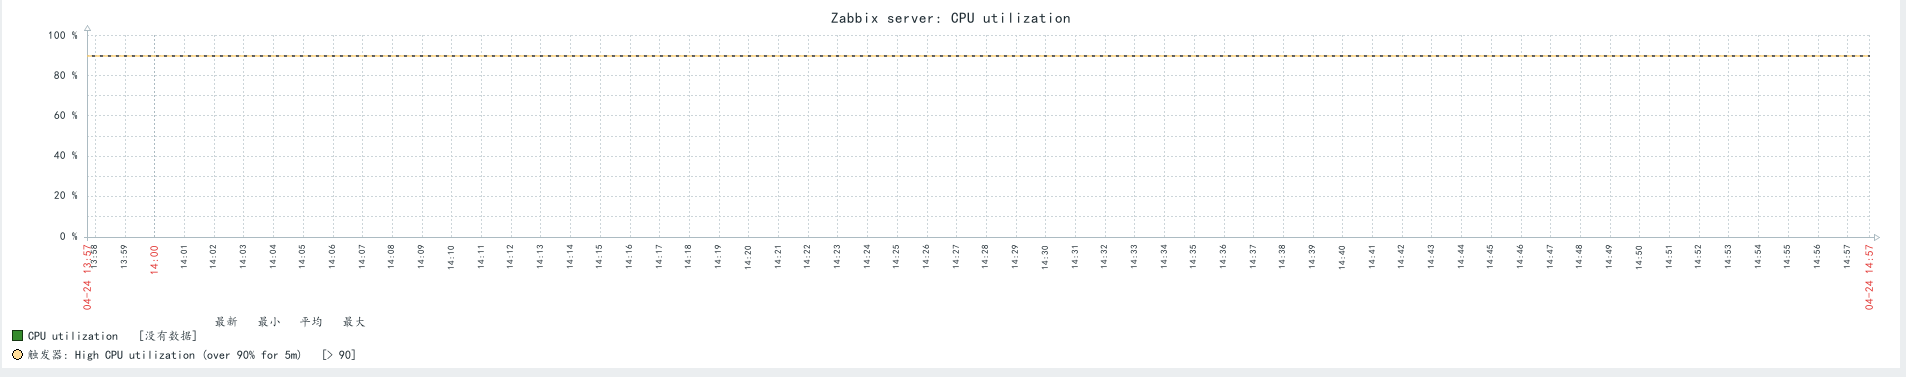
目前还没有找到原因,将会持续更新~~~~~

 浙公网安备 33010602011771号